| Journal of Endocrinology and Metabolism, ISSN 1923-2861 print, 1923-287X online, Open Access |
| Article copyright, the authors; Journal compilation copyright, J Endocrinol Metab and Elmer Press Inc |
| Journal website https://jem.elmerpub.com |
Original Article
Volume 16, Number 2, April 2026, pages 82-92

Weight Loss Intervention and Early Biomarker Search in Middle-Aged and Elderly Women: Early Signs of Body Composition Changes Indicated by Blood Cholinesterase and Cystatin C
Yayoi Tanakaa, b, e, Mayumi Horikia, c, Etsuko Ozakid, Risae Nakamuraa, Yasuka Okamotoa, Keisuke Fukuoa, Eiji Yamatoc
aResearch Institute for Health Sciences, Mukogawa Women’s University, Hyogo, Japan
bGraduate School of Nutrition and Food Sciences, Mukogawa Women’s University, Nishinomiya, Hyogo, Japan
cDepartment of Nutrition and Food Sciences, Mukogawa Women’s University, Nishinomiya, Hyogo, Japan
dDepartment of Nursing Faculty of Health and Medical Sciences, Kyoto University of Advanced Science, Kyoto, Japan
eCorresponding Author: Yayoi Tanaka, Graduate School of Nutrition and Food Sciences, Mukogawa Women’s University, Nishinomiya, Hyogo 663-8558, Japan
Manuscript submitted December 24, 2025, accepted March 14, 2026, published online April 8, 2026
Short title: BChE and Cystatin C as Early Body Composition Markers
doi: https://doi.org/10.14740/jem1628
| Abstract | ▴Top |
Background: This study aimed to comprehensively examine the effects of participation in a dietary intervention program on body composition and multiple hematological and biochemical markers in middle-aged and older women, particularly identifying the biomarkers that fluctuate in conjunction with changes in body composition.
Methods: A 6-month dietary intervention program was conducted involving 33 middle-aged and older women (mean age 60.9 ± 11.0 years, mean body mass index (BMI) 24.8 ± 3.2 kg/m2). The body composition and nonfasting blood parameters were measured before and after the intervention. In this study, pre- or post-intervention changes and correlated changes in body composition were compared with blood parameters.
Results: Participation in the dietary program led to significant reductions in body weight, BMI, body fat mass, body fat percentage, and waist circumference. The blood parameters showing significant decreases were white blood cell count, red blood cell count, aspartate aminotransferase, alanine aminotransferase, and cholinesterase. The change in body fat mass (Δbody fat mass) was positively correlated with the change in cholinesterase (Δcholinesterase, r = 0.483). Multiple regression analysis identified Δcholinesterase (β = 0.505) as an independent explanatory variable for Δbody fat mass. In addition, Δcystatin C (β = 0.500) was considered an independent explanatory variable for the change in waist circumference (Δwaist circumference).
Conclusions: The findings of this study indicate that cholinesterase and cystatin C may capture fluctuations in body composition earlier than conventional inflammatory markers. Consequently, they may be useful, simple, and objective indicators for evaluating the effectiveness of lifestyle interventions.
Keywords: Cholinesterase; Cystatin C; Obesity; Early biomarker of body composition change
| Introduction | ▴Top |
The increasing prevalence of noncommunicable diseases has become a major social problem, which is largely attributable to obesity. Middle-aged and older women face a higher risk because of hormonal influences that promote fat accumulation and increase susceptibility to lifestyle-related diseases [1, 2]. Obesity is more than simple weight gain; the accumulation of excess body fat induces profound physiological and biochemical changes. This excessive fat leads to macrophage infiltration into adipose tissue and the release of inflammatory cytokines, such as tumor necrosis factor-α, which initiate a chronic inflammatory state. Therefore, obese individuals typically exhibit higher C-reactive protein (CRP) and white blood cell (WBC) counts compared with nonobese individuals [3]. Furthermore, excessive body fat causes adipocyte hypertrophy and dysfunction, resulting in increased efflux of free fatty acids (FFAs) from adipose tissue. This excess FFA accumulates as ectopic fat in nonadipose tissues such as the liver and skeletal muscle. This phenomenon, which is known as lipotoxicity, primarily causes insulin resistance and organ dysfunction [4]. Based on the biomarkers of liver and adipose dysfunction, metabolic dysfunction-associated steatotic liver disease is a key manifestation of ectopic fat accumulation, showing extremely high prevalence in obese populations [5]. Liver damage resulting from fat accumulation is clinically indicated by elevated blood levels of aspartate aminotransferase (AST), alanine aminotransferase (ALT), and gamma-glutamyl transpeptidase [6]. However, butyrylcholinesterase (BChE), which is the primary form of blood cholinesterase measured clinically, is a nonspecific esterase mainly synthesized in the liver [7]. As an indicator of liver protein synthesis, BChE correlates positively with metabolic disorders, including body mass index (BMI), hepatic fat content, and insulin resistance [8]. Therefore, analyzing BChE fluctuations provides valuable insights into the early evaluation of metabolic intervention efficacy. Another emerging marker is cystatin C. Although primarily used as a renal function indicator because of its production by all nucleated cells and independence from muscle mass [9], recent studies have highlighted its metabolic roles. Cystatin C is also produced by adipocytes, and it correlates positively with visceral fat mass even in adults with normal renal function [10]. Therefore, cystatin C may serve as a novel marker reflecting visceral fat accumulation and an adipokine-like substance reflecting adipose tissue dysfunction and chronic inflammation. Despite the significance of these changes, studies that comprehensively examine the mechanism, by which these early metabolic and hepatic markers reflect body composition changes following lifestyle interventions, are limited. In particular, few investigations have focused on the combined fluctuations of cholinesterase (as an initial marker of metabolic abnormality) and cystatin C (as a marker of visceral fat). Therefore, this study aims to comprehensively examine the effects of participation in a dietary improvement program on body composition and multiple hematological and biochemical markers, focusing on identifying early biomarkers that correlate with changes in body composition.
| Materials and Methods | ▴Top |
Subjects
A total of 59 middle-aged and older women, who took part in the Mukogawa Women’s University Dietary Improvement Program between 2018 and 2023, were enrolled in this study. Of these, 33 participants (mean age 60.9 ± 11.0 years) were selected for the study (Table 1), after excluding 11 participants who attended the online course, seven whose course was canceled midway because of the impact of coronavirus disease 2019 (COVID-19), and eight who had missing body composition and blood test results.
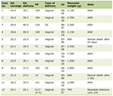 Click to view | Table 1. Subject Characteristics |
Dietary improvement program
The dietary improvement program was implemented once a month for 6 months. Each session included body composition measurement and individual counseling on diet. Blood tests were conducted before the program started and after 6 months.
The lecture lasted approximately 90 min and provided dietary guidance based on an original food constitute table. This food composition table was designed for 1,200 kcal/day, excluding the calories from seasonings, and it indicated the appropriate intake amount for each food group (protein-rich foods, vegetables, fruits, potatoes/starches, grains, and fats/oils).
In the program, the actual total daily energy intake would fall within the range of approximately 1,480–1,600 kcal/day by appropriately adding the energy from seasonings (sugar, soy sauce, miso, etc.) that are used in cooking, in addition to the 1,200 kcal shown in the table.
With regard to the individual dietary counseling, the focus of the guidance varied in accordance with the participant’s status: energy optimization was emphasized for those who needed weight loss, whereas nutritional balance optimization was prioritized for those who did not require weight reduction. The lecture content included practical skills training, such as the basics of meal preparation following the food composition table, selection criteria for dining out, and simple cooking modifications for home use.
Anthropometric measurements
Height was measured using a stadiometer only before the program started. Body composition analysis was performed using a bioelectrical impedance analyzer (InBody 430; InBody Japan, Tokyo, Japan). BMI was calculated from the measured height and weight. Waist circumference was measured by a skilled registered dietitian at the umbilicus.
Blood test
The blood tests were conducted in the morning without fasting (nonfasting state). The collected blood was subjected to preprocessing required for each analysis and then sent to LSI Medience Corporation (Tokyo, Japan) for analysis. The estimated glomerular filtration rate (eGFR), which is an indicator of renal function, was calculated by applying the estimation formula for Japanese individuals based on the serum creatinine levels recommended by the Japanese Society of Nephrology [11].
Statistical analysis
Analysis was performed using IBM SPSS Statistics 25.0 for Windows (IBM Japan, Ltd., Tokyo, Japan). The level of significance was set at less than 5% (P < 0.05, two-sided test). The Wilcoxon signed-rank test was used for the before and after comparison of age and body composition. Spearman’s rank correlation coefficient was calculated to examine the relationship between body composition and blood parameters. Multiple regression analysis was conducted to investigate the association between the change in body composition and the change in blood test items. In the multiple regression analysis model, the change in body composition was included as the dependent variable, and age was included as a covariate in addition to the change in blood test items.
Ethical considerations
The study was approved by the Ethics Committee of Mukogawa Women’s University and was conducted in compliance with the ethical standards of the responsible institution on human subjects as well as with the Helsinki Declaration (Approval No. 22–63).
Prior to the study’s implementation, all participants were fully informed, orally and in writing, regarding the purpose, content, duration, voluntary nature of participation, expected benefits and disadvantages, protection of personal information, and the right to withdraw from participation at any time. An informed consent was also obtained from all participants.
| Results | ▴Top |
The characteristics of the participants are shown in Table 1. In addition, the results of the body composition measurements before and after the program are shown in Table 2. Weight, BMI, body fat mass, body fat percentage, skeletal muscle mass, muscle mass, upper limb/trunk/lower limb fat mass, upper limb/trunk muscle mass, and waist circumference significantly decreased after the program.
Click to view | Table 2. Body Composition and Changes Before and After the Course |
The results of the blood parameters before and after the program are shown in Table 3. WBC counts, red blood cell (RBC) counts, AST, ALT, and cholinesterase significantly decreased after the program.
Click to view | Table 3. Blood Parameters Before and After the Course |
The associations between body composition and each blood parameter were examined for the preintervention values and the changes in values (Tables 4, 5 and Fig. 1). Detailed descriptions of the correlations for upper limb/trunk/lower limb fat mass and muscle mass were omitted, as they showed similar trends to the correlations for the total body fat mass, total muscle mass, and skeletal muscle mass.
Click to view | Table 4. The Relationship Between Baseline Body Composition and Blood Parameters |
Click to view | Table 5. Correlation Between Changes in Body Composition and Changes in Blood Parameters |
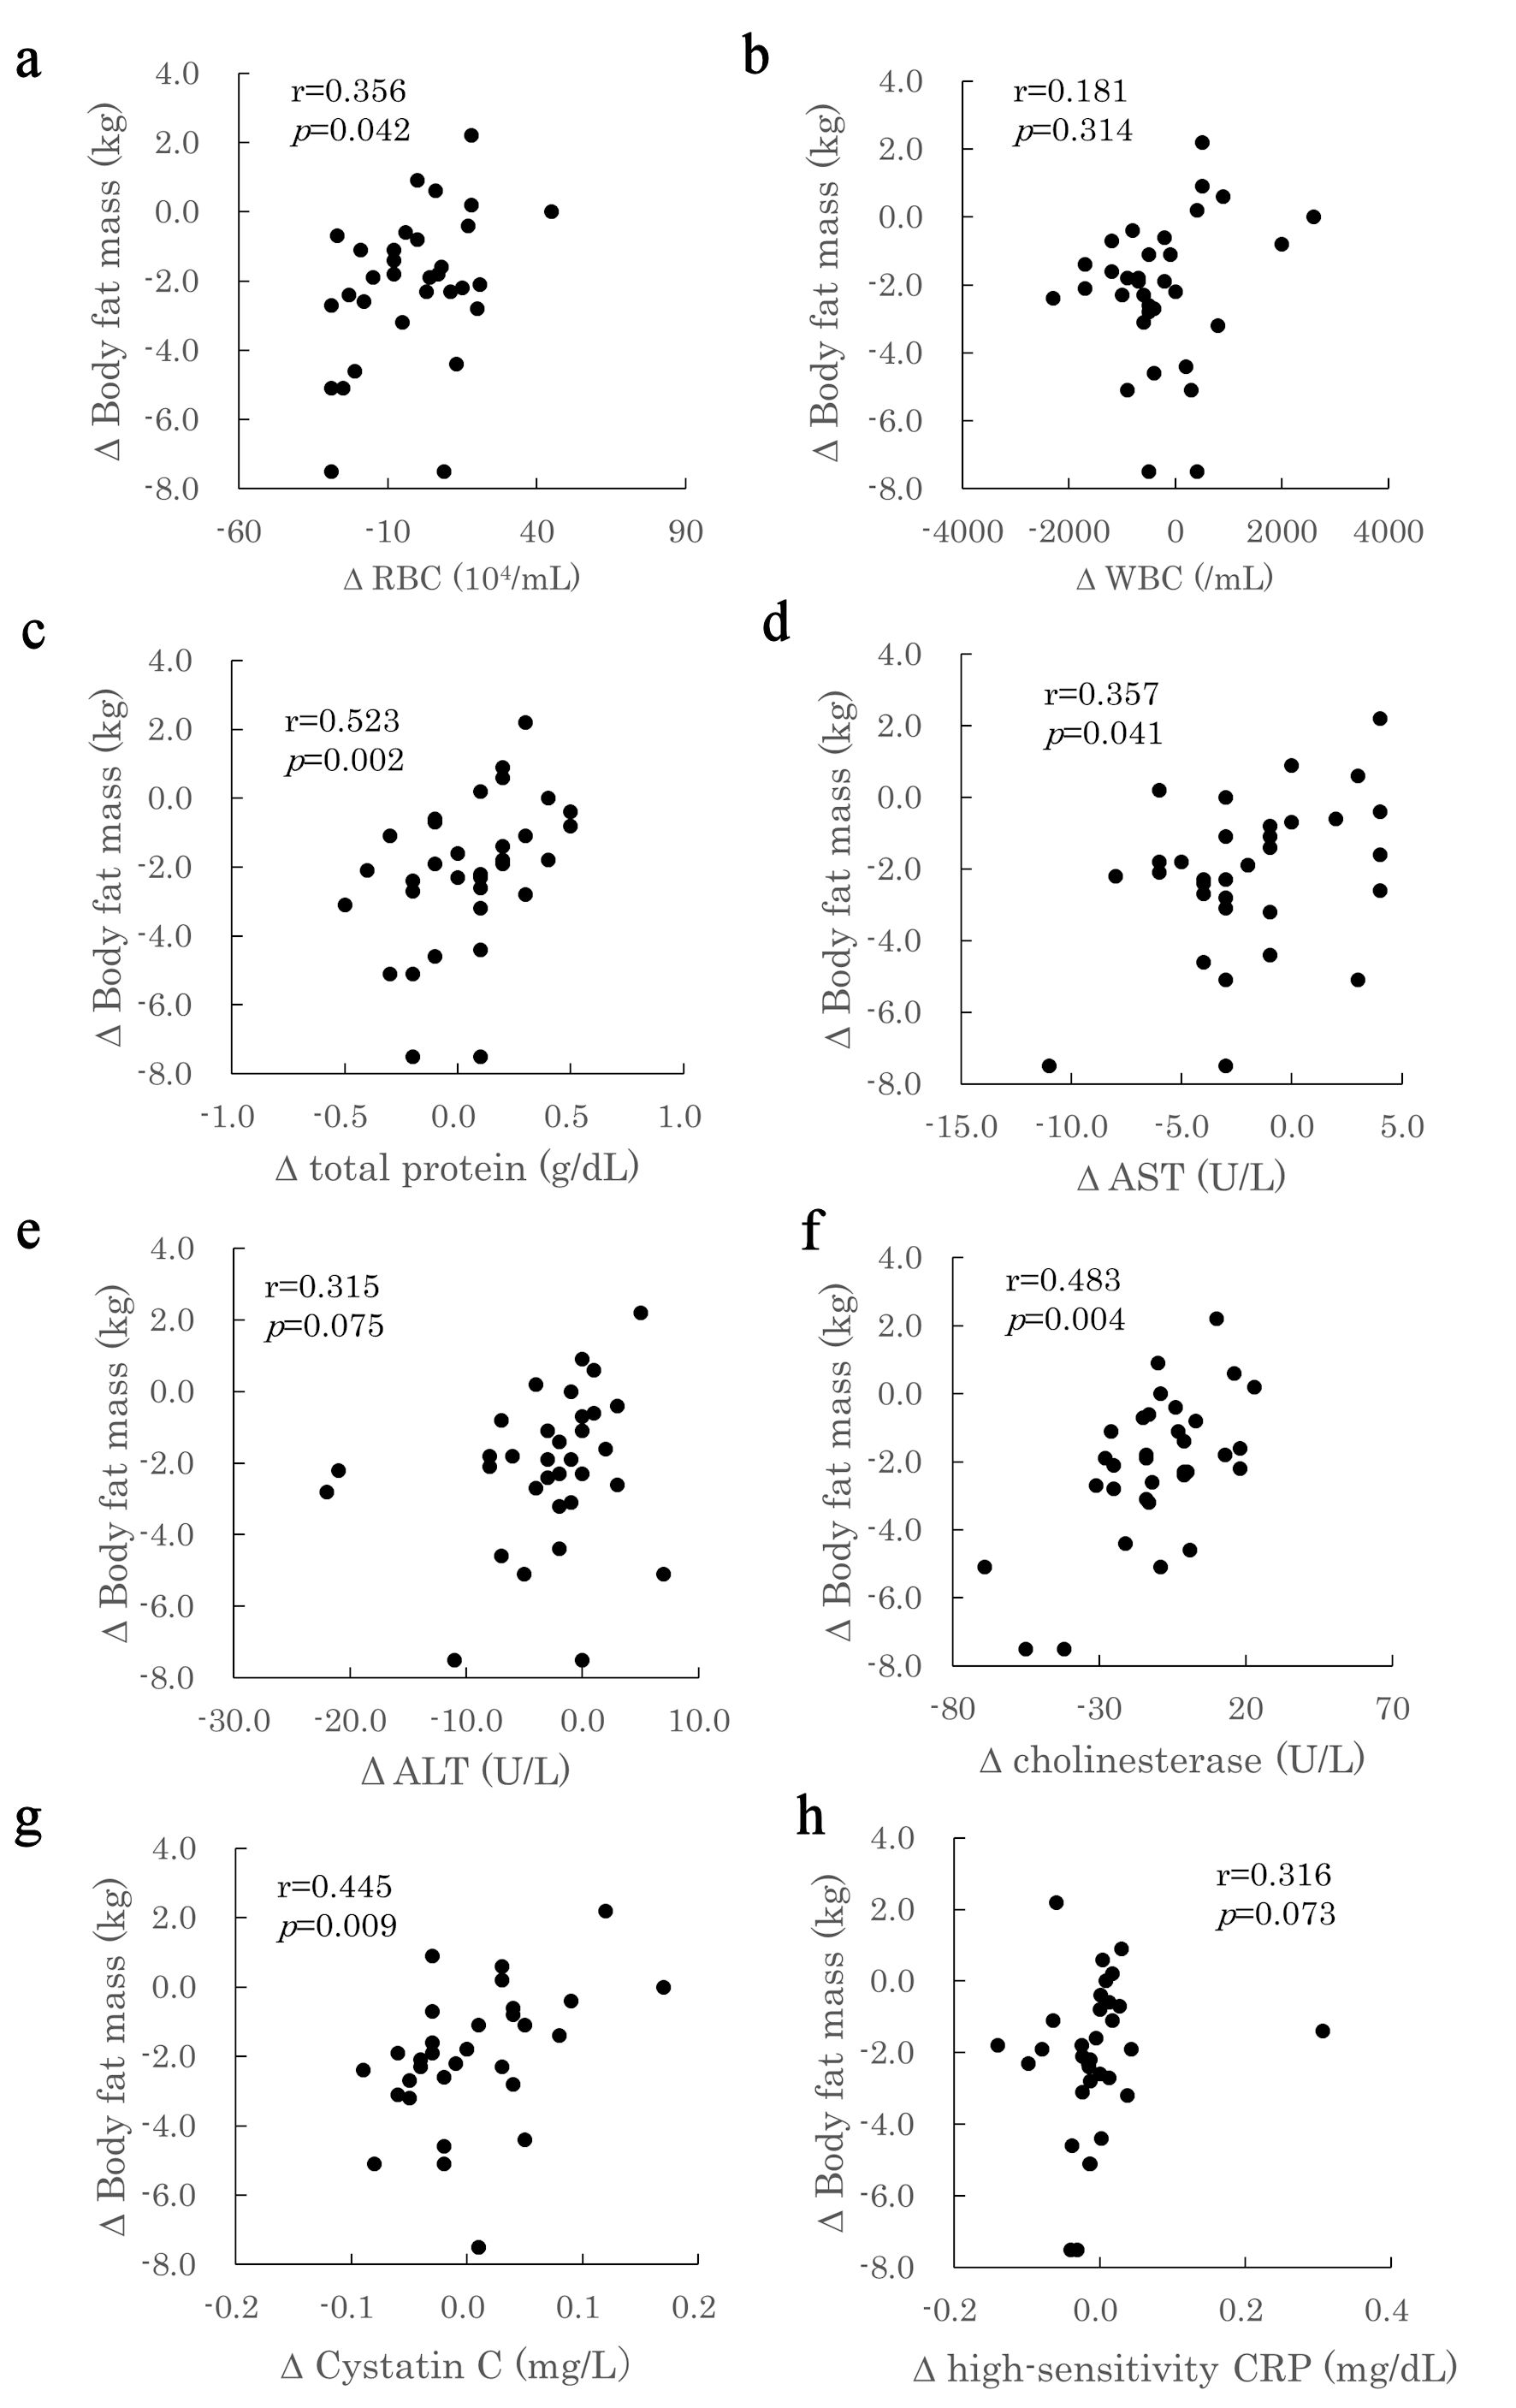 Click for large image | Figure 1. Correlation between changes in body fat mass and changes in blood parameters. The relationship between the change (Δ) in body fat mass (y) and the change (Δ) in various blood parameters (x) in study participants is shown. (a) ΔRed blood cell count (RBC); (b) ΔWhite blood cell count (WBC); (c) ΔTotal protein; (d) ΔAspartate aminotransferase (AST); (e) ΔAlanine aminotransferase (ALT); (f) ΔCholinesterase; (g) ΔCystatin C; (h) ΔHigh-sensitivity C-reactive protein (CRP). |
Upon examining the correlation among weight, BMI, and various blood parameters at preintervention, significantly positive correlations were observed. In particular, weight was positively correlated with RBC count (r = 0.517), hemoglobin (r = 0.540), hematocrit (r = 0.509), and high-sensitivity CRP (r = 0.360). Similarly, BMI was significantly and positively correlated with RBC count (r = 0.432), hemoglobin (r = 0.549), hematocrit (r = 0.524), and high-sensitivity CRP (r = 0.506). Furthermore, weight was significantly and negatively correlated with inorganic phosphate (r = −0.369). BMI was also positively correlated with WBC count (r = 0.374), cholinesterase (r = 0.427), uric acid (r = 0.466), and glycated hemoglobin (HbA1c, r = 0.362). Based on the correlations involving body fat mass and body fat percentage with blood parameters, significantly positive associations were observed across multiple measures. These measures included WBC count (body fat mass r = 0.376, body fat percentage r = 0.344), RBC count (body fat mass r = 0.627, body fat percentage r = 0.552), hemoglobin (body fat mass r = 0.660, body fat percentage r = 0.618), hematocrit (body fat mass r = 0.663, body fat percentage r = 0.662), uric acid (body fat mass r = 0.453, body fat percentage r = 0.445), and high-sensitivity CRP (body fat mass r = 0.568, body fat percentage r = 0.690). In addition, body fat mass was significantly and positively correlated with HbA1c (r = 0.362), and body fat percentage was correlated with cholinesterase (r = 0.376). Finally, waist circumference and blood parameters were significantly and positively associated with WBC count (r = 0.456), RBC count (r = 0.565), hemoglobin (r = 0.539), hematocrit (r = 0.593), cholinesterase (r = 0.542), uric acid (r = 0.534), and high-sensitivity CRP (r = 0.609). A significantly negative correlation was observed between waist circumference and inorganic phosphate (r = −0.366).
In addition, the changes in body composition were correlated with the changes in blood parameters. The changes in body weight and BMI were significantly and positively correlated with the changes in AST (body weight r = 0.480, BMI r = 0.505), ALT (body weight r = 0.450, BMI r = 0.461), cholinesterase (body weight r = 0.382, BMI r = 0.353), and high-sensitivity CRP (body weight r = 0.355, BMI r = 0.369). The changes in body fat mass and body fat percentage were positively correlated with RBC count (body fat mass r = 0.356,% body fat r = 0.431), platelet count (body fat mass r = 0.348,% body fat r = 0.374), total protein (body fat mass r = 0.523,% body fat r = 0.604), cholinesterase (body fat mass r = 0.483,% body fat r = 0.511), and cystatin C (body fat mass r = 0.445,% body fat r = 0.420). Furthermore, cystatin C was significantly and positively correlated with waist circumference (r = 0.501).
In this study, multiple regression analysis was performed using the forced entry method to identify the factors influencing the changes in body composition (body weight, BMI, body fat mass, skeletal muscle mass, muscle mass and waist circumference), particularly body fat mass (Table 6). The independent variables included age and the change amounts of various blood parameters (RBC count, total protein, AST, ALT, cholinesterase, cystatin C, and high-sensitivity CRP). The coefficients of determination (R2) for each model were as follows: R2 = 0.506 (P = 0.016) for the change in body weight, R2 = 0.513 (P = 0.014) for the change in BMI, and R2 = 0.558 (P = 0.005) for the change in body fat mass, all of which were statistically significant. The change in body weight was significantly influenced by AST (β = 0.475, P = 0.047) and cholinesterase (β = 0.483, P = 0.007). The change in BMI was influenced by AST (β = 0.485, P = 0.042) and cholinesterase (β = 0.451, P = 0.011). The change in body fat mass was influenced by cholinesterase (β = 0.505, P = 0.003). These results indicate that AST is a factor influencing the changes in body weight and BMI, and that cholinesterase is a factor influencing the changes in body weight, BMI, and body fat mass.
Click to view | Table 6. Relationship Between Body Composition Change and Blood Parameter Change |
In addition, stepwise multiple regression analysis was performed using the same variables for changes in muscle mass, skeletal muscle mass, and waist circumference. A significant model was constructed only for changes in waist circumference (R2 = 0.250, P = 0.003), and cystatin C (β = 0.500, P = 0.003) was extracted as a significant explanatory variable for changes in waist circumference (Table 7).
Click to view | Table 7. Association Between Changes in Body Composition and Changes in Blood Parameters (Stepwise Method) |
When the effects of multicollinearity in these regression models were examined, the variance inflation factor (VIF) for each variable was less than 10. Furthermore, when correlations between each blood parameter were examined, no significant association was found between cholinesterase and cystatin C, confirming the independence of each explanatory variable (Table 8).
Click to view | Table 8. Correlation of Cholinesterase and Cystatin C With Changes in Blood Parameters |
| Discussion | ▴Top |
Obesity and an increase in body fat affect various hematological and biochemical markers. Thus, this study aimed to clarify how participation in a dietary improvement program influences these markers and body composition. We focused on the impact of short-term intervention on fluctuations in blood indicators and the identification of indices that could serve as early markers for changes in body composition, which we discuss for each item. Participation in the dietary improvement program resulted in significant changes in multiple blood indicators, including WBC count, RBC count, and liver function-related markers. Notably, the changes in serum cholinesterase and serum cystatin C were strongly correlated with the fluctuations in body composition, indicating the usefulness of these markers in capturing changes in hepatic lipid metabolism and body fat.
WBC counts of the subjects significantly decreased after the program. When examining the relationship with body composition, a significantly positive correlation was observed between the preprogram WBC count and body weight, BMI, body fat mass, and waist circumference, but no correlation was found with their changes. Based on previous reports, an increase in fat may directly increase CD4 count and total lymphocyte count [12, 13]. However, high-sensitivity CRP, which is an indicator of inflammatory response, showed a positive correlation with preprogram body composition, similar to WBC, but no correlation with the amount of change. These results indicate that a short-term reduction in body fat mass may not be sufficient to fully resolve the inflammatory response.
Similar to WBC count, RBC count also significantly decreased after the program. When the relationship with body composition was examined, a significant correlation was found between the preprogram values and body weight, BMI, body fat mass, percent body fat, and waist circumference. Obese individuals have a higher RBC count than normal-weight individuals [13] because of an increase in blood volume, as the metabolic demands of various tissues increase [14, 15], and because severe obesity causes a physical reduction in lung capacity, leading to chronic hypoxia (obesity hypoventilation syndrome) that secondarily increases RBC count [16]. Although the subjects in this study were not severely obese as reported in prior research, they may be experiencing a minor hypoxic state even before reaching obese hypoventilation syndrome, given that this condition can occur in Asians with lower BMIs compared with other races [17]. Obese hypoventilation syndrome has been reported to improve with weight loss [18], and in the current study, a correlation was observed between the change in RBC count and the change in body fat. This correlation results from the reduction in body fat, which can ameliorate the minor hypoxic state.
AST and ALT significantly decreased after the program, but all values remained within the standard range, and no subjects were suspected of having fatty liver. Furthermore, no significant correlation was found between the preprogram body composition and AST or ALT. However, a positive correlation was found between the changes in body weight and BMI and the changes in AST and ALT. Moreover, a positive correlation was found between the change in AST and the change in body fat mass, whereas no relationship was observed between the change in ALT and the change in body fat mass. Therefore, the mild improvement in liver inflammation caused by the reduction in body fat may have been reflected in AST, which has a shorter half-life than ALT.
In addition, the results of multiple regression analysis indicated that the change in AST was associated with changes in body weight, BMI, muscle mass, and fat-free mass. Apart from the liver, AST also exists in the skeletal muscle, heart, and kidney. Based on previous reports, muscle mass can decrease because of weight loss resulting from dietary restrictions [19], and the association revealed by multiple regression analysis of this study indicates the possibility that changes in muscle mass are reflected in AST.
Serum cholinesterase significantly decreased after the program. When the relationship between preprogram serum cholinesterase and body composition was examined, a significantly positive correlation was found with preprogram BMI and percent body fat. Furthermore, a significantly positive correlation was observed between the changes in body composition (body weight, BMI, body fat mass, and percent body fat) and the change in serum cholinesterase. In addition, serum cholinesterase was positively correlated with blood lipid parameters such as total cholesterol, low-density lipoprotein, and very low-density lipoprotein [8], and it is thought to increase during active lipid metabolism [20]. The positive correlation found in this study between preprogram BMI and percent body fat, as well as the positive correlation observed between changes in body composition and serum cholinesterase, are considered results that support this view. Moreover, although a positive correlation was found between the change in body fat mass and the change in serum cholinesterase, no correlation was observed between the change in ALT and the change in body fat mass. ALT is an indicator of fatty liver, which increases when liver cells are damaged, but the ALT values of the subjects in this study were within the standard range, indicating that they were not in a state severe enough to show liver cell damage. Therefore, the change in serum cholinesterase may be an initial sign of a change in hepatic lipid metabolism.
No significant change was observed in serum cystatin C concentration when comparing the pre- and post-program values, but a trend toward a positive correlation with preprogram waist circumference was found (P = 0.057). Based on previous reports, serum cystatin C is positively correlated with visceral fat in women [21], and waist circumference is an indicator of visceral fat [22]. The trend of a positive correlation between cystatin C and waist circumference observed in this study is consistent with these previous reports. Furthermore, a positive correlation was found between the change in cystatin C and the changes in body fat mass, percent body fat, and waist circumference. Considering that cystatin C is also produced in adipose tissue, it has been reported that an increase in adipose tissue may contribute to the increase in circulating serum cystatin C concentration [10], and the results of this study support this finding. No relationship was observed between preprogram body composition and serum cystatin C, but a correlation was found when comparing the amounts of change post program. Therefore, although the blood concentration of cystatin C may vary because of the original cell number or cell size of an individual, it is an indicator that fluctuates when cell number or cell size changes. Moreover, although inflammatory response markers such as high-sensitivity CRP and WBC count are indicators related to changes in body fat mass, no association with cystatin C was found in the results of this study (Table 8). Therefore, cystatin C could serve as an indicator to capture fluctuations in body fat more quickly.
This study has also some limitations. First, the small sample size of 33 participants and the restriction to middle-aged and elderly women limit the generalizability of these findings, thereby requiring caution when applying the results to other genders or age groups. Second, because blood tests in this study were conducted under nonfasting conditions, caution is required in interpreting glucose metabolism indicators. However, it has been reported that fasting is not necessarily required for the assessment of lipid metabolism [23]. Furthermore, the main indicators in this study, cystatin C and cholinesterase, are known to exhibit minimal short-term fluctuations due to dietary intake [24, 25]. For these reasons, the impact of food intake on the main results of this study was limited, and assessment using random blood samples is considered appropriate. In addition, visceral fat mass was not obtained from image diagnostics such as computed tomography (CT) scans or magnetic resonance imaging (MRI). Although waist circumference is a valid simple indicator of visceral fat, caution is warranted, especially in women, because of the typically high volume of subcutaneous fat. Furthermore, we were unable to identify which specific dietary component contributed most to the changes in the biomarkers. Based on previous reports, increased de novo lipogenesis from carbohydrates or increased availability of FFAs may lead to an increase in BChE activity [26]; the association with these factors requires future investigation.
Conclusions
The results of this study indicate that the 6-month dietary improvement program for middle-aged and older women significantly reduced body weight, body fat mass, and waist circumference, while significantly decreasing the concentrations of serum cholinesterase, AST, and ALT, as well as RBC count. Notably, the change in cholinesterase was independently identified as an early biomarker explaining the change in body fat mass, and the change in cystatin C was identified as an early biomarker explaining the change in waist circumference. These markers can detect fluctuations in body composition earlier than conventional inflammatory markers (high-sensitivity CRP and WBC), and they can be useful indicators for a simple and objective evaluation of the efficacy of lifestyle interventions.
Acknowledgments
This work was supported by MEXT’s Subsidy Program for Human Resource Development for Science and Technology, Initiative for Realizing Diversity in the Research Environment (Type of Women’s Leadership Development), Program for Developing the Next Generation of Aspiring Women Leaders at a Women’s University.
Financial Disclosure
None to declare.
Conflict of Interest
None to declare.
Informed Consent
Written informed consent was obtained from all subjects who were enrolled in the study.
Author Contributions
YT and EY contributed to the analysis design, acquisition and interpretation of data and reviewed/edited the manuscript. MH, EO, RN, YO and KF contributed to the acquisition and interpretation of data and reviewed/edited the manuscript. All authors read and approved the final manuscript.
Data Availability
The data supporting the findings of this study are available from the corresponding author upon reasonable request.
Abbreviations
WBC: white blood cell; RBC: red blood cell; CRP: C-reactive protein; MCV: mean corpuscular volume; MCH: mean corpuscular hemoglobin; MCHC: mean corpuscular hemoglobin concentration; AST: aspartate aminotransferase; ALT: alanine aminotransferase; GGT: gamma-glutamyl transpeptidase; HDL: high-density lipoprotein; LDL: low-density lipoprotein; eGFR: estimated glomerular filtration rate
| References | ▴Top |
- Sumino H, Ichikawa S, Yoshida A, Murakami M, Kanda T, Mizunuma H, Sakamaki T, et al. Effects of hormone replacement therapy on weight, abdominal fat distribution, and lipid levels in Japanese postmenopausal women. Int J Obes Relat Metab Disord. 2003;27(9):1044-1051.
doi pubmed - Ministry of Health, Labour and Welfare (Japan). National Health and Nutrition Survey of Japan, Reiwa 5 (2023): summary of results. Available from: https://www.mhlw.go.jp/stf/newpage_45540.html (in Japanese). [cited Oct 27, 2025].
- Hotamisligil GS, Shargill NS, Spiegelman BM. Adipose expression of tumor necrosis factor-alpha: direct role in obesity-linked insulin resistance. Science. 1993;259(5091):87-91.
doi pubmed - Lair B, Laurens C, Van Den Bosch B, Moro C. Novel insights and mechanisms of lipotoxicity-driven insulin resistance. Int J Mol Sci. 2020;21(17).
doi pubmed - Eguchi Y, Hyogo H, Ono M, Mizuta T, Ono N, Fujimoto K, Chayama K, et al. Prevalence and associated metabolic factors of nonalcoholic fatty liver disease in the general population from 2009 to 2010 in Japan: a multicenter large retrospective study. J Gastroenterol. 2012;47(5):586-595.
doi pubmed - Xuan Y, Wu D, Zhang Q, Yu Z, Yu J, Zhou D. Elevated ALT/AST ratio as a marker for NAFLD risk and severity: insights from a cross-sectional analysis in the United States. Front Endocrinol (Lausanne). 2024;15:1457598.
doi pubmed - Gok M, Cicek C, Bodur E. Butyrylcholinesterase in lipid metabolism: A new outlook. J Neurochem. 2024;168(4):381-385.
doi pubmed - Iwasaki T, Yoneda M, Nakajima A, Terauchi Y. Serum butyrylcholinesterase is strongly associated with adiposity, the serum lipid profile and insulin resistance. Intern Med. 2007;46(19):1633-1639.
doi pubmed - Abrahamson M, Olafsson I, Palsdottir A, Ulvsback M, Lundwall A, Jensson O, Grubb A. Structure and expression of the human cystatin C gene. Biochem J. 1990;268(2):287-294.
doi pubmed - Naour N, Fellahi S, Renucci JF, Poitou C, Rouault C, Basdevant A, Dutour A, et al. Potential contribution of adipose tissue to elevated serum cystatin C in human obesity. Obesity (Silver Spring). 2009;17(12):2121-2126.
doi pubmed - Matsuo S, Imai E, Horio M, Yasuda Y, Tomita K, Nitta K, Yamagata K, et al. Revised equations for estimated GFR from serum creatinine in Japan. Am J Kidney Dis. 2009;53(6):982-992.
doi pubmed - Womack J, Tien PC, Feldman J, Shin JH, Fennie K, Anastos K, Cohen MH, et al. Obesity and immune cell counts in women. Metabolism. 2007;56(7):998-1004.
doi pubmed - Yoshimura A, Ohnishi S, Orito C, Kawahara Y, Takasaki H, Takeda H, Sakamoto N, et al. Association of peripheral total and differential leukocyte counts with obesity-related complications in young adults. Obes Facts. 2015;8(1):1-16.
doi pubmed - Collis T, Devereux RB, Roman MJ, de Simone G, Yeh J, Howard BV, Fabsitz RR, et al. Relations of stroke volume and cardiac output to body composition: the strong heart study. Circulation. 2001;103(6):820-825.
doi pubmed - Cepeda-Lopez AC, Zimmermann MB, Wussler S, Melse-Boonstra A, Naef N, Mueller SM, Toigo M, et al. Greater blood volume and Hb mass in obese women quantified by the carbon monoxide-rebreathing method affects interpretation of iron biomarkers and iron requirements. Int J Obes (Lond). 2019;43(5):999-1008.
doi pubmed - Hodgson LE, Murphy PB, Hart N. Respiratory management of the obese patient undergoing surgery. J Thorac Dis. 2015;7(5):943-952.
doi pubmed - Harada Y, Chihara Y, Azuma M, Murase K, Toyama Y, Yoshimura C, Oga T, et al. Obesity hypoventilation syndrome in Japan and independent determinants of arterial carbon dioxide levels. Respirology. 2014;19(8):1233-1240.
doi pubmed - Mokhlesi B, Kryger MH, Grunstein RR. Assessment and management of patients with obesity hypoventilation syndrome. Proc Am Thorac Soc. 2008;5(2):218-225.
doi pubmed - Cava E, Yeat NC, Mittendorfer B. Preserving healthy muscle during weight loss. Adv Nutr. 2017;8(3):511-519.
doi pubmed - Furtado-Alle L, Tureck LV, de Oliveira CS, Hortega JVM, Souza RLR. Butyrylcholinesterase and lipid metabolism: possible dual role in metabolic disorders. Chem Biol Interact. 2023;383:110680.
doi pubmed - Mueller-Peltzer K, von Kruchten R, Lorbeer R, Rospleszcz S, Schulz H, Peters A, Bamberg F, et al. Adipose tissue is associated with kidney function parameters. Sci Rep. 2023;13(1):9151.
doi pubmed - Examination Committee of Criteria for 'Obesity Disease' in J, Japan Society for the Study of O. New criteria for 'obesity disease' in Japan. Circ J. 2002;66(11):987-992.
doi pubmed - Nordestgaard BG, Langsted A, Mora S, Kolovou G, Baum H, Bruckert E, Watts GF, et al. Fasting is not routinely required for determination of a lipid profile: clinical and laboratory implications including flagging at desirable concentration cut-points-a joint consensus statement from the European Atherosclerosis Society and European Federation of Clinical Chemistry and Laboratory Medicine. Eur Heart J. 2016;37(25):1944-1958.
doi pubmed - Tangri N, Stevens LA, Schmid CH, Zhang YL, Beck GJ, Greene T, Coresh J, et al. Changes in dietary protein intake has no effect on serum cystatin C levels independent of the glomerular filtration rate. Kidney Int. 2011;79(4):471-477.
doi pubmed - Santarpia L, Grandone I, Contaldo F, Pasanisi F. Butyrylcholinesterase as a prognostic marker: a review of the literature. J Cachexia Sarcopenia Muscle. 2013;4(1):31-39.
doi pubmed - Kutty KM, Huang SN, Kean KT. Pseudocholinesterase in obesity: hypercaloric diet induced changes in experimental obese mice. Experientia. 1981;37(11):1141-1142.
doi pubmed
This article is distributed under the terms of the Creative Commons Attribution 4.0 International License (CC BY 4.0), which permits unrestricted use, distribution, and reproduction in any medium, including commercial use, provided the original work is properly cited.
Journal of Endocrinology and Metabolism is published by Elmer Press Inc.