Figures
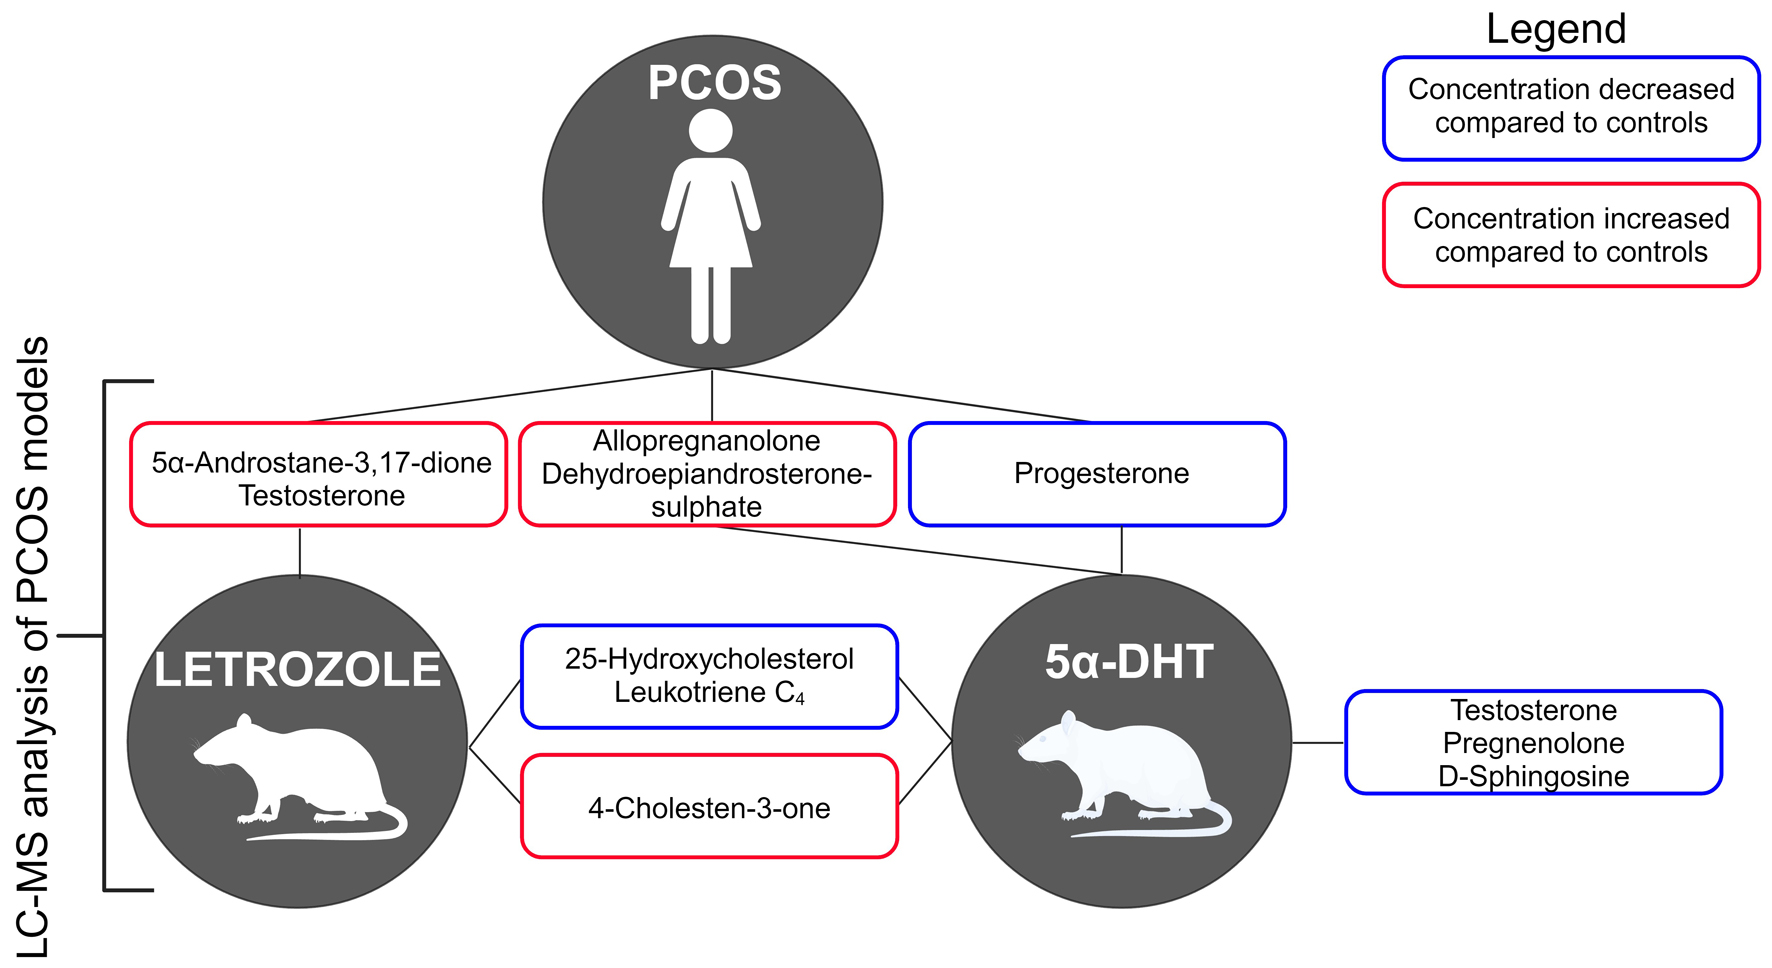
↓ Figure 1. Graphical abstract. Plasma lipid and
hormone profiling in a polycystic ovarian syndrome (PCOS) rat model. PCOS symptoms include excessive
body or facial hair, irregular periods, reduced fertility, and reoccurring pregnancy loss. To validate
the use of rat models for PCOS, we have optimized a mass spectrometry-based targeted lipidomics
workflow. Our work provides new insights into altered lipid and hormone profiles (red boxes - increased,
blue boxes - decreased abundance) associated with human disease, recapitulated partially in PCOS rat
models.
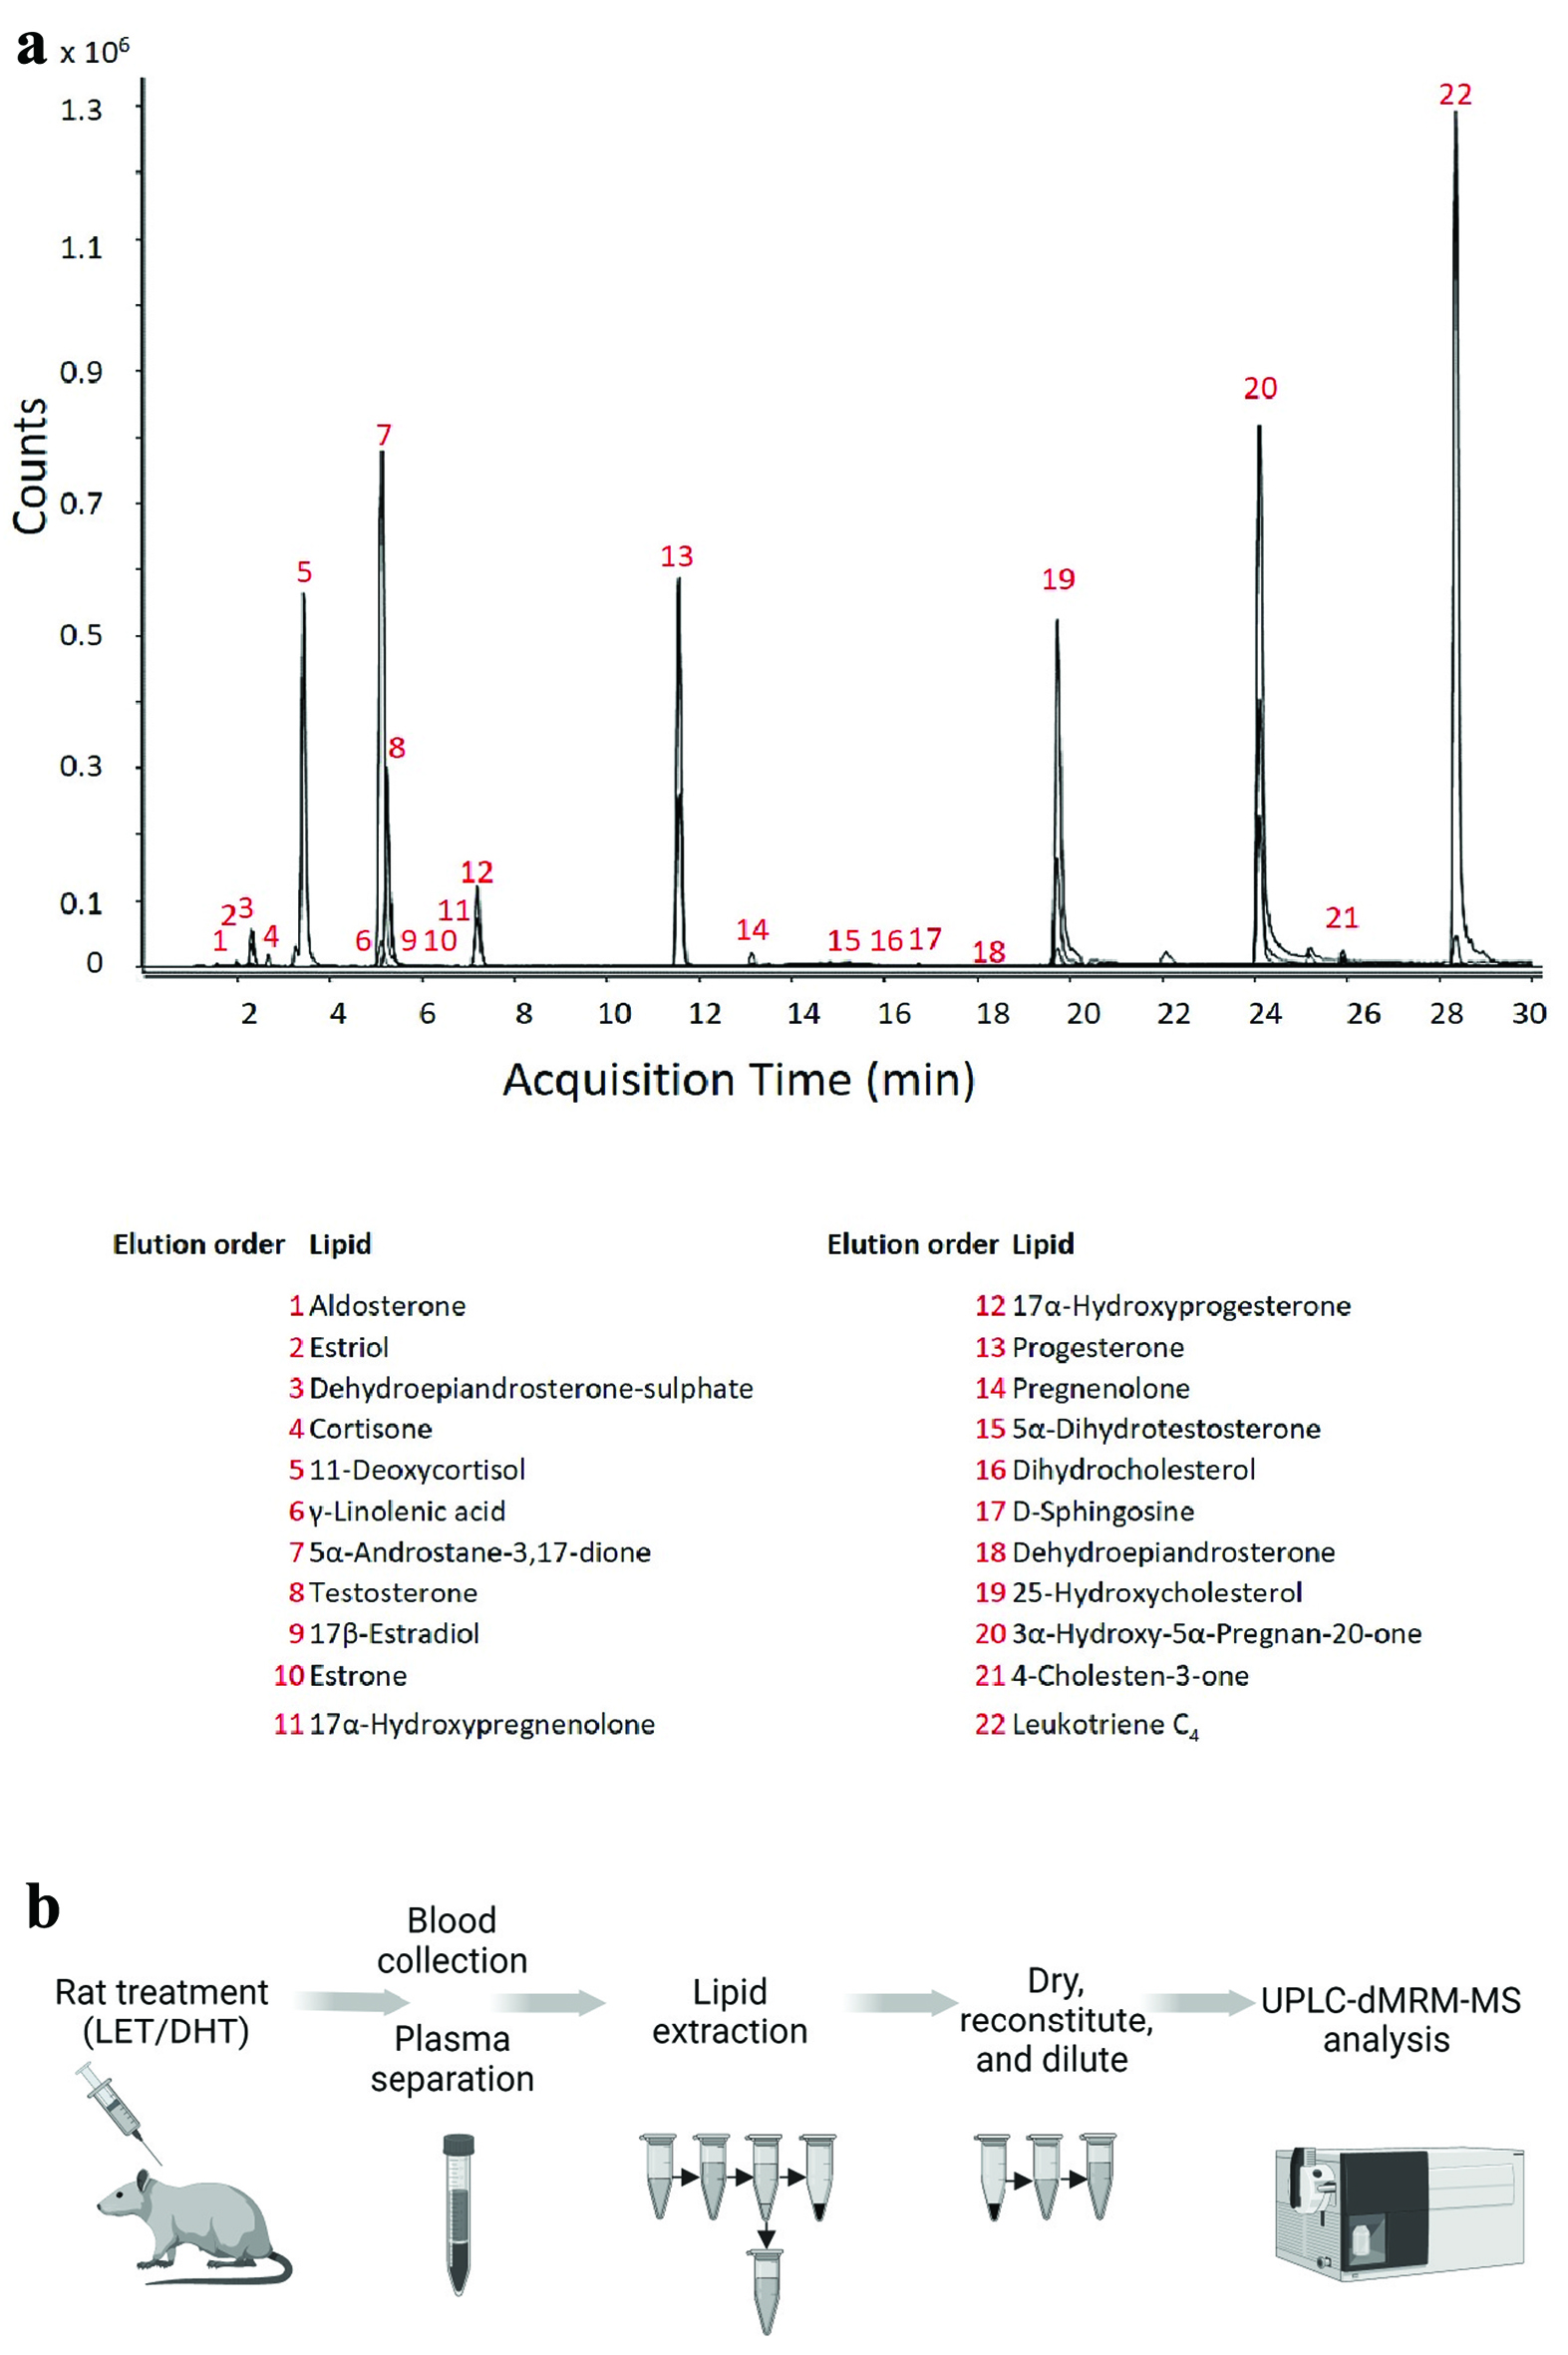
↓ Figure 2. Optimized lipid chromatography and
experimental workflow for the analysis of steroids, steroid hormones and bioactive lipids in rat plasma.
(a) The dynamic multiple reaction monitoring (dMRM) chromatograms for both quantitation and
qualification ions for all the lipids analyzed with this methodology. The lipids are analyzed at the
same on-column concentration of 300 fmol/L, the difference in counts for each lipid highlights the
differences in ionization efficiencies of the lipids (molecular structures of analyzed lipids are in
Supplementary Fig. 1, jem.elmerpub.com). (b) Analyses were conducted using an ultra-high-performance
liquid chromatography-dMRM-mass spectrometry (UPLC-dMRM-MS) analysis. Rats were treated with either
letrozole (LET) or dihydrotestosterone (DHT) to induce polycystic ovarian syndrome (PCOS)-like
physiology. At age 49 days, blood was taken from rats, and plasma was obtained by lithium-heparin
separation. Lipid extraction from plasma was performed with methanol/methyl-tert-butyl-ether (50:50,
v:v). Lipid extracts were subsequently dried and reconstituted into methanol prior to LC-MS
analysis.
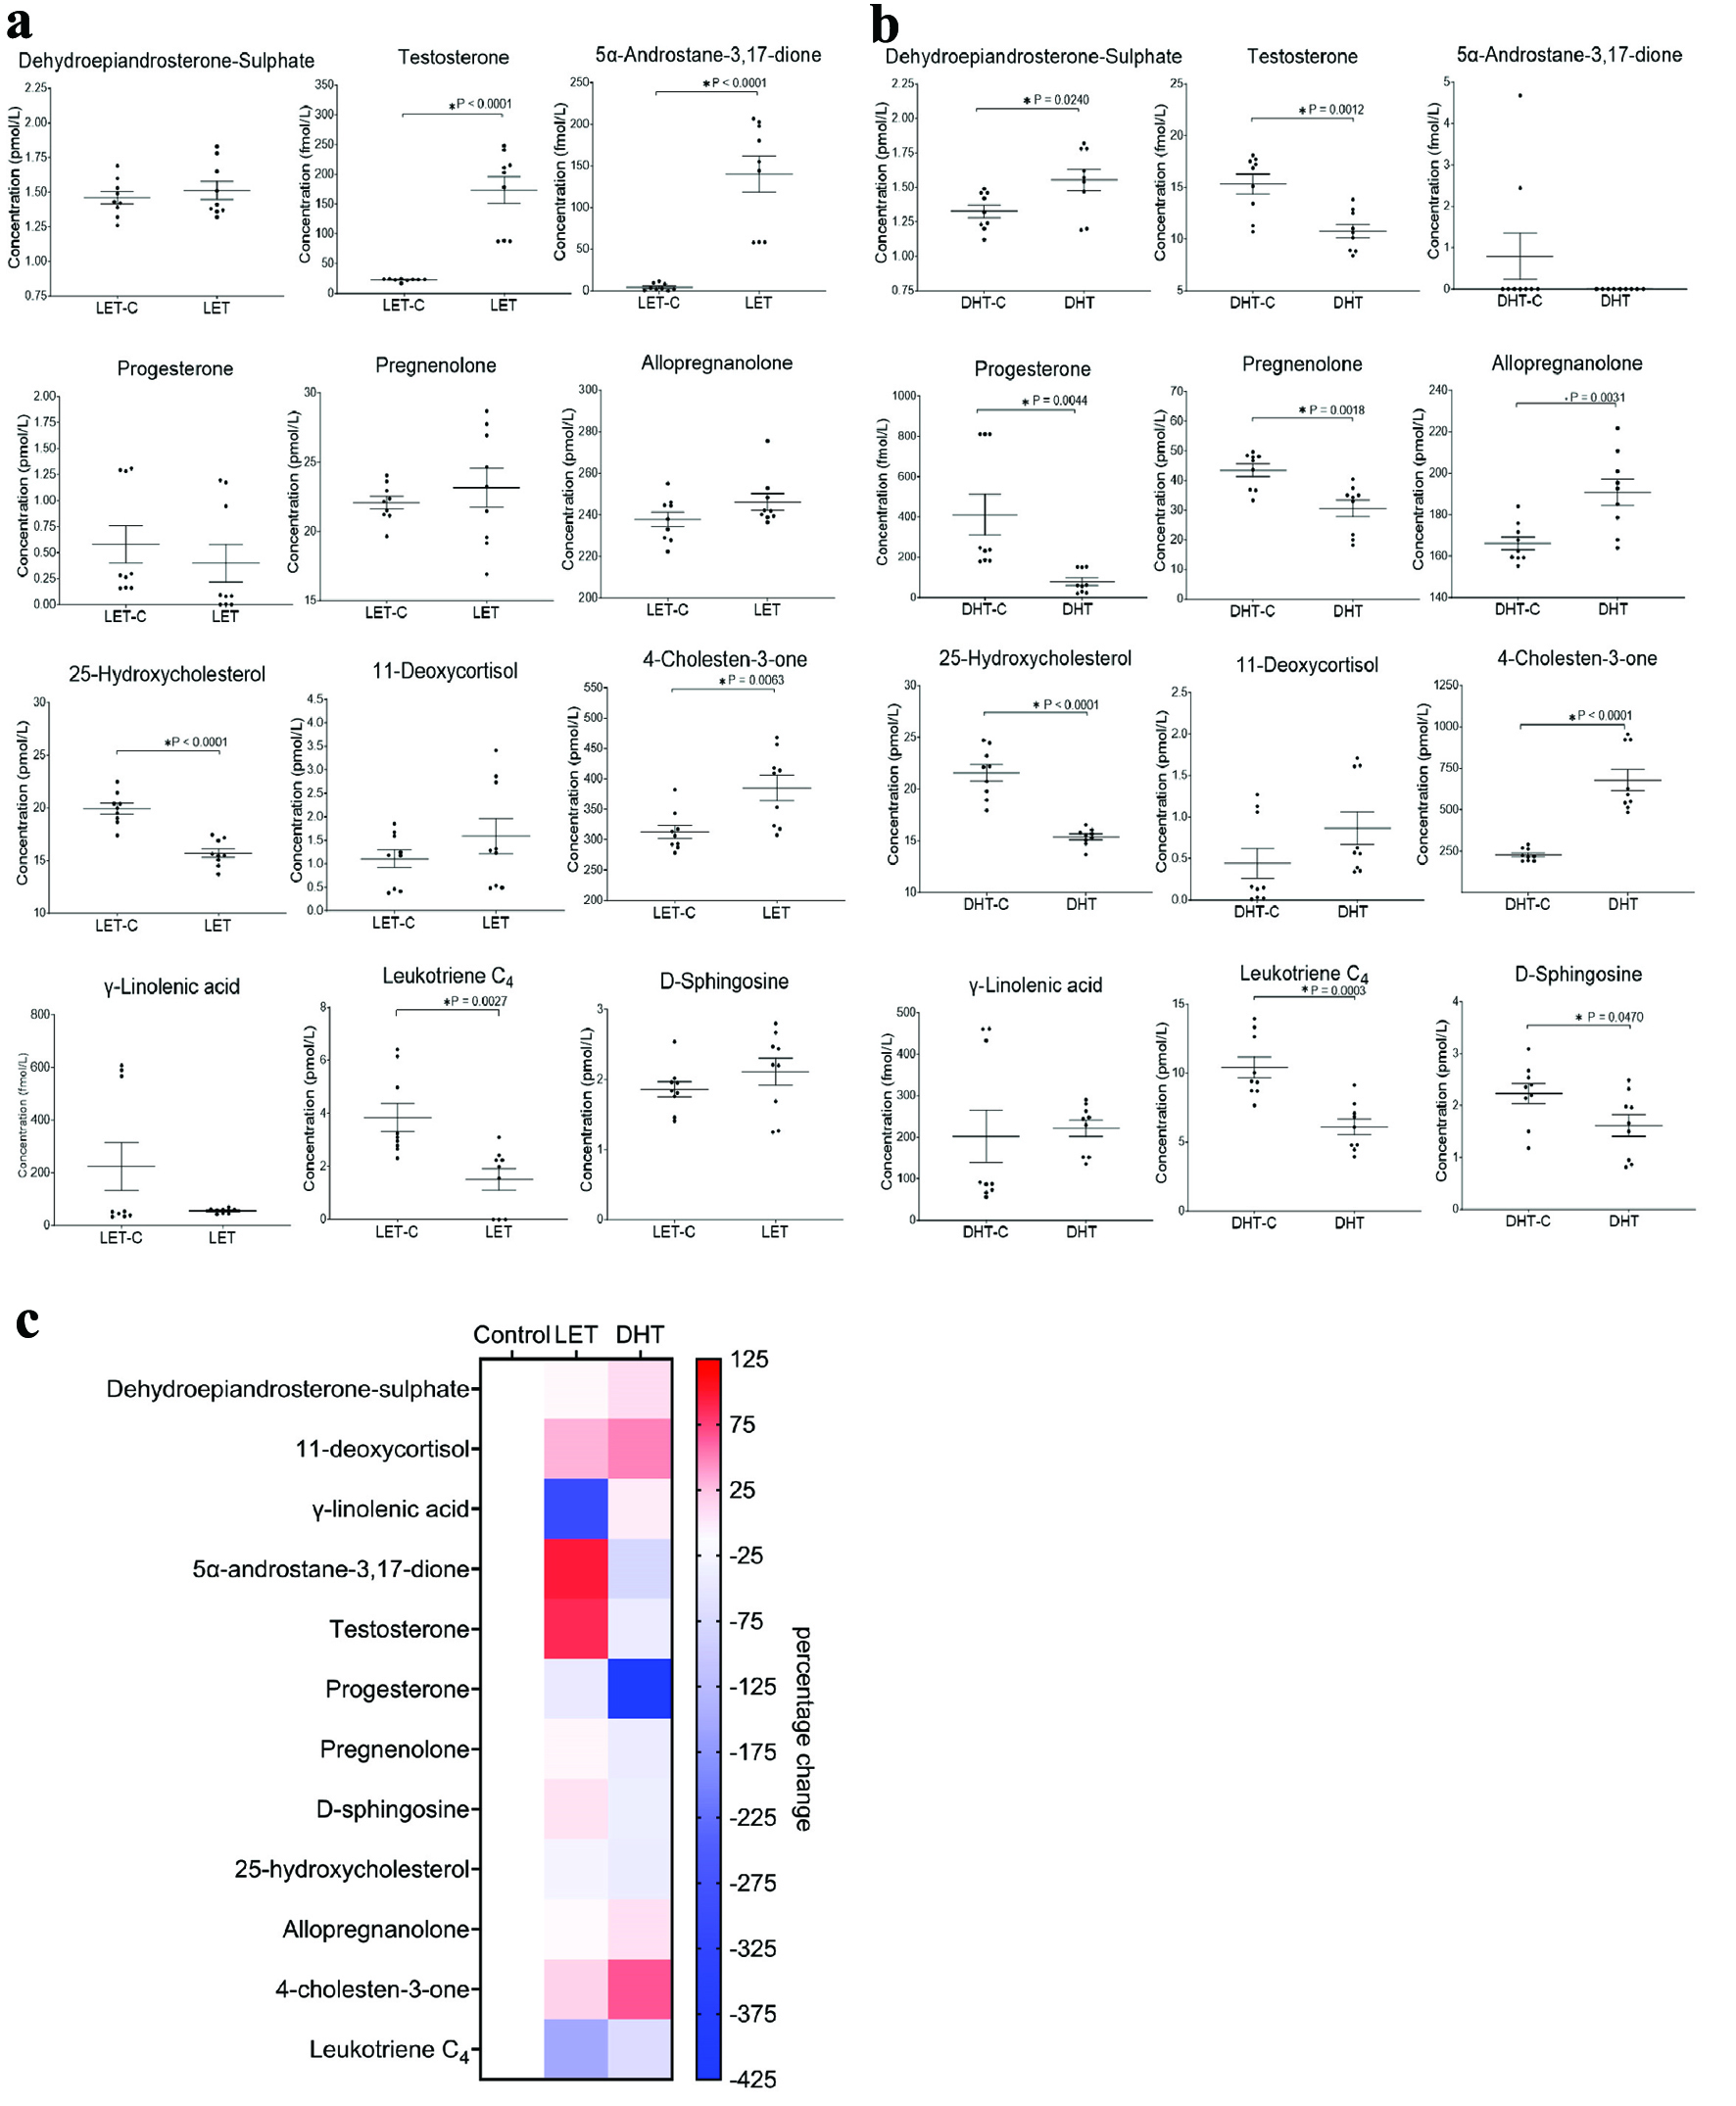
↓ Figure 3. Rat plasma profiles modulated by
letrozole (LET) and dihydrotestosterone (DHT). (a) Analysis of lipids in rat plasma after LET treatment.
LET induced polycystic ovarian syndrome (PCOS) in rats modulates steroid hormone biosynthesis, steroid
hormone degradation, eicosanoid and sphingolipid pathways. The letrozole control (LET-C) is on the left
and the LET treated is on the right. Black dots are each data point (technical triplicate of biological
triplicates, n = 9). The statistical analysis is the two-sample (or unpaired) t-test. A P-value
less than 0.05 (*) suggests that the results have highly significant differences. If there is no
significant difference, it is not labelled. Values for mean, standard deviation (SD) and population
number (n) are described in the Supplementary Materials section. (b) Analysis of lipids in rat plasma
after DHT treatment. DHT induced PCOS in rats modulates steroid hormone biosynthesis, steroid hormone
degradation, eicosanoid and sphingolipid pathways. Graphs represent the mean (line) with the standard
error of the mean (error bars). The DHT control is on the left and the DHT treated is on the right.
Black dots are each data point (technical triplicate of biological triplicates, n = 9). The statistical
analysis is the two-sample (or unpaired) t-test. A P-value less than 0.05 (*) suggests that the
results have highly significant differences. If there is no significance difference, it is not labelled.
Values for mean, standard deviation (SD) and population number (n) are described in the Supplementary
Materials section. (c) Analysis of lipids in rat plasma after LET or DHT treatment. Mean percentage
change of lipids in rat plasma, not-treated control (control) and treated with LET or DHT. Heat maps
display normalized lipid abundances relative to the mean concentration of the respective non-treated
control samples (control), which is represented by the white boxes. For LET or DHT treatment, blue
results are for a decrease in concentration, in percentage, white is for no change and red is for an
increase in concentration in percentage.
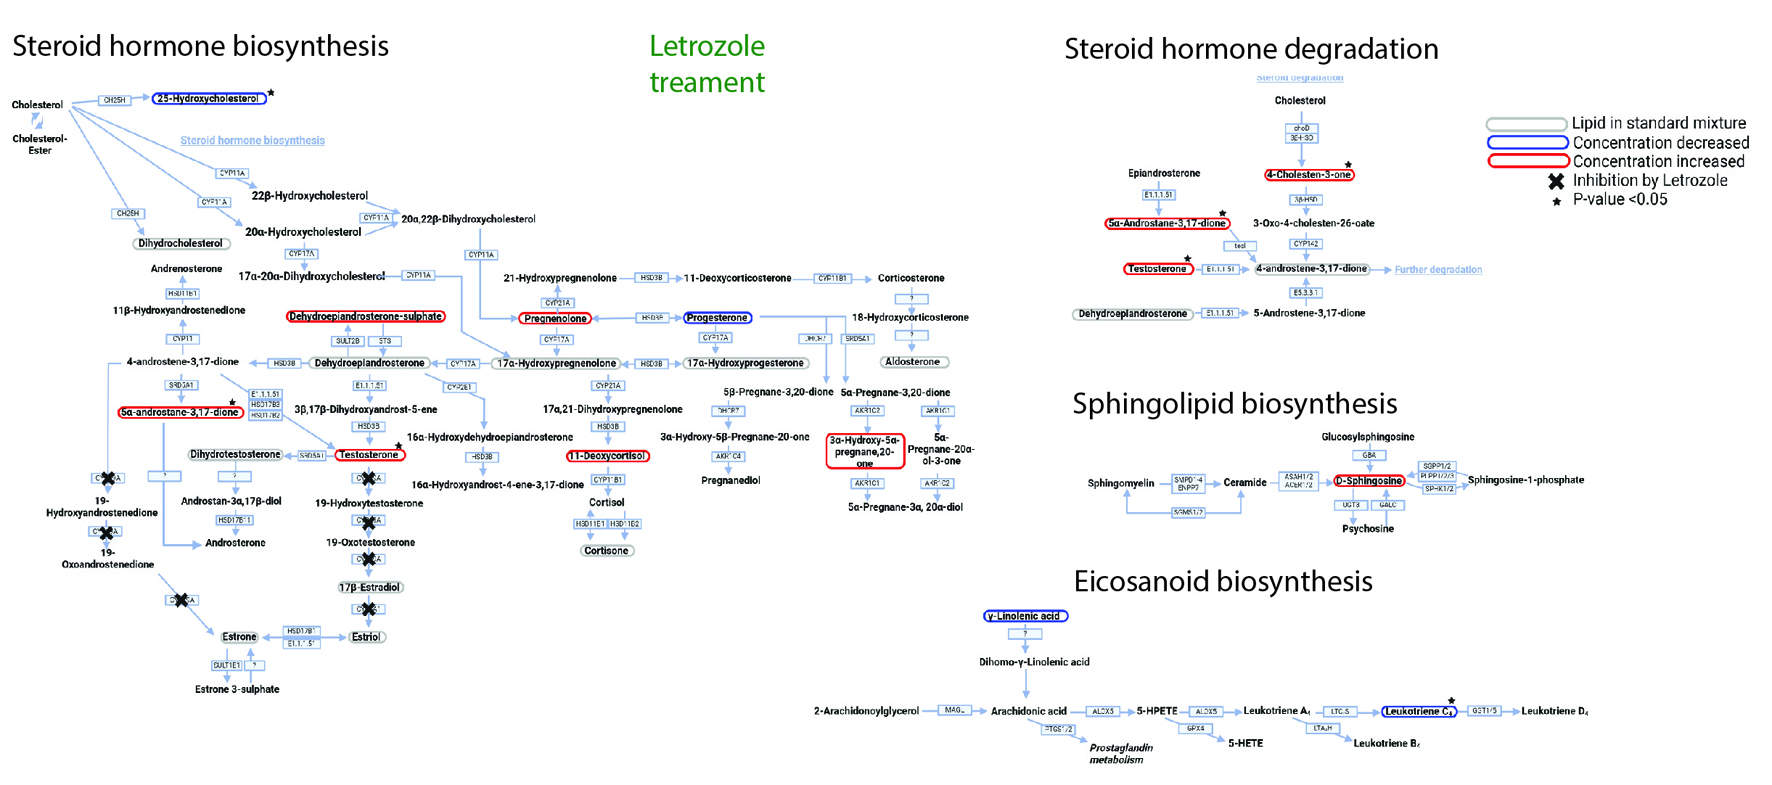
↓ Figure 4. Letrozole (LET) affects metabolic
networks. LET treatment pathway analysis. Lipid profile after treatment with LET. Converting enzymes are
in boxes and the lipids in this study are circled. Lipids circled in grey have either no change compared
to non-treated control rat plasma or were not detected with this methodology; lipids circled in blue
have a decreased concentration compared to non-treated control rats; and lipids circled in red have an
increased concentration compared to non-treated control rats. Lipids with a significant difference
between non-treated control and LET treated (a P-value of less than 0.05) are indicated by a black star
and inhibition of CYP19A activity by LET with a black cross.
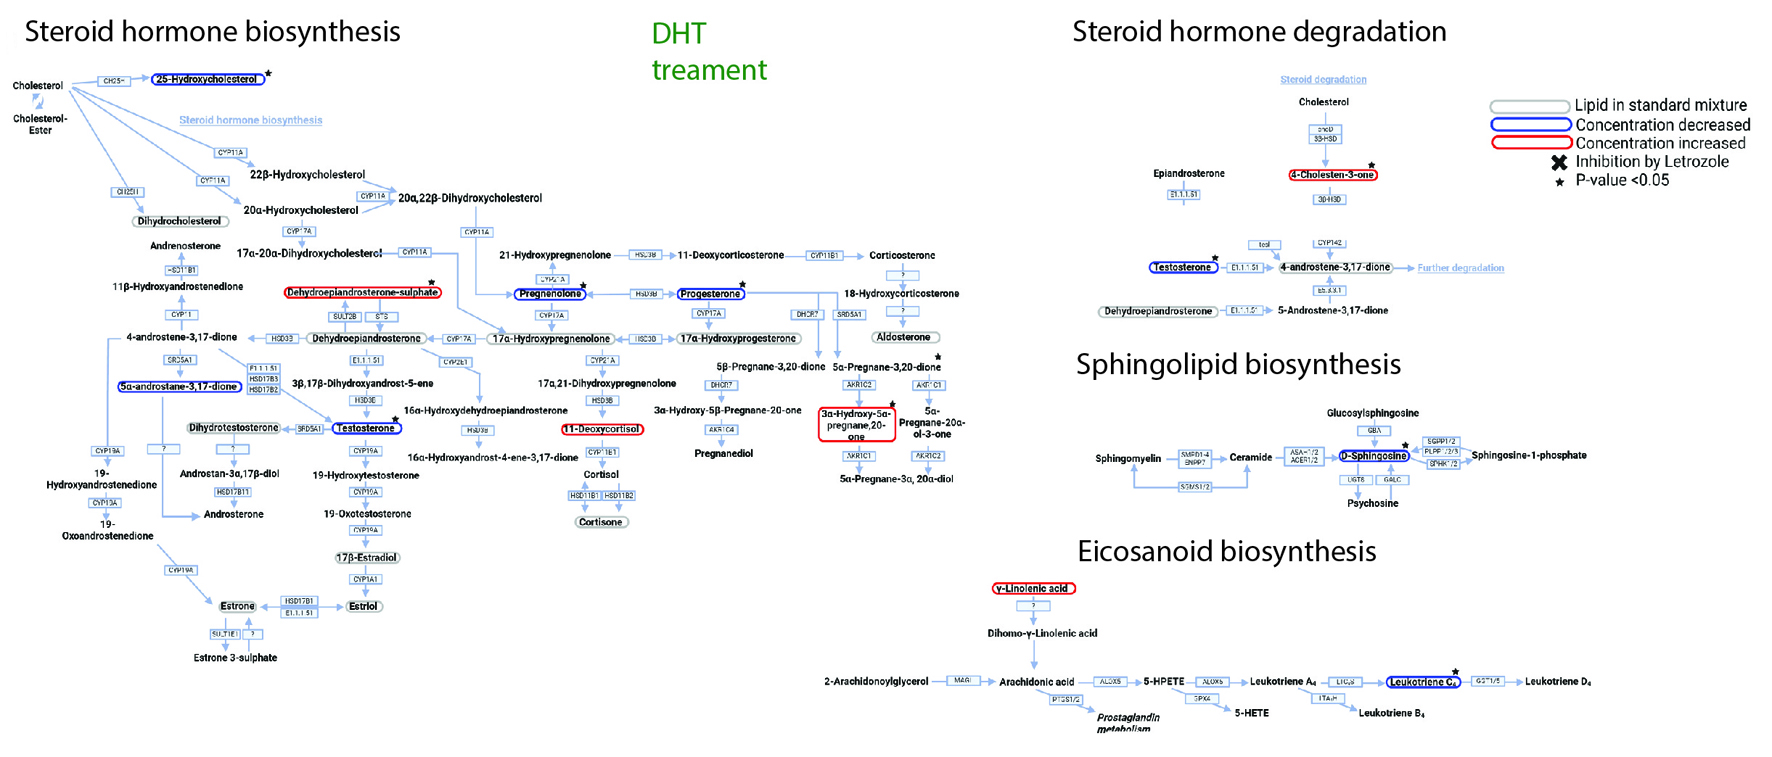
↓ Figure 5. Dihydrotestosterone (DHT) affects
metabolic networks. DHT treatment pathway analysis. Lipid profile after treatment with DHT. Converting
enzymes are in boxes and the lipids in this study are circled. Lipids circled in grey have either no
change compared to non-treated control rat plasma or was not detected with this methodology; lipids
circled in blue have a decreased concentration compared to non-treated control rats; and lipids circled
in red have an increased concentration compared to non-treated control rats. Lipids with a significant
difference between non-treated control and DHT treated (a P-value of less than 0.05) are indicated by a
black star.