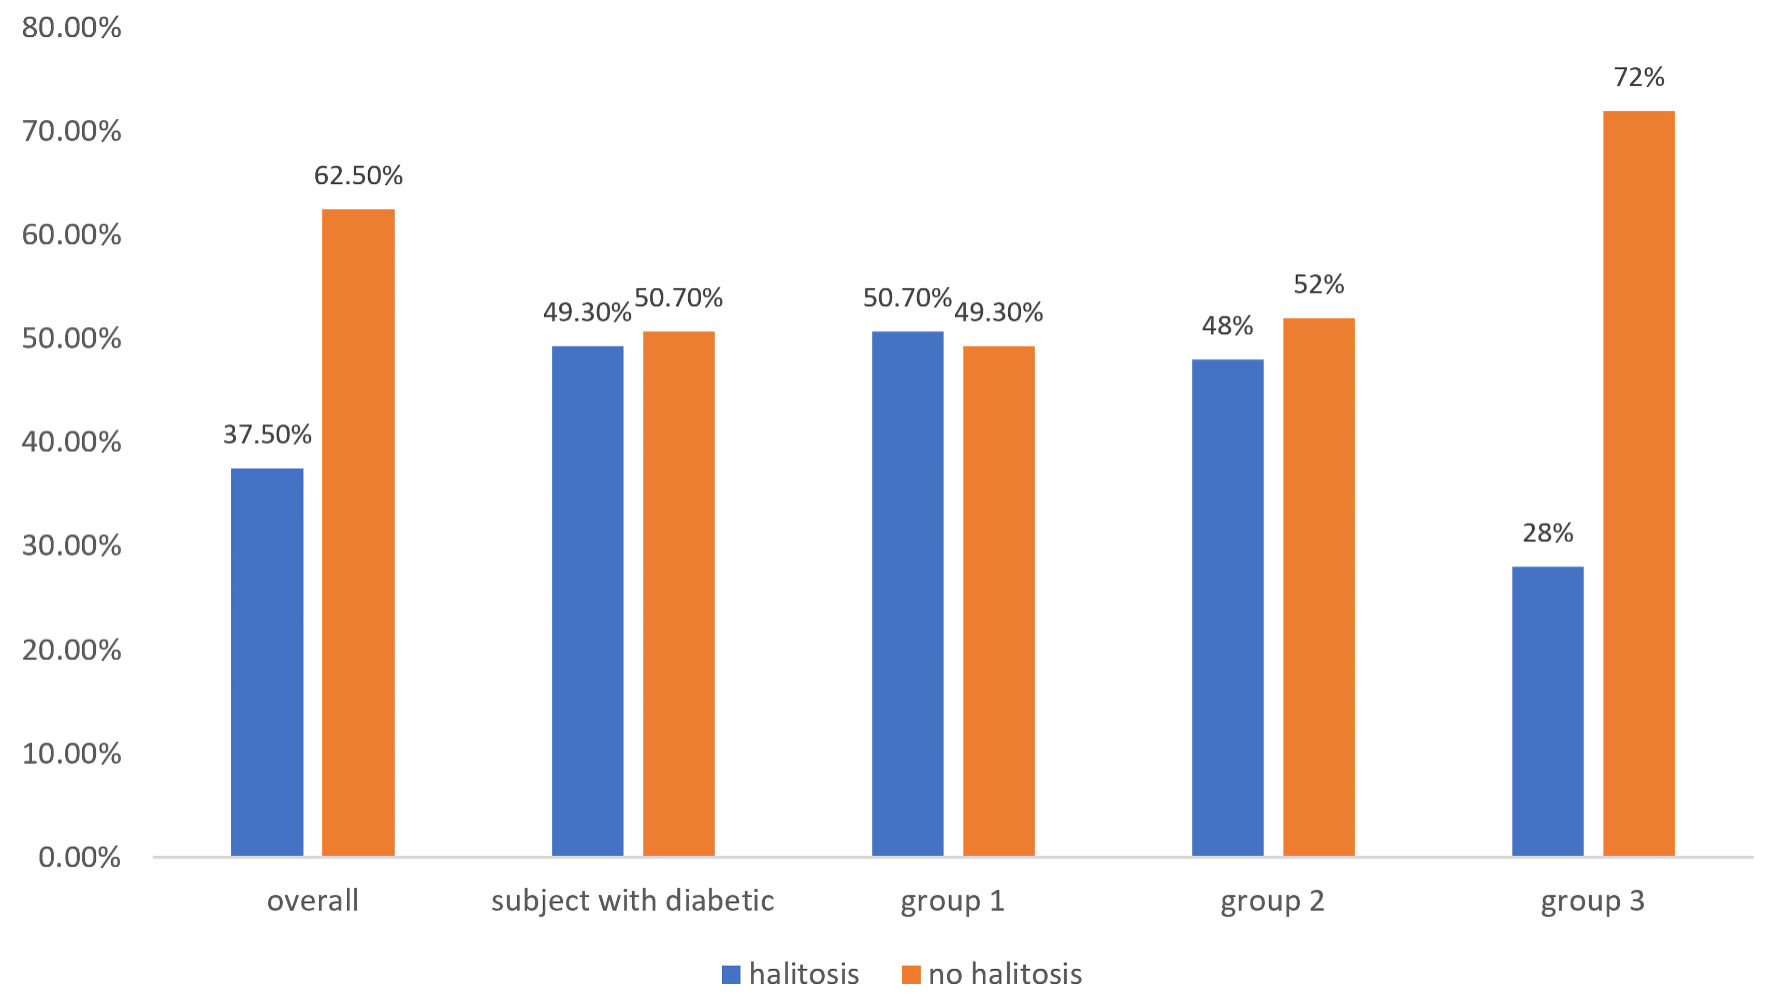
↓ Figure 1. Halitosis prevalence in type 1, type
2, and non-diabetic groups (group 1 = subjects with type 1 DM, group 2 = subjects with type 2 DM, group
3 = non-diabetic subjects). DM: diabetes mellitus.
| Journal of Endocrinology and Metabolism, ISSN 1923-2861 print, 1923-287X online, Open Access |
| Article copyright, the authors; Journal compilation copyright, J Endocrinol Metab and Elmer Press Inc |
| Journal website https://jem.elmerpub.com |
Original Article
Volume 15, Number 1, March 2025, pages 15-23
Prevalence of Self-Reported Halitosis in Individuals With Type 1 and Type 2 Diabetes Mellitus: A Cross-Sectional Study
Figures
Tables
| Group I (type 1 DM) | Group II (type 2 DM) | Group III (non-diabetic) | Total | P value | |
|---|---|---|---|---|---|
| N (%) | N (%) | N (%) | N | ||
| *Significant difference (P < 0.05). SD: standard deviation; DM: diabetes mellitus. | |||||
| Gender | |||||
| Male, n (%) | 61 (22.34%) | 80 (29.30%) | 132 (48.35%) | 273 | 0.004* |
| Female, n (%) | 77 (21.45%) | 64 (17.83%) | 218 (60.72%) | 359 | |
| Age | |||||
| Mean ± SD | 36.62 ± 14.77 | 51.45 ± 9.7 | 44.2 ± 12.5 | 0.000* | |
| Smoking | |||||
| Nonsmoker, n (%) | 121 (22.06%) | 119 (21.88%) | 305 (56.07%) | 544 | 0.003* |
| Electric cigarettes, n (%) | 9 (27.27%) | 4 (12.12%) | 20 (60.61%) | 33 | |
| Regular cigarettes, n (%) | 5 (10.87%) | 21 (45.65%) | 20 (43.48%) | 46 | |
| Both (electric and regular cigarettes), n (%) | 3 (37.50%) | 0 (0.00%) | 5 (62.50%) | 8 | |
| Group 1 (type 1 DM) | Group 2 II (type 2 DM) | Group 3 (non-diabetic) | Total | P value | |
|---|---|---|---|---|---|
| N (%) | N (%) | N (%) | N (%) | ||
| *Significant difference (P < 0.05). DM: diabetes mellitus. | |||||
| Low carbs, n (%) | 48 (34.78%) | 61 (42.36%) | 73 (20.86%) | 182 (28.8%) | |
| Keto diet, n (%) | 3 (2.17%) | 2 (1.39%) | 5 (1.43%) | 10 (1.58%) | 0.048* |
| Vegetarian, n (%) | 2 (1.45%) | 3 (2.08%) | 5 (1.43%) | 10 (1.58%) | |
| No diet, n (%) | 82 (59.42%) | 75 (52.08%) | 258 (73.71%) | 415 (65.66%) | |
| Multiple, n (%) | 3 (2.17%) | 3 (2.08%) | 9 (2.57%) | 15 (2.37%) | |
| Total | 138 | 144 | 350 | 632 | |
| Do you suffer from halitosis after being diagnosed with DM? | Type 1, n (%) | Type 2, n (%) | Total, n (%) |
|---|---|---|---|
| DM: diabetes mellitus. | |||
| Yes | 47 (49.5%) | 48 (50.5%) | 95 (100.0%) |
| No | 86 (48.0%) | 93 (52.0%) | 179 (100.0%) |
| Variable | HbA1c | Halitosis score |
|---|---|---|
| HbA1c: hemoglobin A1c; DM: diabetes mellitus. | ||
| Correlation coefficient | 1.00 | 0.027 |
| Significance (two-tailed) | - | 0.654 |
| N | 281 | 281 |
| Group | Pearson’s R (P value) | Spearman’s correlation (P value) | Valid cases, n |
|---|---|---|---|
| DM: diabetes mellitus. | |||
| Group I | 0.162 (0.056) | 0.097 (0.252) | 140 |
| Group II | 0.245 (0.003) | 0.187 (0.023) | 149 |