Figures
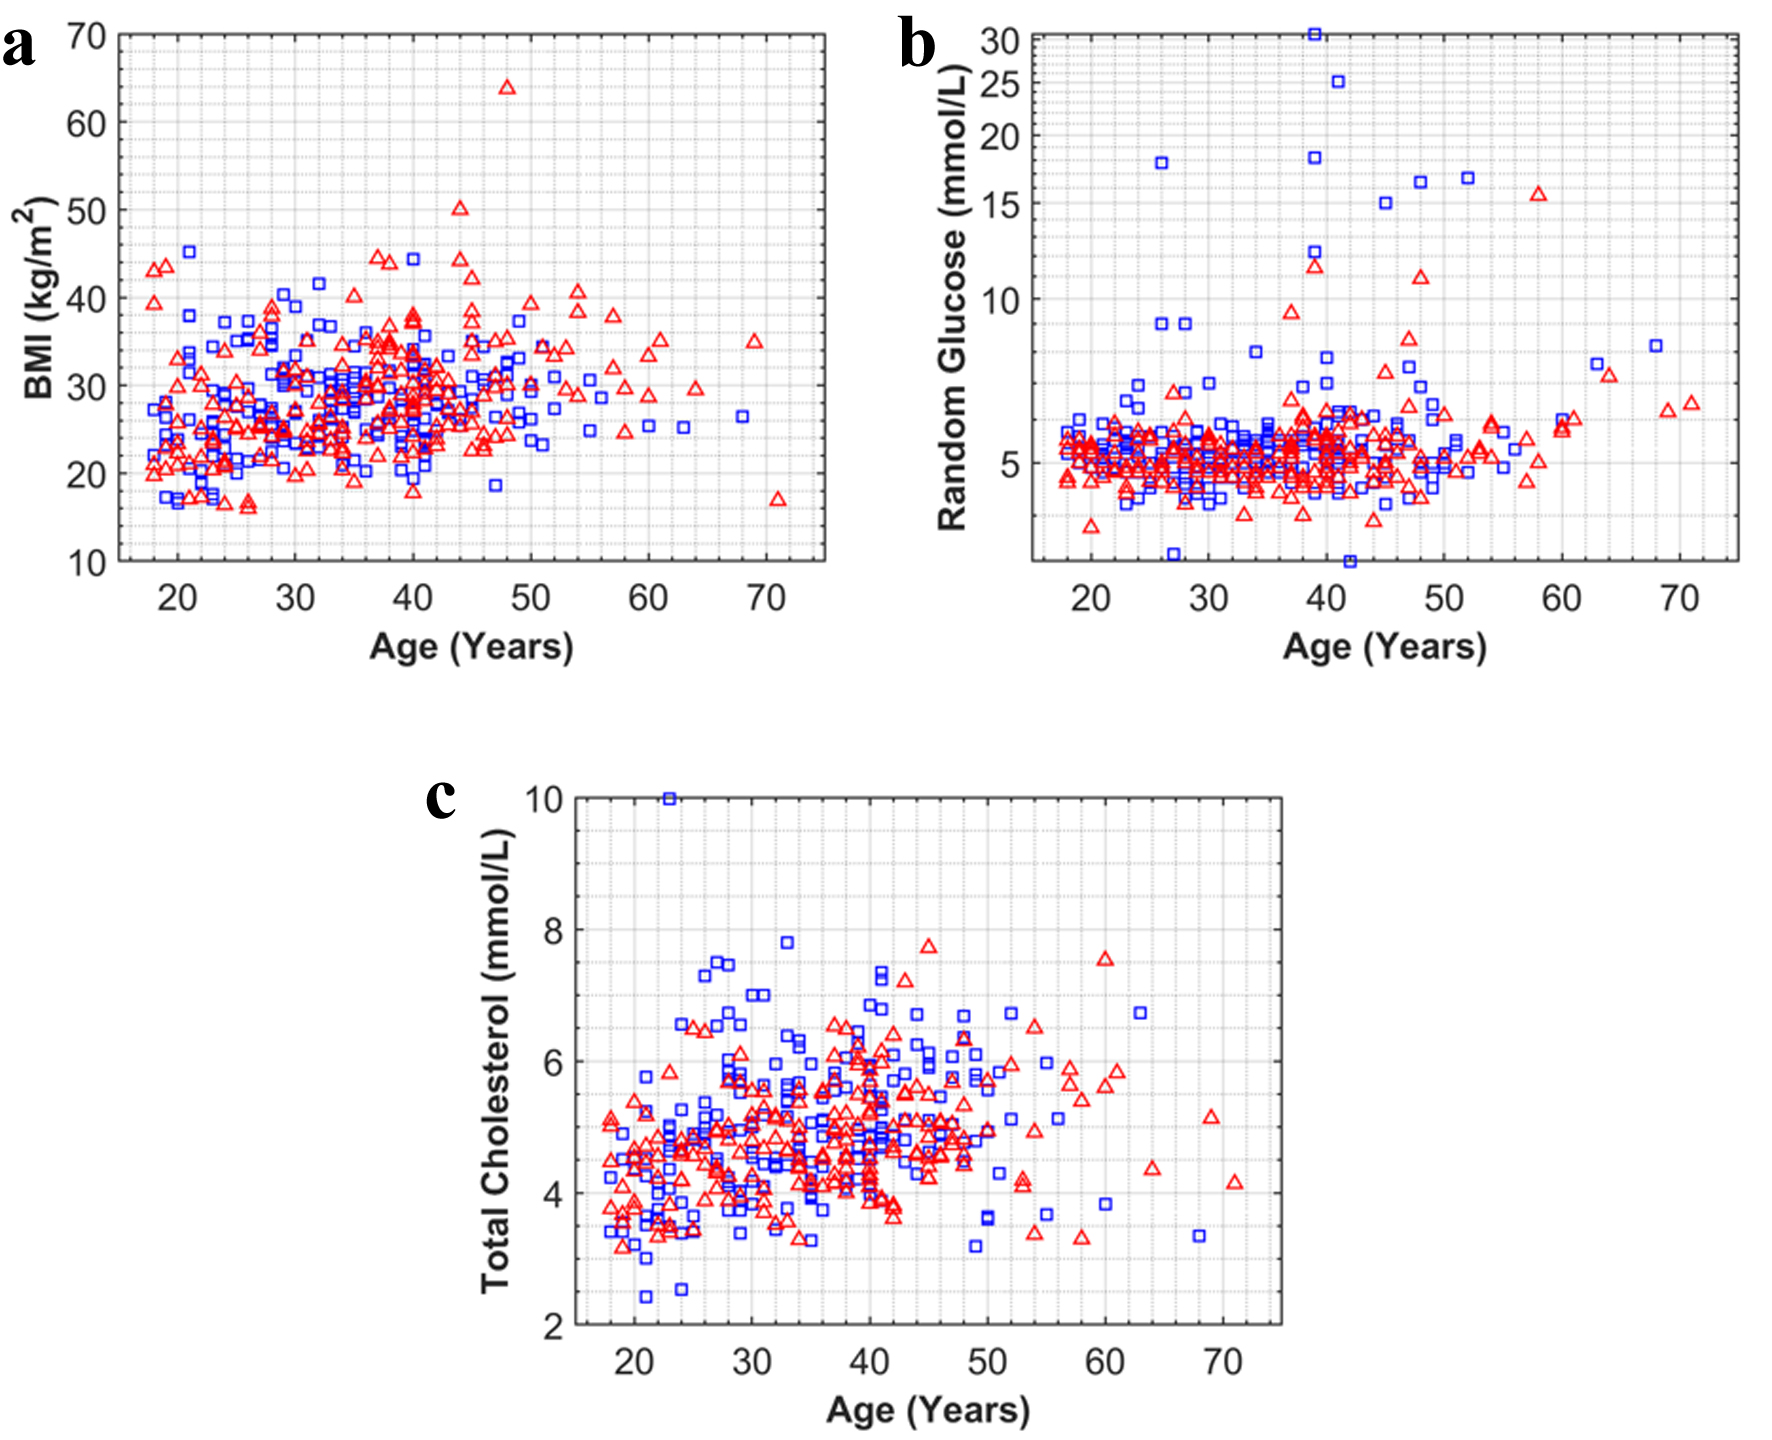
↓ Figure 1. Scatter plots of age (years) versus
(a) BMI (kg/m2), (b) random glucose (mmol/L), and (c) total cholesterol (mmol/L) by gender.
Males are represented by “□” and females by “Δ”. BMI: body mass
index.
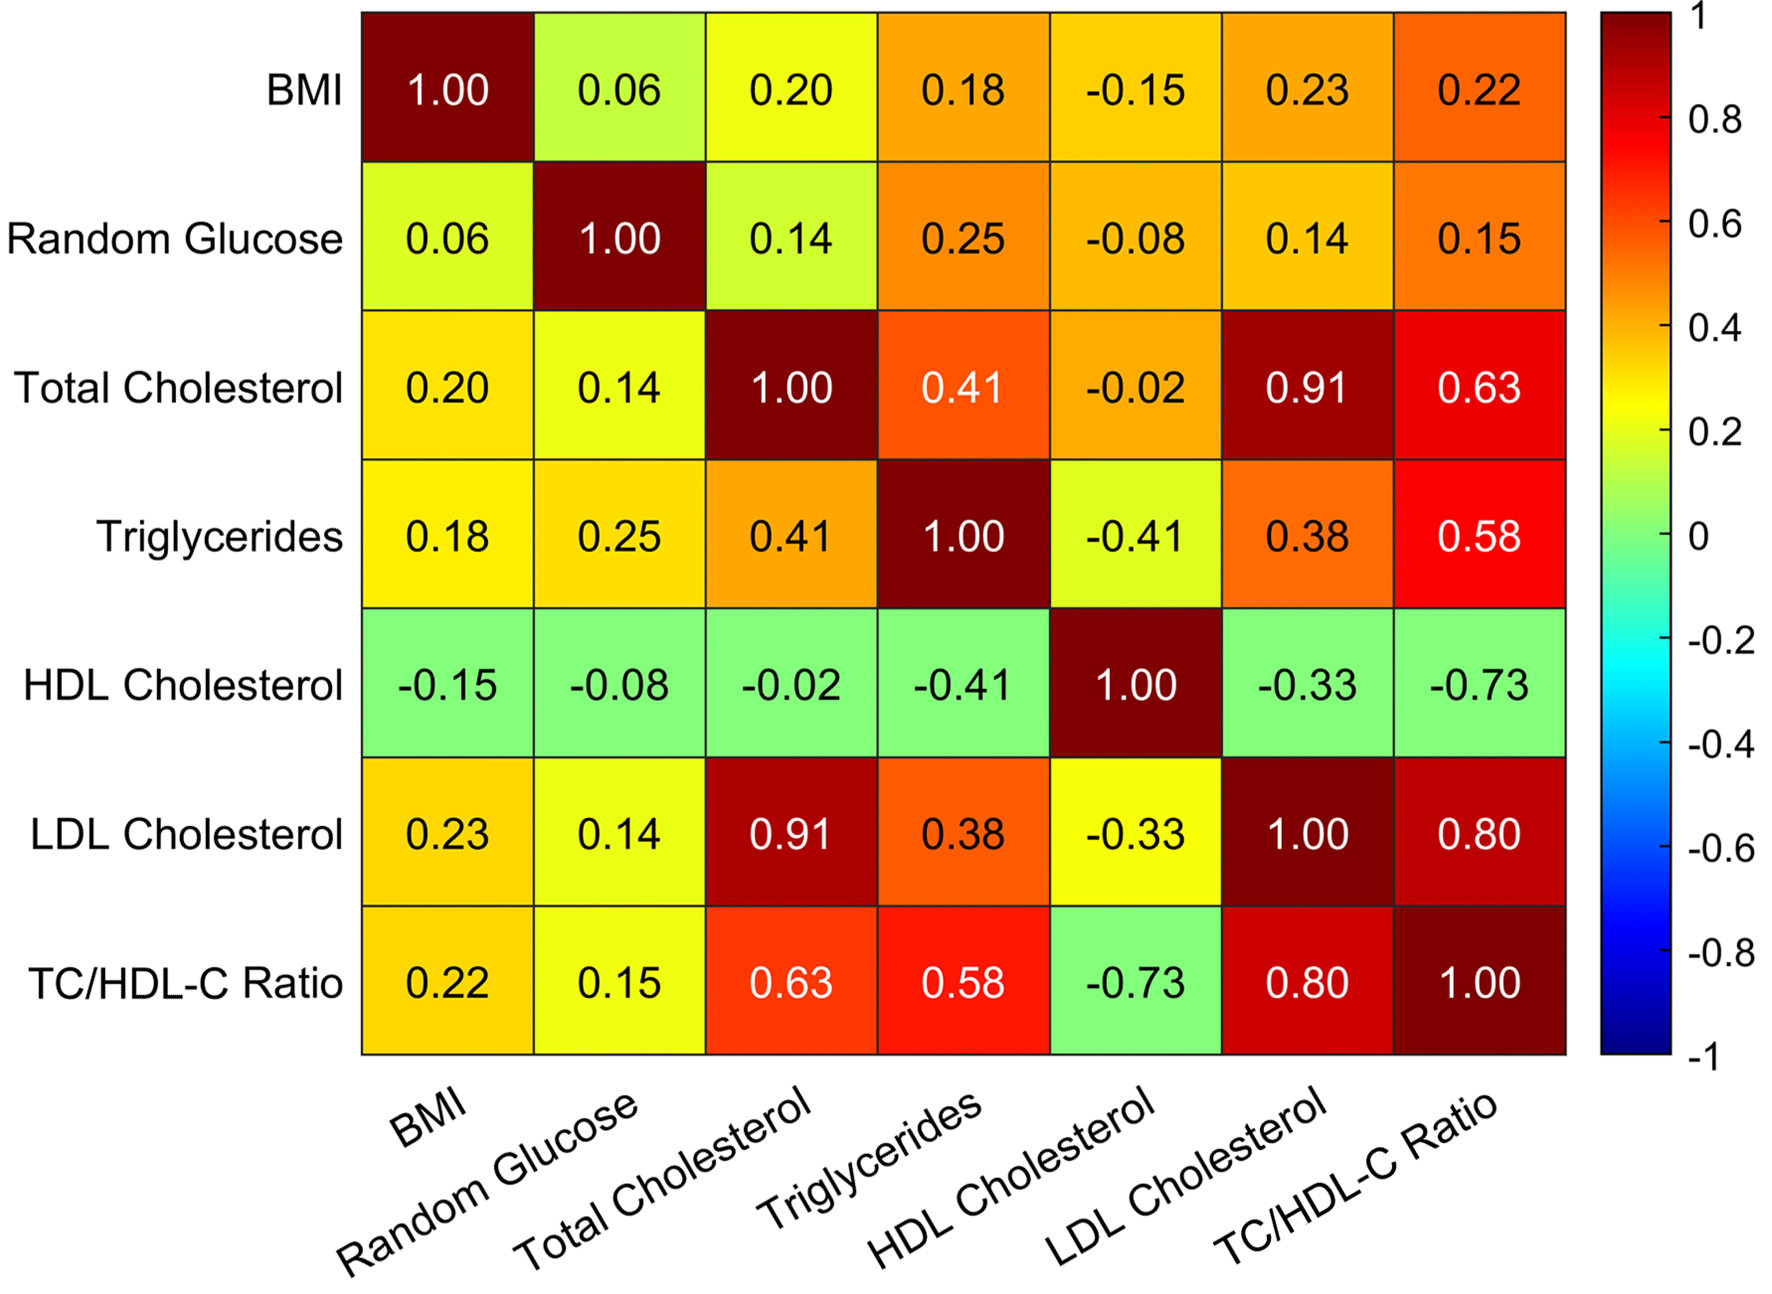
↓ Figure 2. Correlation heatmap illustrating the
relationships between key metabolic and lipid parameters (BMI, random blood glucose, TC, triglycerides,
HDL cholesterol, LDL cholesterol, and TC to HDL-C ratio), based on the combined data of all participants
(both sexes). BMI: body mass index; HDL: high-density lipoprotein; HDL-C: high-density lipoprotein
cholesterol; LDL: low-density lipoprotein; TC: total cholesterol.
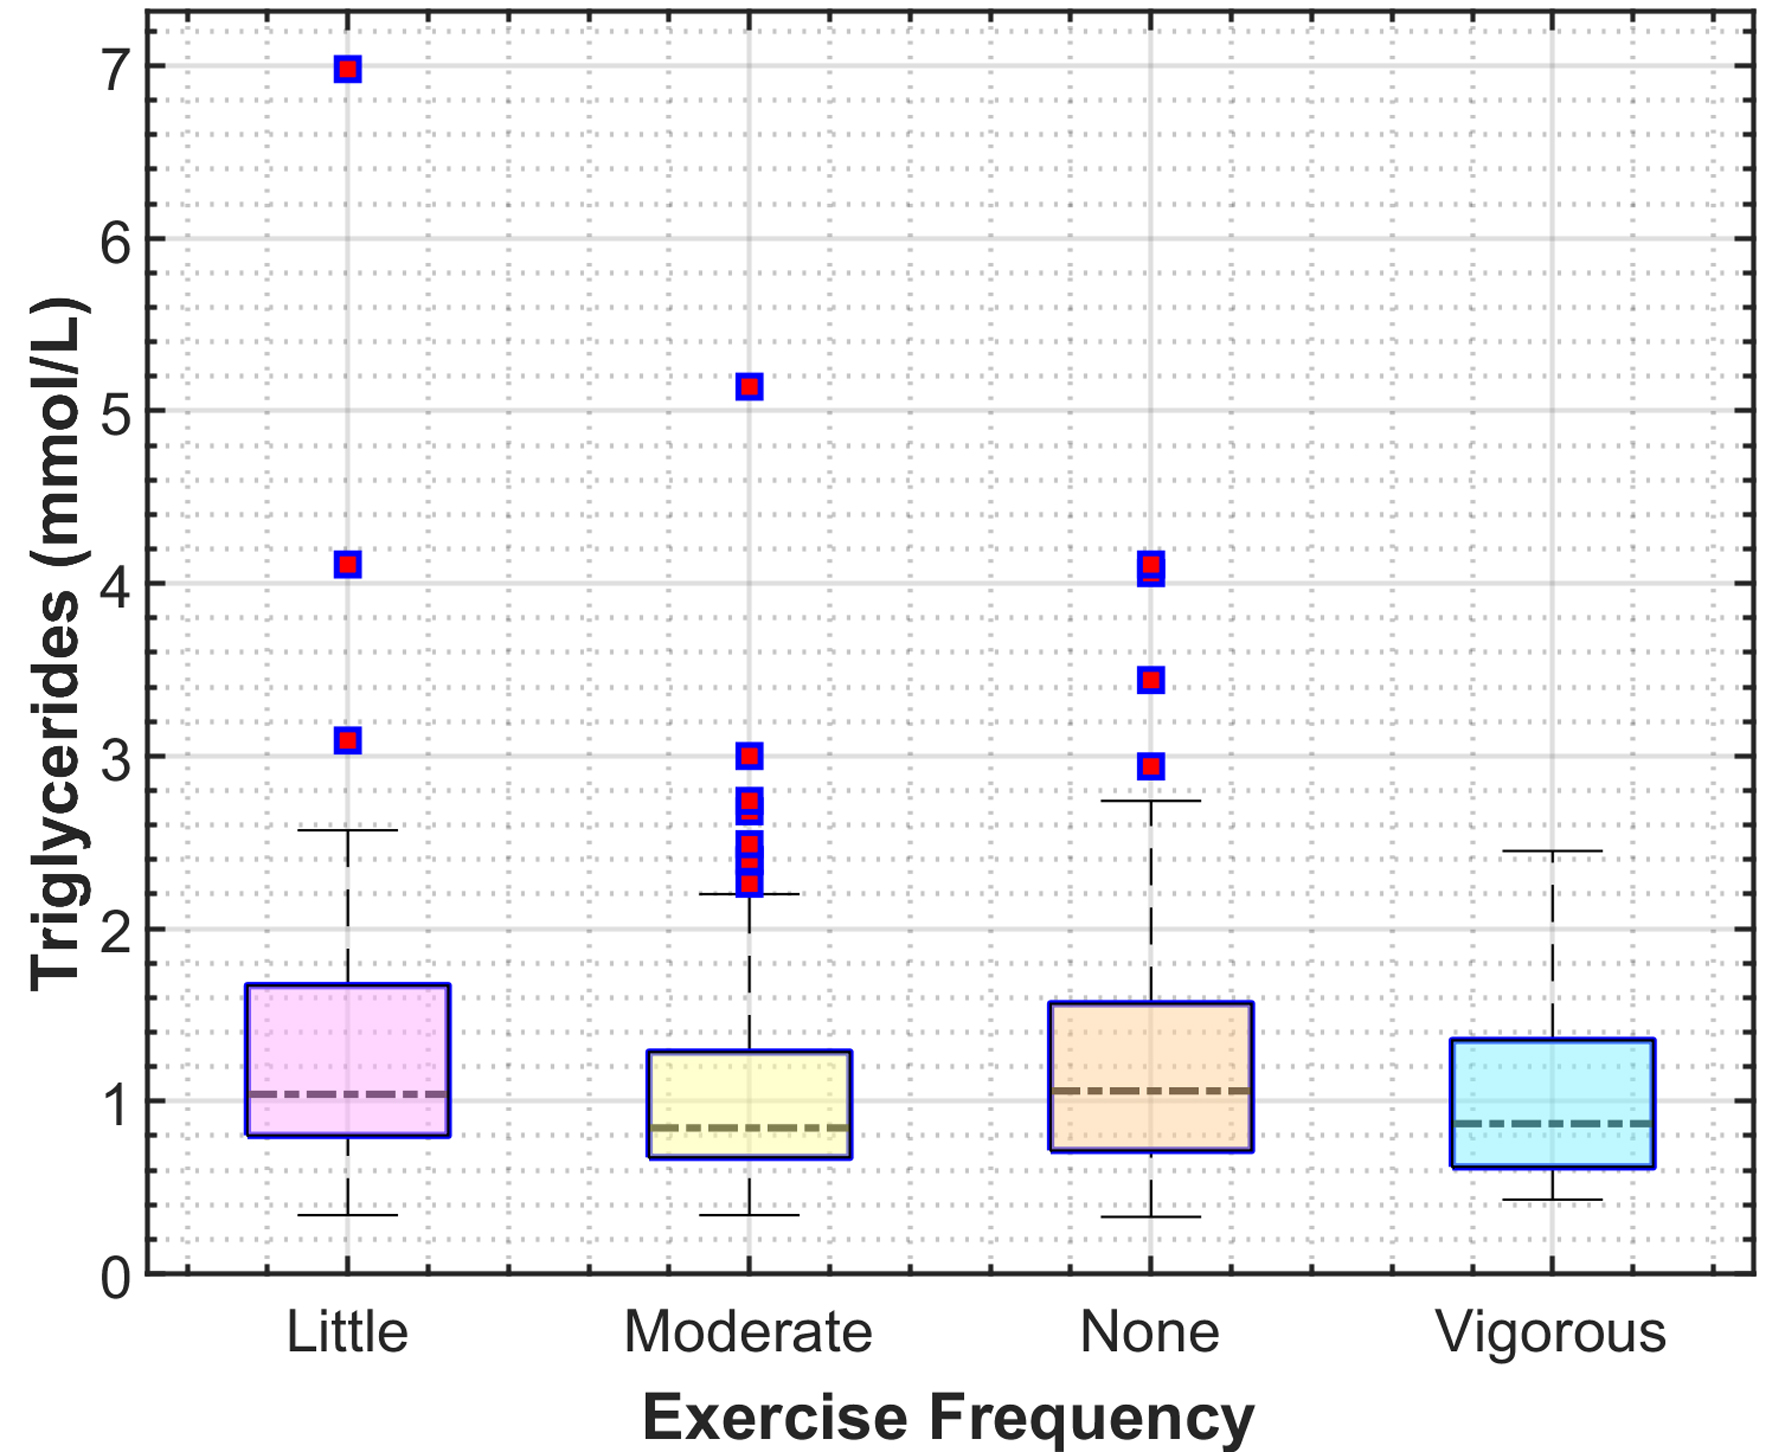
↓ Figure 3. Box plot showing the distribution of
triglyceride levels (mmol/L) across four categories of exercise frequency (none, little, moderate, and
vigorous), based on the combined data of all participants (both sexes).
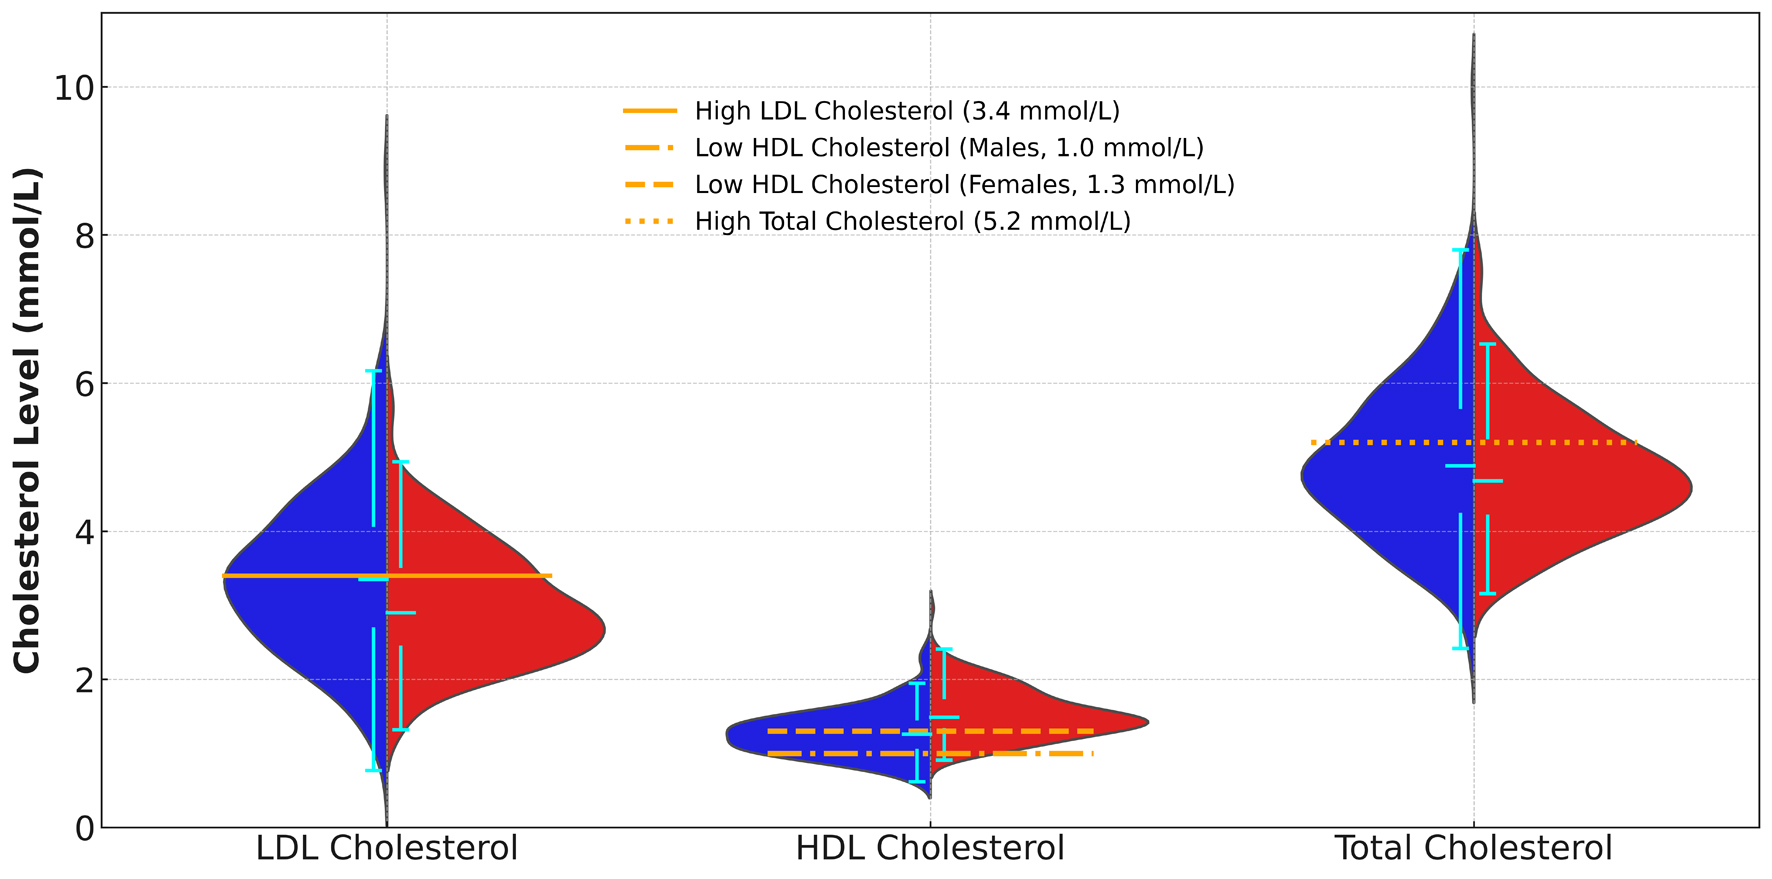
↓ Figure 4. Split violin plot comparing
cholesterol levels (LDL, HDL, and total) between male and female participants. Medical cut-off points
are indicated for LDL, HDL, and total cholesterol. Male and female data are color-coded using blue and
red, respectively. HDL: high-density lipoprotein; LDL: low-density lipoprotein.
Table
↓ Table 1. Frequency Distribution of Demographic, Clinical, and Lifestyle
Characteristics in Participants With Normal and Abnormal Lipid Profiles
|
|
Total |
Normal lipid profile |
Abnormal lipid profile |
P
value |
| “Total” percentages are based on the sample size (N = 398). Lipid profile
percentages are calculated within each row category. BMI: body mass index; SD: standard deviation.
|
| Gender |
|
|
|
|
| Female |
186 (46.7%) |
86 (46.2%) |
100 (53.8%) |
< 0.001 |
| Male |
212 (53.3%) |
49 (23.1%) |
163 (76.9%) |
|
| Age, mean (SD), years |
35 (10) |
32 (10) |
37 (10) |
|
| Age group |
|
|
|
|
| 18 - 29 years |
129 (32.4%) |
61 (45.2%) |
68 (25.9%) |
< 0.001 |
| 30 - 39 years |
126 (31.7%) |
41 (30.4%) |
85 (32.3%) |
|
| 40 - 49 years |
111 (27.9%) |
29 (21.5%) |
82 (31.2%) |
|
| ≥ 50 years |
32 (8.0%) |
4 (3.0%) |
28 (10.6%) |
|
| Education level |
|
|
|
|
| Secondary education |
276 (69.3%) |
89 (65.9%) |
187 (71.1%) |
0.429 |
| Tertiary education |
102 (25.6%) |
37 (27.4%) |
65 (24.7%) |
|
| Below secondary education |
20 (5.0%) |
9 (6.7%) |
11 (4.2%) |
|
| Employment status |
|
|
|
|
| Yes |
262 (65.8%) |
82 (60.7%) |
180 (68.4%) |
0.125 |
| No |
136 (34.2%) |
53 (39.3%) |
83 (31.6%) |
|
| BMI, mean (SD), kg/m2 |
28.3 (6.0) |
26.3 (5.8) |
29.4 (5.8) |
|
| Weight status |
|
|
|
|
| Underweight (< 18.5 kg/m2) |
17 (4.3%) |
11 (8.1%) |
6 (2.3%) |
< 0.001 |
| Normal weight (18.5 - 24.9 kg/m2) |
102 (25.6%) |
46 (34.1%) |
56 (21.3%) |
|
| Overweight (25 - 29.9 kg/m2) |
138 (34.7%) |
46 (34.1%) |
92 (35.0%) |
|
| Obesity (≥ 30 kg/m2) |
141 (35.4%) |
32 (23.7%) |
109 (41.4%) |
|
| Physical activity |
|
|
|
|
| None |
212 (53.3%) |
70 (51.9%) |
142 (54.0%) |
0.210 |
| Little |
51 (12.8%) |
12 (8.9%) |
39 (14.8%) |
|
| Moderate |
96 (24.1%) |
39 (28.9%) |
57 (21.7%) |
|
| Vigorous |
39 (9.8%) |
14 (10.4%) |
25 (9.5%) |
|
| Smoking |
|
|
|
|
| No |
316 (79.4%) |
120 (88.9%) |
196 (74.5%) |
< 0.001 |
| Yes |
82 (20.6%) |
15 (11.1%) |
67 (25.5%) |
|
| Hypertension |
|
|
|
|
| No |
380 (95.5%) |
132 (97.8%) |
248 (94.3%) |
0.114 |
| Yes |
18 (4.5%) |
3 (2.2%) |
15 (5.7%) |
|
| Diabetes |
|
|
|
|
| No |
372 (93.5%) |
130 (96.3%) |
242 (92.0%) |
0.102 |
| Yes |
26 (6.5%) |
5 (3.7%) |
21 (8.0%) |
|
| Cardiovascular diseases |
|
|
|
|
| No |
393 (98.7%) |
133 (98.5%) |
260 (98.9%) |
0.773 |
| Yes |
5 (1.3%) |
2 (1.5%) |
3 (1.1%) |
|
| Family history of hypertension |
|
|
|
|
| No |
218 (54.8%) |
80 (59.3%) |
138 (52.5%) |
0.198 |
| Yes |
180 (45.2%) |
55 (40.7%) |
125 (47.5%) |
|
| Family history of diabetes |
|
|
|
|
| No |
196 (49.2%) |
65 (48.1%) |
131 (49.8%) |
0.754 |
| Yes |
202 (50.8%) |
70 (51.9%) |
132 (50.2%) |
|
| Family history of cardiovascular diseases |
|
|
|
|
| No |
358 (89.9%) |
126 (93.3%) |
232 (88.2%) |
0.108 |
| Yes |
40 (10.1%) |
9 (6.7%) |
31 (11.8%) |
|