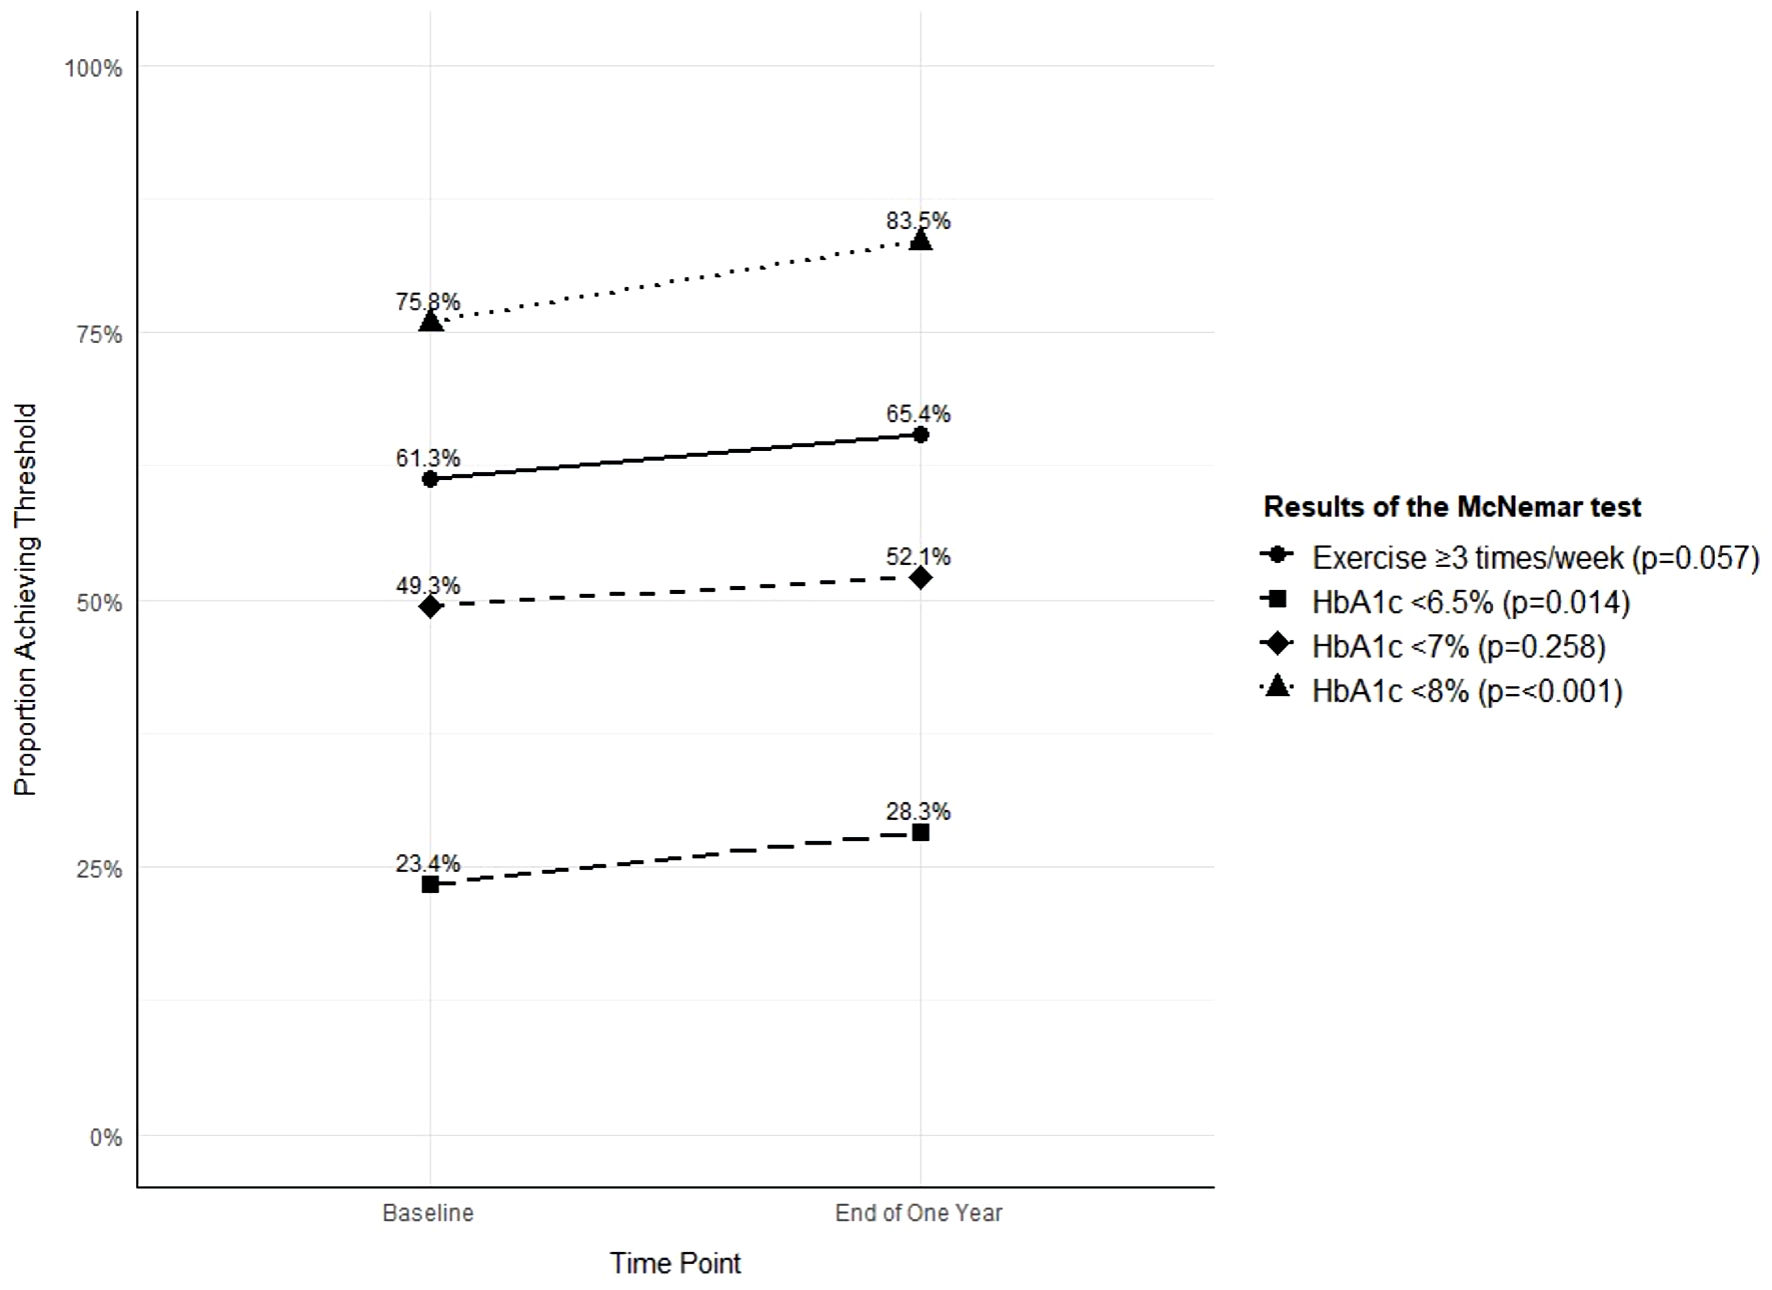
↓ Figure 1. Comparison of health threshold
achievement before and after DSCP. DSCP: the Diabetes Shared Care Program; HbA1c: glycated
hemoglobin.
| Journal of Endocrinology and Metabolism, ISSN 1923-2861 print, 1923-287X online, Open Access |
| Article copyright, the authors; Journal compilation copyright, J Endocrinol Metab and Elmer Press Inc |
| Journal website https://jem.elmerpub.com |
Original Article
Volume 15, Number 3, August 2025, pages 81-90
Impact of the Diabetes Shared Care Program on Glycemic Control in Older Adults With Type 2 Diabetes
Figure
Tables
| N | % | |
|---|---|---|
| Gender | ||
| Male | 233 | 45.8 |
| Female | 276 | 54.2 |
| Age | 73.54 ± 6.93 | |
| Educational level | ||
| Illiteracy | 85 | 16.7 |
| ≤ 6 years | 202 | 39.7 |
| 7 - 12 years | 157 | 30.8 |
| ≥ 13 years | 65 | 12.8 |
| Alcohol consumption | ||
| None or abstained | 467 | 91.7 |
| Current users | 42 | 8.3 |
| Cigarette smoking | ||
| None or abstained | 459 | 90.4 |
| Current users | 49 | 9.6 |
| Exercising (baseline) | ||
| < 3 times/week | 197 | 38.7 |
| ≥ 3 times/week | 312 | 61.3 |
| Exercising (end of 1 year) | ||
| < 3 times/week | 176 | 34.6 |
| ≥ 3 times/week | 333 | 65.4 |
| BMI value | ||
| < 24 kg/m2 | 174 | 34.2 |
| ≥ 24 kg/m2 | 335 | 65.8 |
| Waist circumferences | ||
| Normal | 144 | 28.3 |
| Abnormal | 365 | 71.7 |
| Medication as prescribed | ||
| Yes | 495 | 97.2 |
| No | 14 | 2.8 |
| Timing adherence to medication | ||
| Yes | 474 | 93.1 |
| No | 35 | 6.9 |
| A1C level (baseline) | 7.37 ± 1.30 | |
| A1C level (end of 1 year) | 7.11 ± 1.13 | |
| Total | 509 | 100 |
| A1C level at the end of 1 year | |||||||||
|---|---|---|---|---|---|---|---|---|---|
| < 8%, n (%) | ≥ 8%, n (%) | P | < 7%, n (%) | ≥ 7%, n (%) | P | < 6.5%, n (%) | ≥ 6.5%, n (%) | P | |
| BMI: body mass index. | |||||||||
| Gender | 0.232 | 0.178 | 0.029 | ||||||
| Male | 191 (82.0) | 42 (18.0) | 127 (54.5) | 106 (45.5) | 76 (32.6) | 157 (67.4) | |||
| Female | 234 (84.8) | 42 (15.2) | 138 (50.0) | 138 (50.0) | 68 (24.6) | 208 (75.4) | |||
| Education level | 0.910 | 0.032 | 0.001 | ||||||
| Illiteracy | 71 (83.5) | 14 (16.5) | 38 (44.7) | 47 (55.3) | 19 (22.4) | 66 (77.6) | |||
| ≤ 6 years | 169 (83.7) | 33 (16.3) | 95 (47.0) | 107 (53.0) | 43 (21.3) | 159 (78.7) | |||
| 7 - 12 years | 129 (82.2) | 28 (17.8) | 93 (59.2) | 64 (40.8) | 54 (34.4) | 103 (65.6) | |||
| ≥ 13 years | 56 (86.2) | 9 (13.8) | 39 (60.0) | 26 (40.0) | 28 (43.1) | 37 (56.9) | |||
| Alcohol consumption | 0.276 | 0.002 | 0.052 | ||||||
| None or abstained | 388 (83.1) | 79 (16.9) | 234 (50.1) | 233 (49.9) | 127 (27.2) | 340 (72.8) | |||
| Current users | 37 (88.1) | 5 (11.9) | 31 (73.8) | 11 (26.2) | 17 (40.5) | 25 (59.5) | |||
| Cigarette smoking | 0.087 | 0.275 | 0.540 | ||||||
| None or abstained | 338 (84.3) | 72 (15.7) | 237 (51.5) | 223 (48.5) | 130 (28.3) | 330 (71.7) | |||
| Current users | 37 (75.5) | 12 (24.5) | 28 (57.1) | 21 (42.9) | 14 (28.6) | 35 (71.4) | |||
| BMI | 0.033 | 0.003 | < 0.001 | ||||||
| < 24 kg/m2 | 153 (87.9) | 21 (12.1) | 106 (60.9) | 68 (39.1) | 68 (39.1) | 106 (60.9) | |||
| ≥ 24 kg/m2 | 272 (81.2) | 63 (18.8) | 159 (47.5) | 176 (52.5) | 76 (22.7) | 259 (77.3) | |||
| Waist circumferences | 0.006 | < 0.001 | < 0.001 | ||||||
| Normal | 130 (90.3) | 14 (9.7) | 103 (71.5) | 41 (28.5) | 67 (46.5) | 77 (53.5) | |||
| Abnormal | 295 (80.8) | 70 (19.2) | 162 (44.4) | 203 (55.6) | 77 (21.1) | 288 (78.9) | |||
| Exercise (end of 1 year) | 0.002 | 0.092 | 0.026 | ||||||
| < 3 times/week | 135 (76.7) | 41 (23.3) | 84 (47.7) | 92 (52.3) | 40 (22.7) | 136 (77.3) | |||
| ≥ 3 times/week | 290 (87.1) | 43 (12.9) | 181 (54.4) | 152 (45.6) | 104 (31.2) | 229 (68.8) | |||
| Medication as prescribed | 0.414 | 0.334 | 0.593 | ||||||
| Yes | 414 (83.6) | 81 (16.4) | 259 (52.3) | 236 (47.7) | 140 (28.3) | 355 (71.7) | |||
| No | 11 (78.6) | 3 (21.4) | 6 (42.9) | 8 (57.1) | 4 (28.6) | 10 (71.4) | |||
| Timing adherence to medication | 0.203 | 0.273 | 0.552 | ||||||
| Yes | 398 (84.0) | 76 (16.0) | 249 (52.5) | 225 (47.5) | 134 (28.3) | 340 (71.7) | |||
| No | 27 (77.1) | 8 (22.9) | 16 (45.7) | 19 (54.3) | 10 (28.6) | 25 (71.4) | |||
| Variables | A1C < 8% | P value | A1C < 7% | P value | A1C < 6.5% | P value |
|---|---|---|---|---|---|---|
| ORs (95% CI) | ORs (95% CI) | ORs (95% CI) | ||||
| OR: odds ratio; CI: confidence interval; BMI: body mass index. | ||||||
| Gender | ||||||
| Male | - | Reference | ||||
| Female | - | 0.943 (0.547 - 1.623) | 0.831 | |||
| Education level | ||||||
| Illiteracy | 1.208 (0.555 - 2.630) | 0.634 | 1.722 (0.695 - 4.263) | 0.374 | ||
| ≤ 6 years | 1.190 (0.607 - 2.334) | 0.612 | 2.145 (1.025 - 4.492) | 0.114 | ||
| 7 - 12 years | 0.888 (0.442 - 1.784) | 0.739 | 1.271 (0.618 - 2.616) | 0.852 | ||
| ≥ 13 years | Reference | Reference | ||||
| BMI | 0.843 | 0.743 | ||||
| < 24 kg/m2 | Reference | Reference | Reference | |||
| ≥ 24 kg/m2 | 0.954 (0.599 - 1.520) | 1.088 (0.656 - 1.806) | 1.240 (0.705 - 2.179) | 0.455 | ||
| Waist circumference | ||||||
| Normal | Reference | Reference | Reference | |||
| Abnormal | 3.619 (1.909 - 5.261) | < 0.001 | 2.360 (1.362 - 4.087) | 0.002 | 2.570 (1.409 - 4.690) | 0.002 |
| Alcohol consumption | ||||||
| None or abstained | - | Reference | ||||
| Current users | - | 0.632 (0.281 - 1.419) | 0.266 | |||
| Exercise | ||||||
| < 3 times/week | 1.107 (0.742 - 1.653) | 0.049 | - | 1.324 (0.795 - 2.205) | 0.281 | |
| ≥ 3 times/week | Reference | - | Reference | |||
| A1C level (baseline) | ||||||
| Normal | Reference | Reference | Reference | |||
| Abnormal | 5.620 (3.447 - 9.161) | < 0.001 | 8.150 (5.378 - 12.351) | < 0.001 | 11.836 (7.718 - 19.517) | < 0.001 |
| Model fit | R2 = 0.341 | R2 = 0.348 | R2 = 0.373 | |||