Journal of Endocrinology and Metabolism, ISSN 1923-2861 print, 1923-287X online, Open Access
Article copyright, the authors; Journal compilation copyright, J Endocrinol Metab and Elmer Press Inc
Journal website https://jem.elmerpub.com

Original Article

Volume 15, Number 4, October 2025, pages 130-136


Effect of Imeglimin on Microalbuminuria and Serum Vitamin B12 Concentration in Japanese Patients With Type 2 Diabetes

Figure

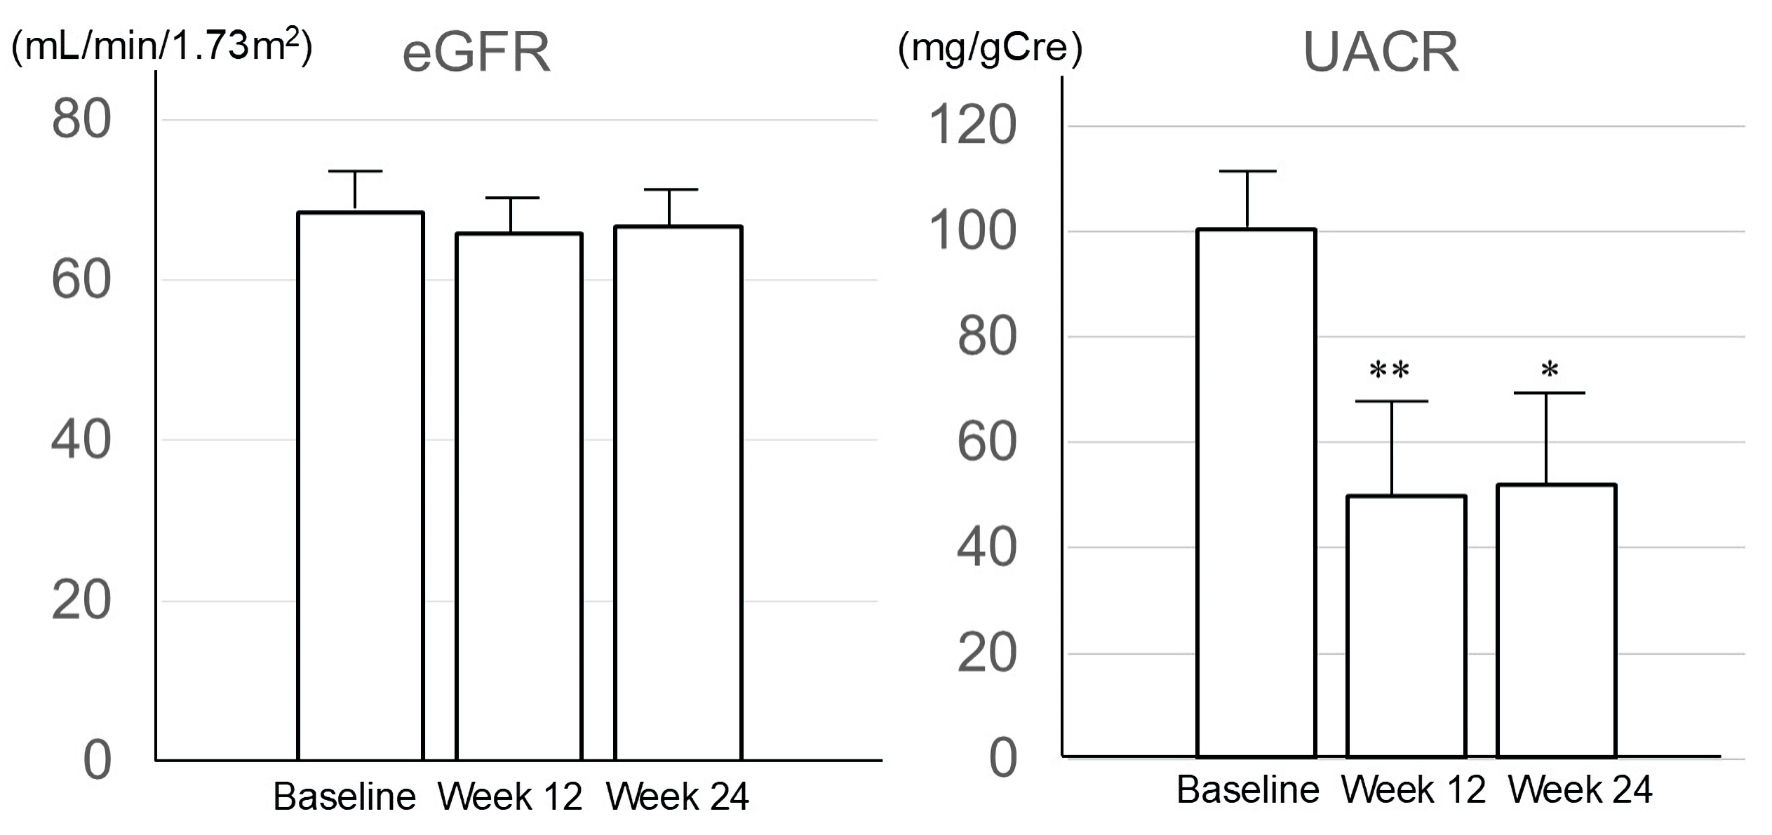
↓  Figure 1. Changes of estimated glomerular filtration rate and urinary albumin creatinine ratio. Data are expressed as mean ± SE. *P < 0.05, **P < 0.01 vs. baseline. eGFR: estimated glomerular filtration rate; UACR: urinary albumin-to-creatinine ratio.
Figure 1.

Tables

↓  Table 1. Baseline Characteristics of Enrolled Patients
 
Baseline characteristics N = 21 (14 men/7 women)
Data are expressed as mean ± SE. SE: standard error; BW: body weight; BMI: body mass index; FPG: fasting plasma glucose; HbA1c: glycated hemoglobin; DPP-4: dipeptidyl peptidase-4; α-GI: α-glucosidase inhibitor; SGLT2: sodium-glucose cotransporter 2; GLP-1: glucagon-like peptide-1.
Variables
  Age (years) 65.20 ± 2.43
  BW (kg) 68.82 ± 1.17
  BMI (kg/m2) 25.81 ± 0.70
  FPG (mg/dL) 163.05 ± 7.13
  HbA1c (%) 8.08 ± 0.12
Medication of anti-diabetic agents usage
  No medication, n (%) 3 (14.3)
  Insulin, n (%) 1 (4.7)
  Metformin, n (%) 8 (38.0)
  Sulfonylurea, n (%) 6 (28.6)
  DPP-4 inhibitor, n (%) 17 (81.0)
  Glinide, n (%) 3 (14.3)
  α-GI, n (%) 3 (14.3)
  SGLT2 inhibitor, n (%) 8 (38.0)
  GLP-1 receptor agonist (oral), n (%) 1 (4.7)
  GLP-1 receptor agonist (injection), n (%) 0 (0.0)


↓  Table 2. Changes in Metabolic Parameters
 
Baseline Week 12 P vs. baseline Week 24 P vs. baseline
Data are expressed as mean ± SE. SE: standard error; BW: body weight; BMI: body mass index; FI: fat index; SMI: skeletal muscle index; SBP: systolic blood pressure; DBP: diastolic blood pressure; FPG: fasting plasma glucose; HbA1c: glycated hemoglobin; LDL: low-density lipoprotein; HDL: high-density lipoprotein; AST: aspartate aminotransferase; ALT: alanine aminotransferase; γ-GTP: γ-glutamyltransferase.
BW (kg) 69.02 ± 2.11 68.69 ± 2.05 0.481 68.74 ± 2.00 0.587
BMI (kg/m2) 25.81 ± 0.70 25.67 ± 0.66 0.408 25.70 ± 0.66 0.563
FI (kg/m2) 7.78 ± 0.76 7.56 ± 0.71 0.145 7.81 ± 0.73 0.960
SMI (kg/m2) 7.90 ± 0.17 8.00 ± 0.19 0.240 7.83 ± 0.19 0.272
SBP (mm Hg) 134.76 ± 2.53 135.19 ± 2.90 0.975 134.00 ± 2.69 0.925
DBP (mm Hg) 77.48 ± 2.53 76.71 ± 2.49 0.743 75.71 ± 2.59 0.242
FPG (mg/dL) 163.05 ± 7.13 146.10 ± 6.06 < 0.001 135.09 ± 5.71 < 0.001
HbA1c (%) 8.08 ± 0.12 7.25 ± 0.12 < 0.001 7.11 ± 0.15 < 0.001
LDL-cholesterol (mg/dL) 117.91 ± 5.84 116.95 ± 6.67 0.939 116.67 ± 5.18 0.901
HDL-cholesterol (mg/dL) 53.67 ± 2.59 51.95 ± 2.71 0.445 56.24 ± 2.96 0.185
Triglycerides (mg/dL) 153.43 ± 14.05 157.95 ± 17.71 0.855 126.00 ± 13.39 0.048
AST (IU/L) 24.29 ± 1.77 21.71 ± 1.40 0.084 22.09 ± 1.25 0.155
ALT (IU/L) 29.05 ± 3.32 24.48 ± 2.77 0.004 23.95 ± 2.47 0.001
γ-GTP (IU/L) 42.90 ± 7.79 36.19 ± 6.17 0.107 37.10 ± 6.70 0.177


↓  Table 3. Effect of Imeglimin on RBC Parameters and Serum VB12
 
Baseline Week 12 P vs. baseline Week 24 P vs. baseline
Data are expressed as mean ± SE. SE: standard error; RBC: red blood cell; Hb: hemoglobin; MCV: mean corpuscular volume; VB: vitamin B.
RBC (106/mm3)
  Total 498.86 ± 11.08 476.52 ± 10.35 < 0.001 477.86 ± 10.81 < 0.001
    With metformin 524.13 ± 21.45 503.13 ± 20.45 0.028 497.25 ± 20.79 0.006
    Without metformin 483.31 ± 10.61 460.15 ± 8.93 0.010 465.92 ± 11.32 0.056
Hb (g/dL)
  Total 14.60 ± 0.30 13.98 ± 0.28 < 0.001 14.25 ± 0.32 0.042
    With metformin 15.15 ± 0.58 14.54 ± 0.57 0.006 14.60 ± 0.62 0.013
    Without metformin 14.27 ± 0.31 13.64 ± 0.25 0.014 14.04 ± 0.36 0.465
MCV (fL)
  Total 89.57 ± 0.84 90.79 ± 0.77 < 0.001 92.49 ± 0.70 < 0.001
    With metformin 88.68 ± 1.59 89.41 ± 1.46 0.248 91.01 ± 1.19 < 0.001
    Without metformin 90.12 ± 0.97 91.63 ± 0.81 < 0.001 93.39 ± 0.79 < 0.001
VB12 (pg/mL)
  Total 291.94 ± 26.39 251.61 ± 22.38 0.039 264.00 ± 23.59 0.180
    With metformin 323.25 ± 51.75 262.75 ± 40.96 0.017 249.75 ± 41.28 0.004
    Without metformin 266.90 ± 23.32 242.71 ± 25.27 0.484 275.40 ± 28.27 0.906


↓  Table 4. Baseline Characteristics of Subgroups With and Without Metformin
 
Group with metformin Group without metformin P
Data are expressed as mean ± SE. SE: standard error; BMI: body mass index; HbA1c: glycated hemoglobin; eGFR: estimated glomerular filtration rate; UACR: urinary albumin-to-creatinine ratio.
N (men/women) 8 (6/2) 13 (8/5)
Age (years) 63.32 ± 4.175 66.41 ± 2.919 0.281
BMI (kg/m2) 26.83 ± 1.081 25.19 ± 0.835 0.132
HbA1c (%) 8.19 ± 0.263 8.11 ± 0.143 0.263
eGFR (mL/min/1.73m2) 70.5 ± 4.09 67.2 ± 3.23 0.275
UACR (mg/gCre) 84.5 ± 16.7 110.1 ± 16.6 0.195