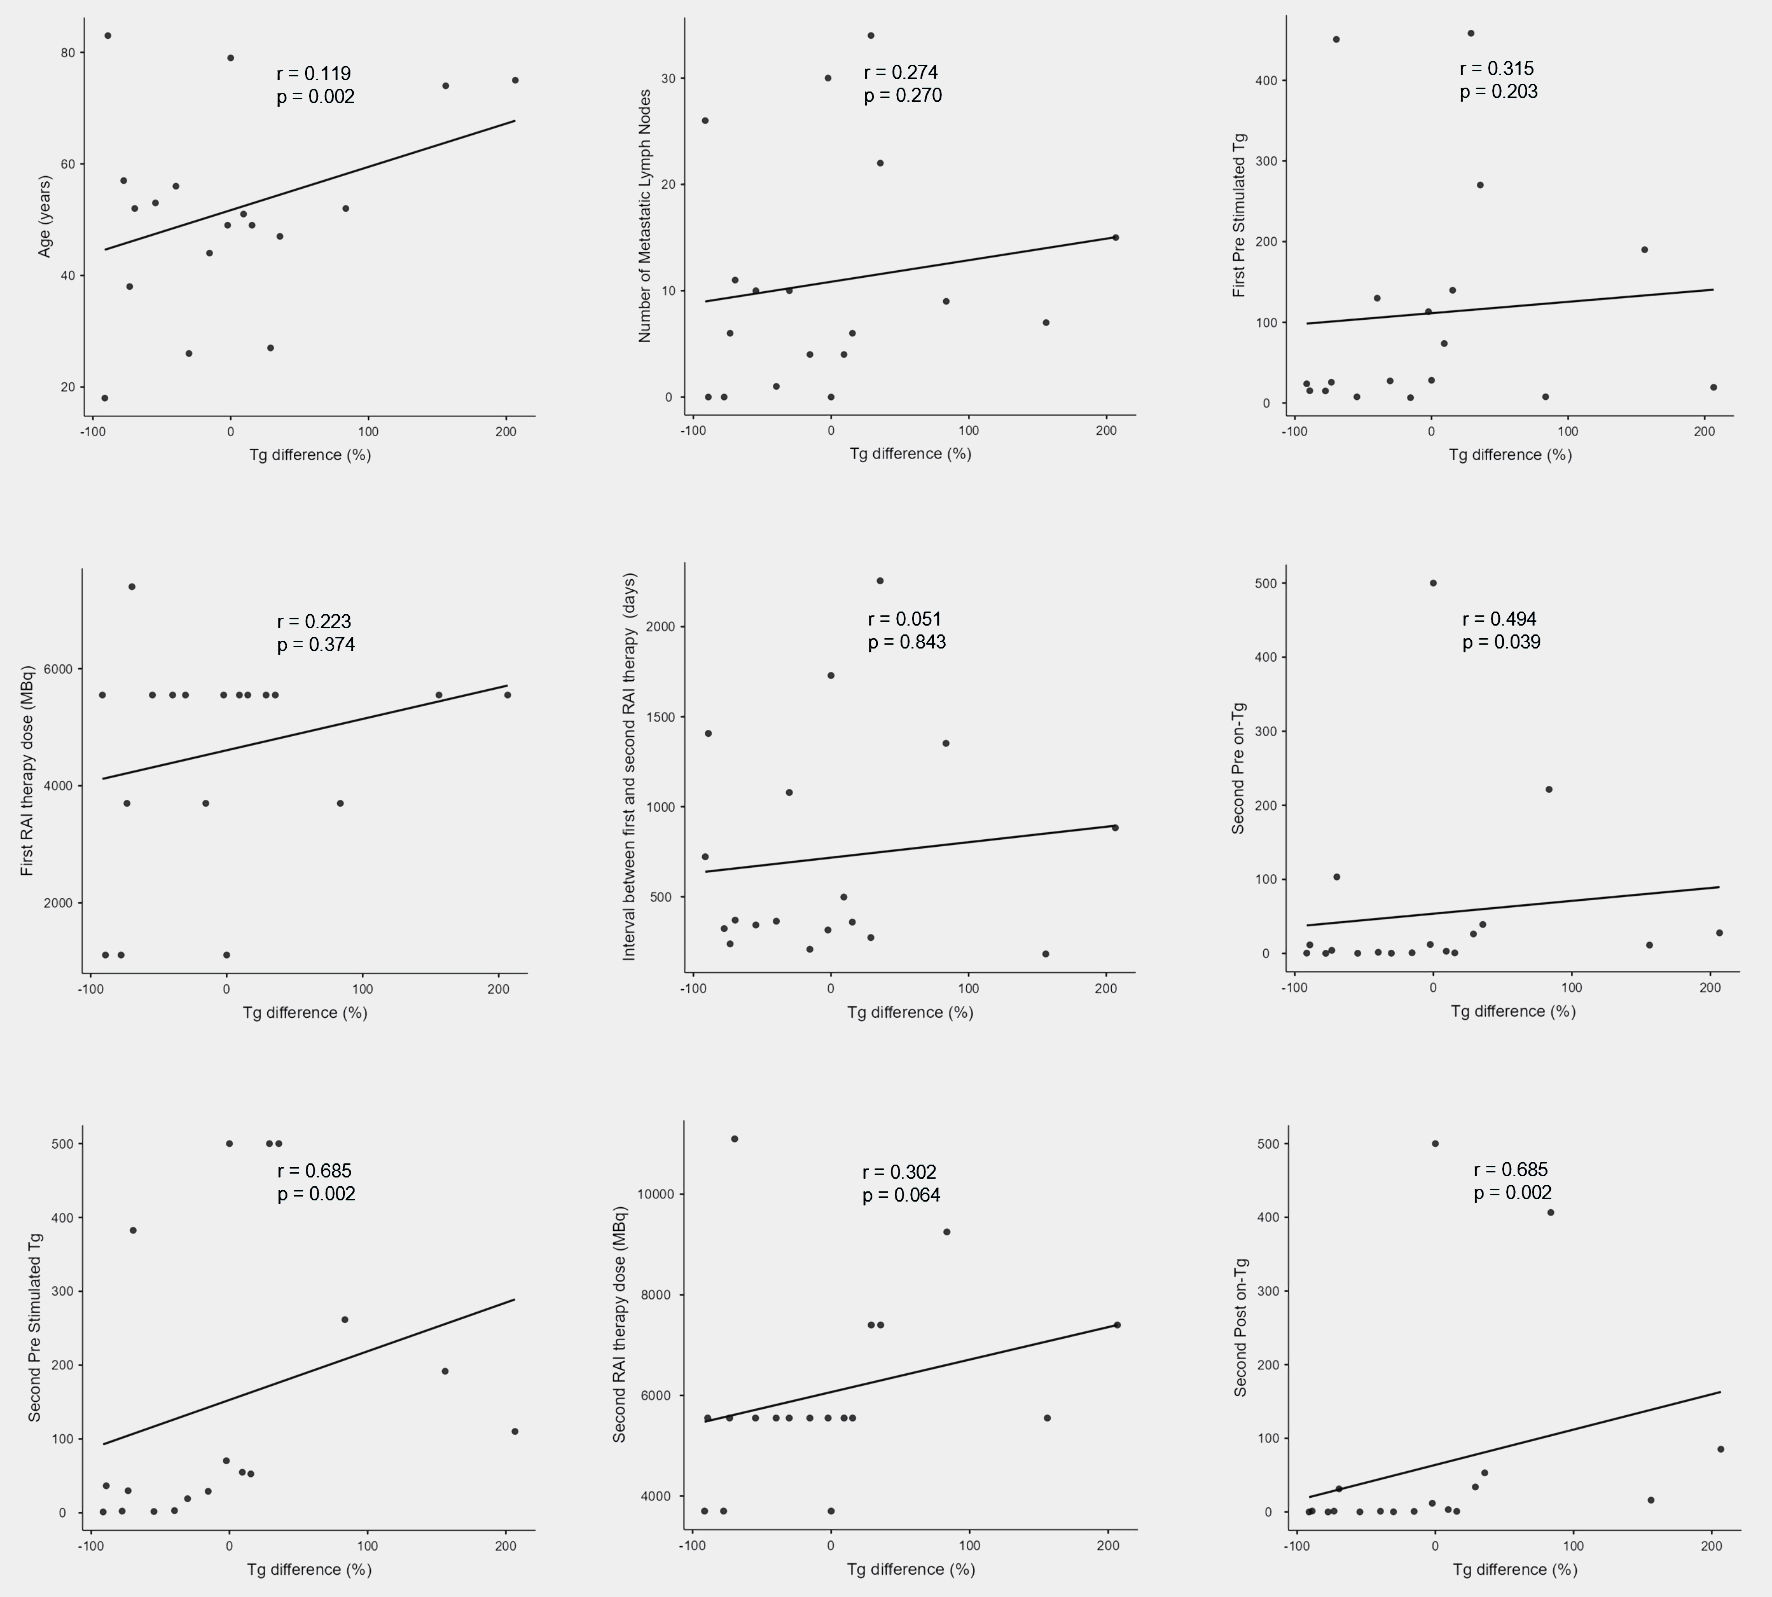
↓ Figure 1. Results of correlation analyses
between Tg difference (%) and various clinical parameters. RAI: radioactive iodine; Tg:
thyroglobulin.
| Journal of Endocrinology and Metabolism, ISSN 1923-2861 print, 1923-287X online, Open Access |
| Article copyright, the authors; Journal compilation copyright, J Endocrinol Metab and Elmer Press Inc |
| Journal website https://jem.elmerpub.com |
Original Article
Volume 15, Number 4, October 2025, pages 137-143
Efficacy of Second Radioactive Iodine Therapy Based on Serum Thyroglobulin for Papillary Thyroid Cancer: A Retrospective Cohort Study
Figure
Tables
| Response (n = 11) | No response (n = 7) | P value | |
|---|---|---|---|
| ATA: American Thyroid Association; BIR: biochemical incomplete response; NED: no evidence of disease; RAI: radioactive iodine; SIR: structural incomplete response; Tg: thyroglobulin. | |||
| Age in years, median (percentile) | 49 (41 - 55) | 52 (49 - 74) | 0.389 |
| Gender, female n (percentage) | 7 (63.6%) | 6 (25.7%) | 0.596 |
| T stage | 0.135 | ||
| 1 | 4 (36.4%) | 0 | |
| 2 | 2 (18.2%) | 0 | |
| 3 | 4 (36.4%) | 5 (71.4%) | |
| 4 | 1 (9.1%) | 2 (28.6%) | |
| Nodal metastasis | |||
| Present, n (percentage) | 9 (81.8%) | 6 (85.7%) | 1 |
| Number, median, (percentile) | 6 (3 - 11) | 9 (5 - 17) | 0.555 |
| ATA risk classification | 0.977 | ||
| Low (percentage) | 3 (27.3%) | 2 (28.6%) | |
| Intermediate (percentage) | 6 (54.5%) | 4 (57.1%) | |
| High (percentage) | 2 (18.2%) | 1 (14.3%) | |
| First RAI therapy dose (mCi) | 150 (100 - 150) | 150 (125 - 150) | 0.301 |
| First stimulated Tg (ng/mL) | 25.65 (15 - 122) | 28.1 (13.5 - 132) | 0.285 |
| Cause of second RAI therapy | 0.002 | ||
| SIR | 10 (90.9%) | 1 (14.3%) | |
| BIR | 1 (9.1%) | 6 (85.7%) | |
| Reoperation | 9 (81.8%) | 2 (28.6%) | 0.049 |
| Interval between first and second RAI therapy (days) | 359 (319 - 546) | 883 (653 - 1,541) | 0.285 |
| Second pre on-Tg | 0.91 (0.39 - 7.9) | 27.79 (7.16 - 130) | 0.008 |
| Second pre stimulated Tg | 29.06 (2.60 - 44.6) | 261.61 (82.5 - 381) | 0.003 |
| Second RAI therapy dose (mCi) | 150 (150 - 150) | 200 (150 - 200) | 0.162 |
| Second iodine scan uptake, present (percentage) | 3 (27.3%) | 4 (57.1%) | 0.332 |
| Second post on-Tg | 0.86 (0.172 - 1.19) | 53.08 (9.67 - 246) | 0.002 |
| NED status | 5 (45.5%) | 4 (57.1%) | 1 |
| NED (n = 11) | Incomplete remission (n = 10) | P value | |
|---|---|---|---|
| ATA: American Thyroid Association; BIR: biochemical incomplete response; NED: no evidence of disease; RAI: radioactive iodine; SIR: structural incomplete response; Tg: thyroglobulin. | |||
| Age, years, median (percentile) | 49 (41 - 52) | 54 (50 - 60) | 0.158 |
| Gender, female number (percentage) | 9 (81.8%) | 7 (70.0%) | 0.635 |
| T stage | 1 | ||
| 1 | 2 (18.2%) | 2 (20.0%) | |
| 2 | 2 (18.2%) | 1 (10.0%) | |
| 3 | 6 (54.5%) | 5 (50.0%) | |
| 4 | 1 (9.1%) | 2 (20.0%) | |
| Nodal metastasis | |||
| Present, number (percentage) | 10 (90.9%) | 8 (80.0%) | 0.586 |
| Number, median, (percentile) | 8 (4 - 16) | 6 (2 - 14) | 0.972 |
| ATA risk classification | 0.059 | ||
| Low (percentage) | 5 (45.5%) | 2 (20.0%) | |
| Intermediate (percentage) | 6 (54.5%) | 4 (40.0%) | |
| High (percentage) | 0 | 4 (40.0%) | |
| First RAI therapy dose (mCi) | 150 (100 - 150) | 150 (150 - 150) | 0.609 |
| First stimulated Tg (ng/mL) | 25.65 (7.06 - 50.9) | 74.62 (15 - 177) | 0.349 |
| Cause of second RAI therapy | 1 | ||
| SIR | 7 (63.6%) | 7 (70.0%) | |
| BIR | 4 (36.4%) | 3 (30%) | |
| Reoperation | 8 (72.7%) | 6 (60%) | 0.659 |
| Interval between first and second RAI therapy (days) | 833 (407 - 1,541) | 361.5 (328 - 698) | 0.197 |
| Second pre on-Tg | 3 (0.397 - 25.6) | 6.46 (0.374 - 22.6) | 0.916 |
| Second pre stimulated Tg | 29.85 (10.1 - 166) | 44.61 (2.43 - 171) | 0.86 |
| Second RAI therapy dose (mCi) | 150 (150 - 150) | 150 (150 - 188) | 0.492 |
| Second post on-Tg | 1.12 (0.185 - 32.5) | 1.11 (0.301 - 27.5) | 0.916 |
| Tg difference (%) | 0 (-22.8 - 10.4) | -25.5 (-65.9 - 25.6) | 0.86 |