Journal of Endocrinology and Metabolism, ISSN 1923-2861 print, 1923-287X online, Open Access
Article copyright, the authors; Journal compilation copyright, J Endocrinol Metab and Elmer Press Inc
Journal website https://jem.elmerpub.com

Original Article

Volume 15, Number 4, October 2025, pages 144-152


Role of Adiponectin in Modulating Insulin Resistance in Visceral Obesity-Associated Type 2 Diabetes Mellitus

Figure

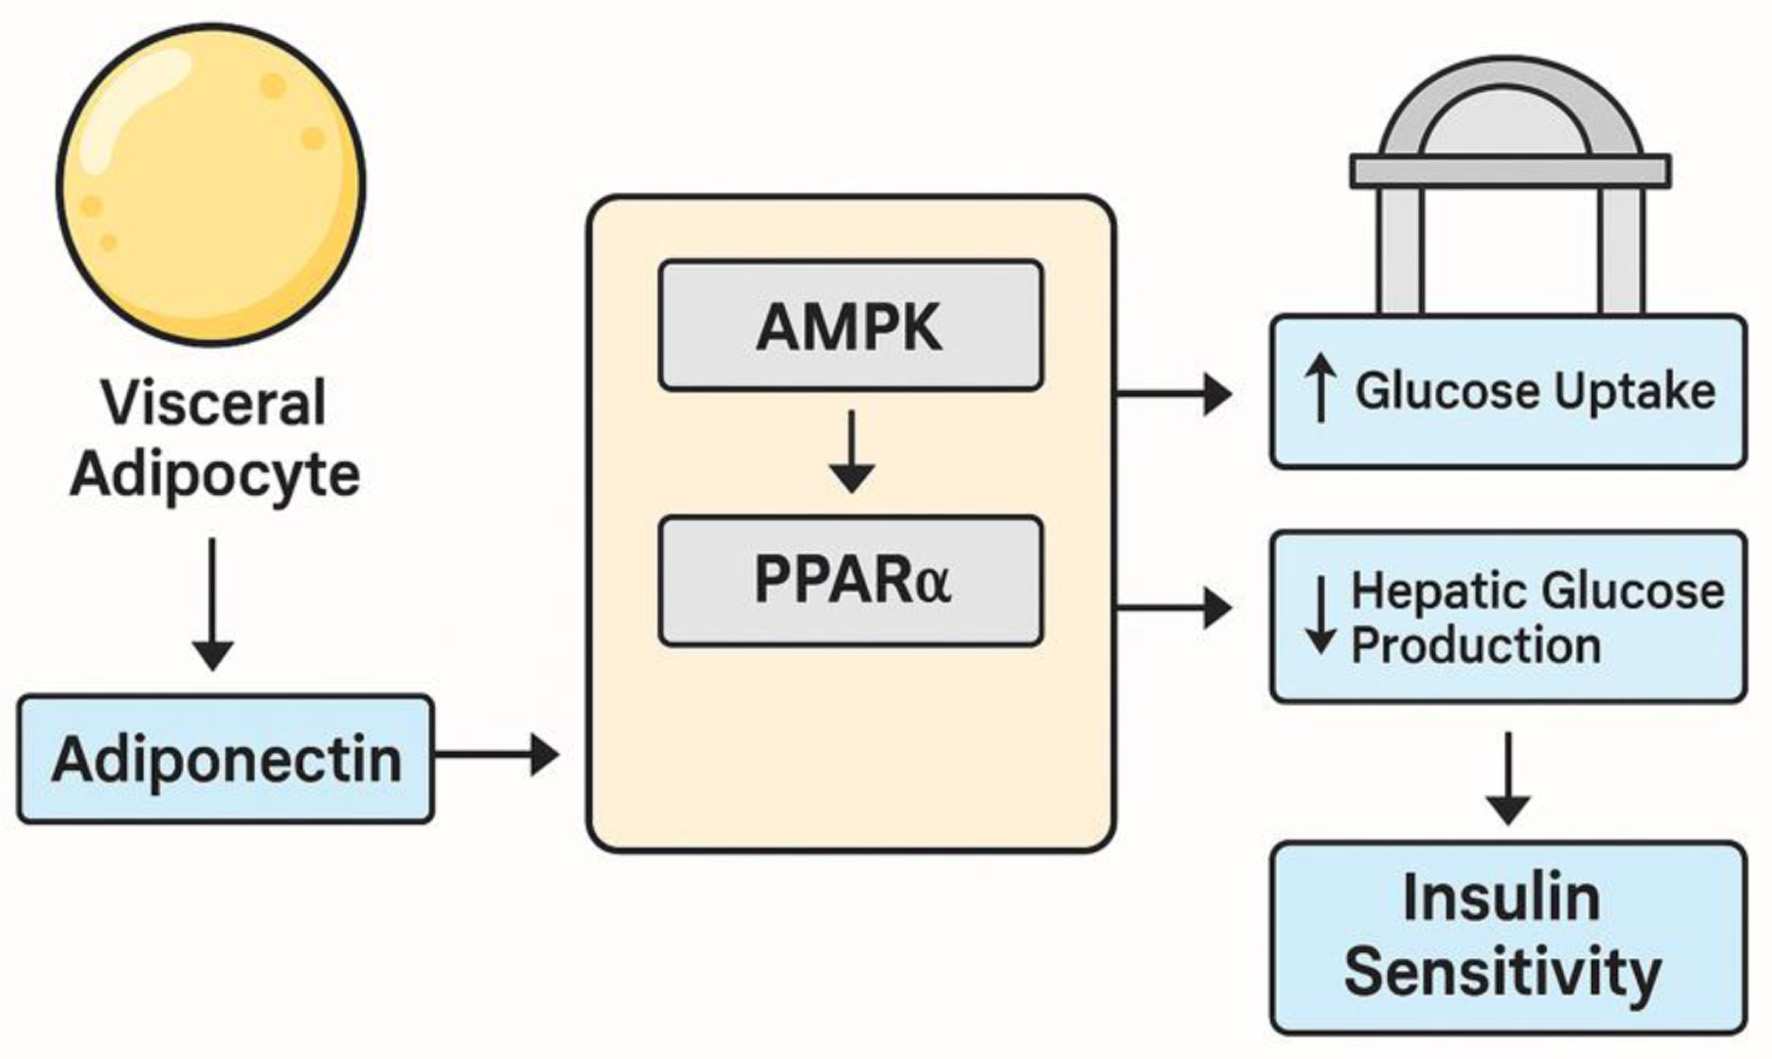
↓  Figure 1. Pathway illustrating the regulatory role of adiponectin via AMPK and PPAR-α signaling. Adiponectin binding to AdipoR1/AdipoR2 activates AMPK and PPAR-α, promoting glucose uptake in skeletal muscle, enhancing fatty acid oxidation and suppressing hepatic gluconeogenesis, thereby improving insulin sensitivity. AdipoR1: adiponectin receptor 1; AdipoR2: adiponectin receptor 2; AMPK: AMP-activated protein kinase; PPAR-α: peroxisome proliferator-activated receptor-alpha.
Figure 1.

Tables

↓  Table 1. Normality Assessment of Variables in Overweight and Obese Groups
 
Variable Shapiro-Wilk P (overweight) Normality (overweight) Shapiro-Wilk P (obese) Normality (obese)
P < 0.05 was considered as significant. BMI: body mass index; FPG: fasting plasma glucose; HbA1c: glycated hemoglobin; HDL: high-density lipoprotein; HOMA-IR: homeostatic model assessment for insulin resistance; LDL: low-density lipoprotein; PPBG: postprandial blood glucose; TC: total cholesterol; TG: triglycerides; WC: waist circumference.
Age 0.010 Non-normal 0.001 Non-normal
Height 0.190 Normal 0.153 Normal
Weight (kg) 0.016 Non-normal 0.372 Normal
WC (cm) 0.001 Non-normal 0.001 Non-normal
BMI (kg/m2) 0.040 Non-normal 0.028 Non-normal
FPG (mmol/L) 0.046 Non-normal 0.395 Normal
PPBG (mmol/L) 0.385 Normal 0.027 Non-normal
HbA1c (%) 0.532 Normal 0.019 Non-normal
Insulin (µIU/mL) 0.019 Non-normal 0.096 Normal
HOMA-IR 0.001 Non-normal 0.001 Non-normal
Adiponectin (µg/mL) 0.001 Non-normal 0.001 Non-normal
TC (mmol/L) 0.001 Non-normal 0.001 Non-normal
TG (mmol/L) 0.005 Non-normal 0.261 Normal
HDL (mmol/L) 0.001 Non-normal 0.001 Non-normal
LDL (mmol/L) 0.001 Non-normal 0.001 Non-normal


↓  Table 2. Anthropometric and Biochemical Parameters in Overweight and Obese Participants
 
Variable Overweight (mean ± SD/median (IQR)) Obese (mean ± SD/median (IQR)) Test statistic P-value
Mean ± SD is used for normally distributed data, and median (IQR) is used for non-normally distributed variables. P < 0.05 was considered as significant. BMI: body mass index; FPG: fasting plasma glucose; HbA1c: glycated hemoglobin; HDL: high-density lipoprotein; HOMA-IR: homeostatic model assessment for insulin resistance; LDL: low-density lipoprotein; PPBG: postprandial blood glucose; TC: total cholesterol; TG: triglycerides; WC: waist circumference.
Height (cm) 168.42 ± 8.24 166.86 ± 8.82 t = 1.079 0.283
Weight (kg) 77.1 (71.2 - 81.6) 90.0 (83.0-96.4) U = 780.5 < 0.001
WC (cm) 97.0 (94.0 - 97.0) 101.3 (97.5 - 105.6) U = 1,343.5 < 0.001
BMI (kg/m2) 27.3 (26.1 - 28.2) 32.4 (31.2 - 33.0) U = 0.0 < 0.001
FPG (mmol/L) 13.6 (12.7 - 15.1) 13.9 (13.1 - 14.4) U = 2,061.0 0.126
PPBG (mmol/L) 17.1 (15.9 - 19.5) 17.7 (16.4 - 20.1) U = 2,153.0 0.254
HbA1c (%) 9.0 (8.3 - 10.2) 9.3 (8.6 - 9.9) U = 2,127.0 0.211
Insulin (µIU/mL) 6.6 (6.2 - 7.0) 6.5 (6.2 - 6.9) U = 1,922.5 0.035
HOMA-IR 4.0 (4.0 - 4.0) 4.0 (4.0 - 4.0) U = 2,415.0 0.958
Adiponectin (µg/mL) 11.3 (10.7 - 12.0) 11.3 (10.5 - 11.6) U = 1,891.5 0.016
TC (mmol/L) 5.3 (5.2 - 5.4) 5.3 (5.2 - 5.4) U = 2,079.5 0.125
TG (mmol/L) 3.2 (3.0 - 3.4) 3.3 (3.2 - 3.5) U = 2,061.5 0.124
HDL (mmol/L) 1.1 (1.0 - 1.1) 1.1 (1.0 - 1.1) U = 1,922.5 0.015
LDL (mmol/L) 2.7 (2.7 - 2.8) 2.8 (2.7 - 2.8) U = 2,205.0 0.286


↓  Table 3. Correlation of Adiponectin With Anthropometric and Biochemical Parameters
 
Variable All cases (ρ) P-value Overweight (ρ) Overweight (P-value) Obese (ρ) Obese (P-value)
Data are represented as Spearman rank correlation coefficient (ρ). *Correlation is significant at 0.05 level (two-tailed). **Correlation is significant at 0.01 level (two-tailed). BMI: body mass index; FPG: fasting plasma glucose; HbA1c: glycated hemoglobin; HDL: high-density lipoprotein; HOMA-IR: homeostatic model assessment for insulin resistance; LDL: low-density lipoprotein; PPBG: postprandial blood glucose; TC: total cholesterol; TG: triglycerides; WC: waist circumference.
WC (cm) -0.230** 0.006 -0.35* 0.025 -0.45* 0.008
BMI (kg/m2) -0.173* 0.041 -0.28* 0.041 -0.38* 0.015
Insulin (µIU/mL) 0.750** < 0.001 0.749** < 0.001 0.763** < 0.001
HOMA-IR -0.45** < 0.001 -0.45* 0.010 -0.61** < 0.001
FPG (mmol/L) -0.785** < 0.001 -0.796** < 0.001 -0.772** < 0.001
PPBG (mmol/L) -0.648** < 0.001 -0.704** < 0.001 -0.559** < 0.001
HbA1c (%) -0.640** < 0.001 -0.675** < 0.001 -0.577** < 0.001
TC (mmol/L) -0.738** < 0.001 -0.795** < 0.001 -0.666** < 0.001
TG (mmol/L) -0.792** < 0.001 -0.807** < 0.001 -0.777** < 0.001
HDL (mmol/L) 0.918** < 0.001 0.923** < 0.001 0.915** < 0.001
LDL (mmol/L) -0.552** < 0.001 -0.565** < 0.001 -0.545** < 0.001