Journal of Endocrinology and Metabolism, ISSN 1923-2861 print, 1923-287X online, Open Access
Article copyright, the authors; Journal compilation copyright, J Endocrinol Metab and Elmer Press Inc
Journal website https://jem.elmerpub.com

Original Article

Volume 15, Number 4, October 2025, pages 161-180


Link Between Immune Dysregulation in COVID-19 and Beta-Cell Dysfunction

Figures

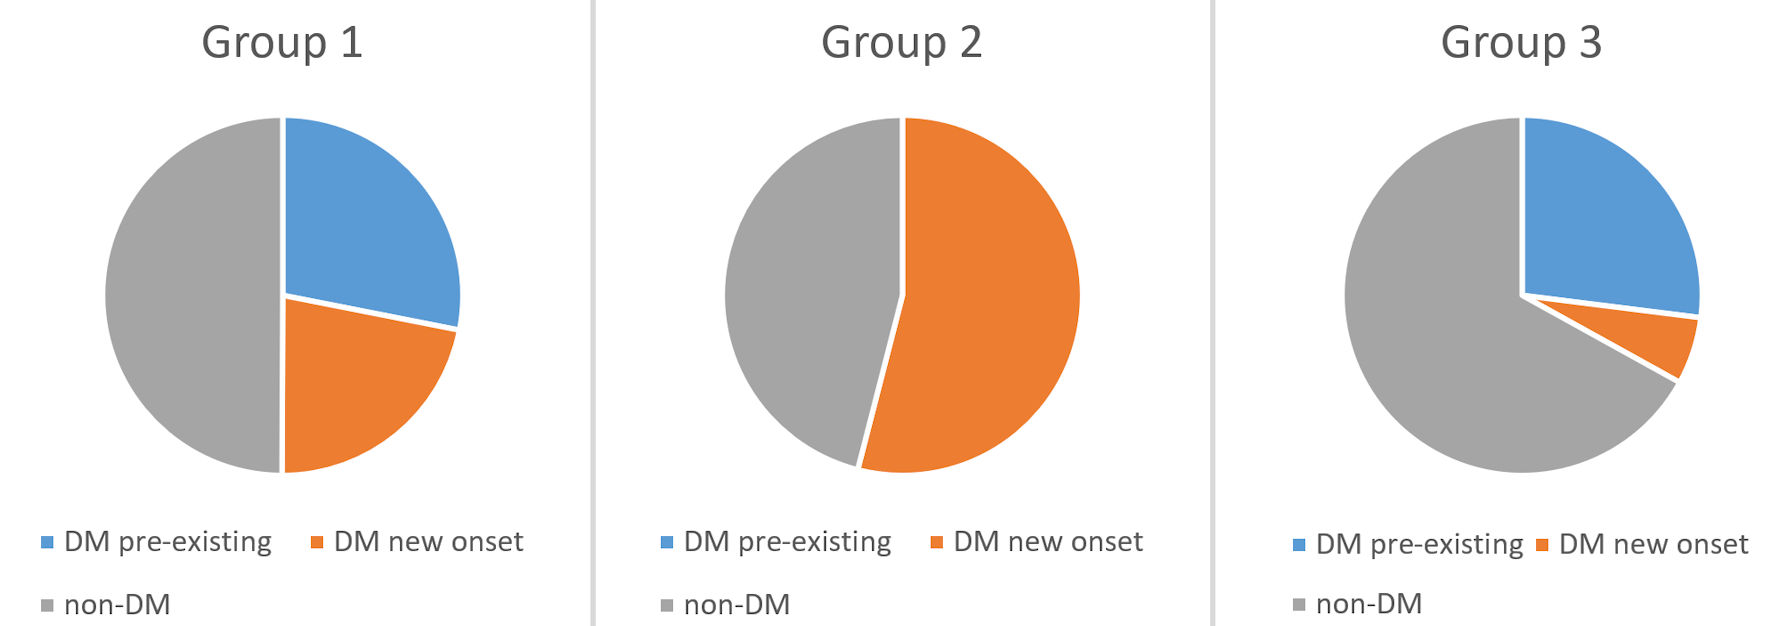
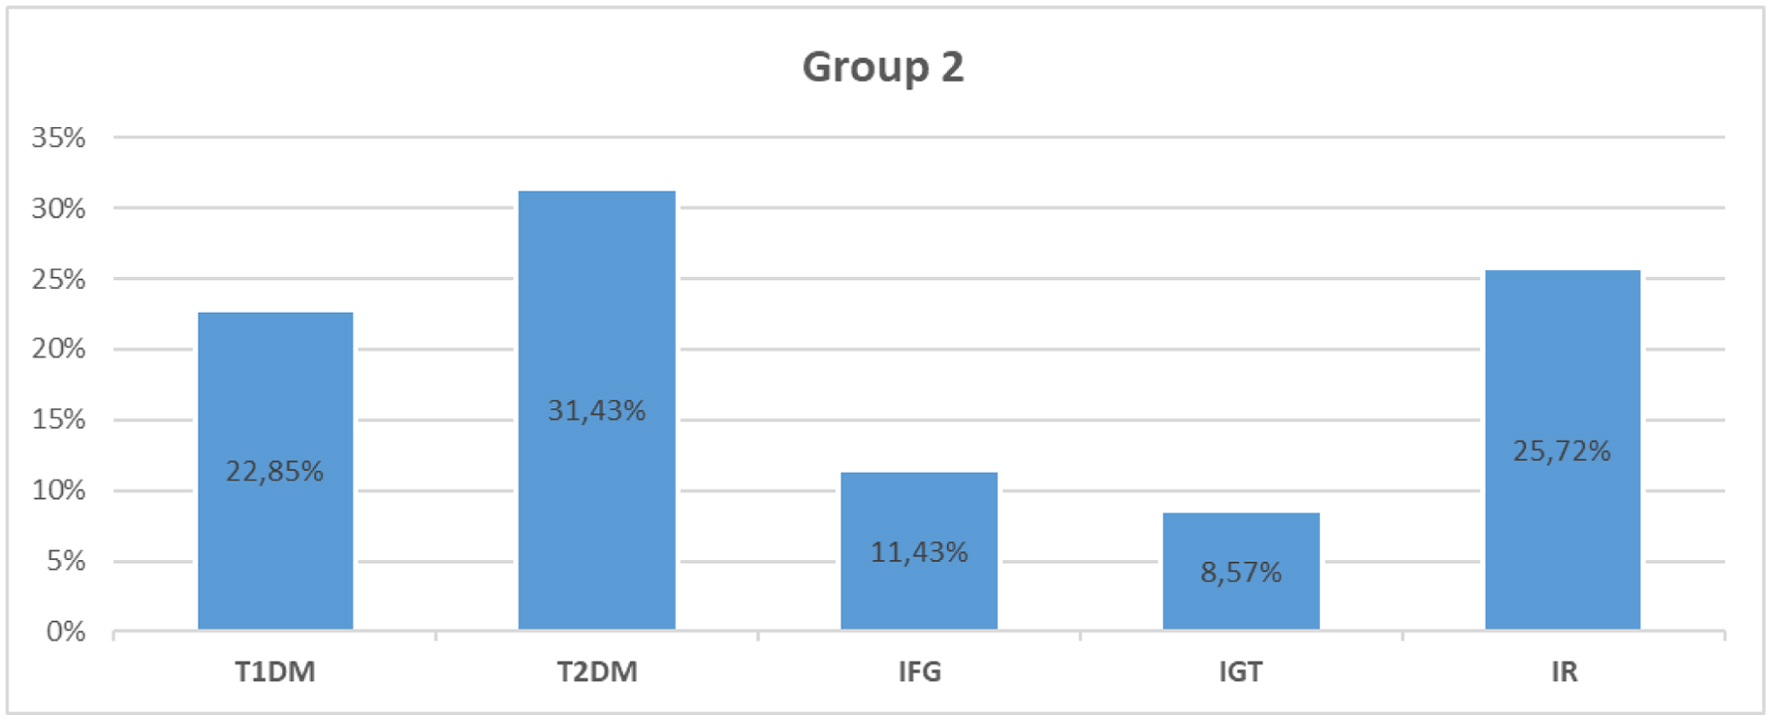
↓  Figure 1. Distribution of the patients from group 2 (post-COVID-19 group) according to the type of carbohydrate disorder. T1DM: type 1 diabetes mellitus; T2DM: type 2 diabetes mellitus; IFG: impaired fasting glucose; IGT: impaired glucose tolerance; IR: insulin resistance; COVID-19: coronavirus disease 2019.
Figure 1.
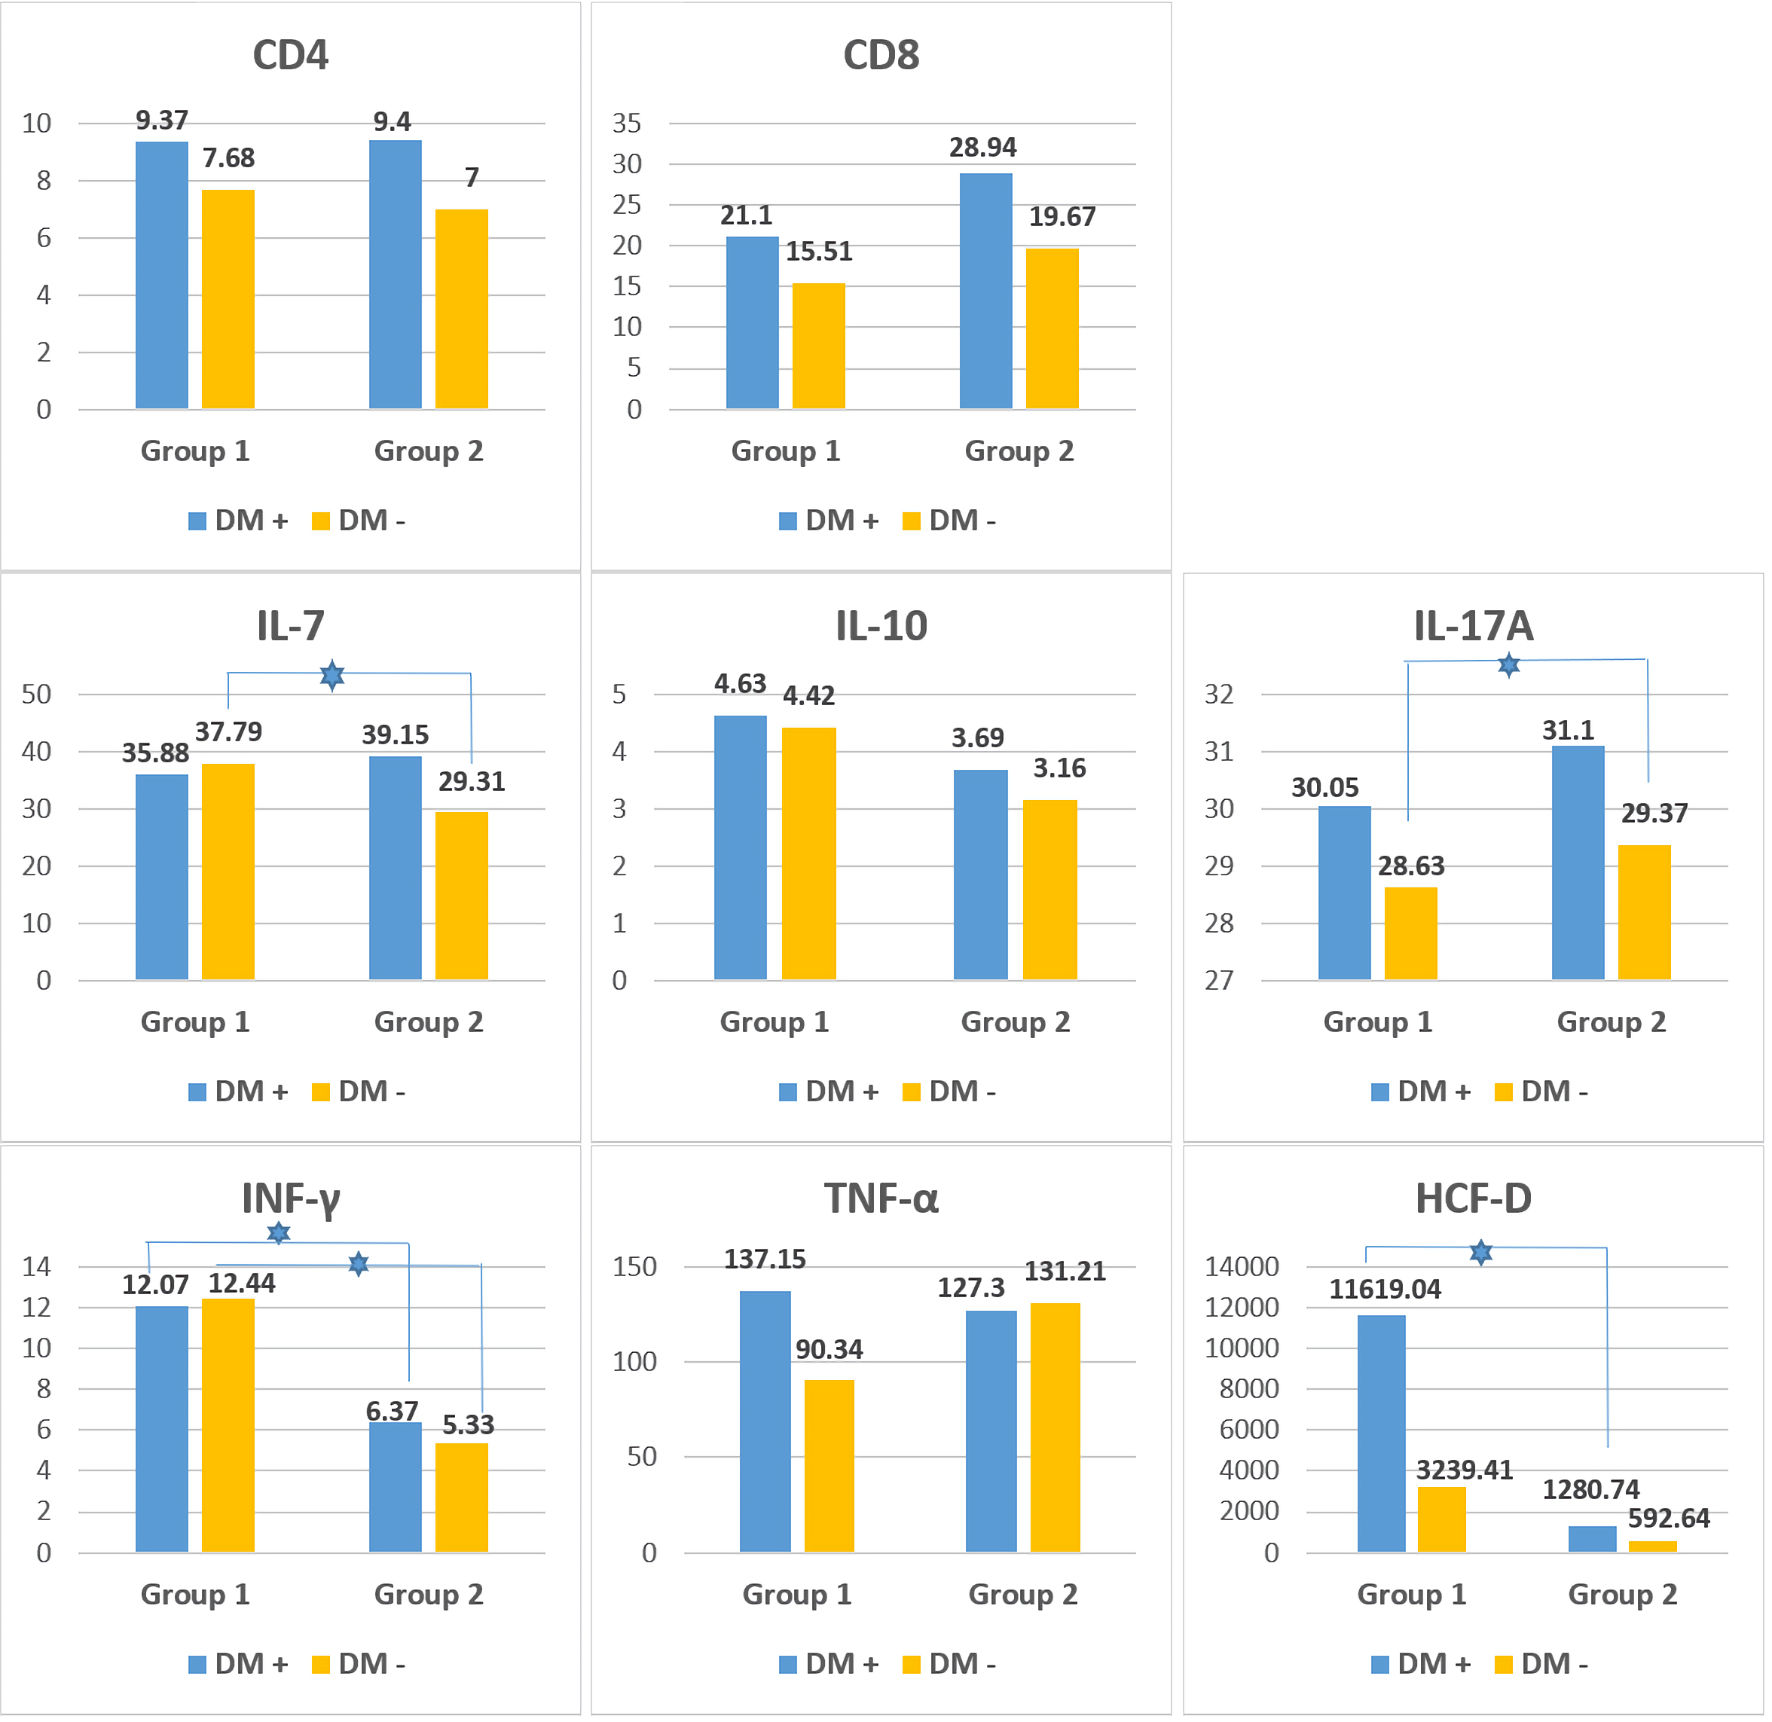
↓  Figure 2. Immunological parameters (mean values) in patients with DM (DM+) and without DM (DM -) in patients from group 1 (active COVID-19) and group 2 (post-COVID-19 with new-onset carbohydrate disorders). The blue star indicates a statistically significant difference (P < 0.05) between the two subgroups (DM+ and DM-). CD: cluster of differentiation; IL: interleukin; IFN-γ: interferon-gamma; TNF-α: tumor-necrosis factor - alpha; HCFD: human complement factor D; DM: diabetes mellitus; COVID-19: coronavirus disease 2019.
Figure 2.
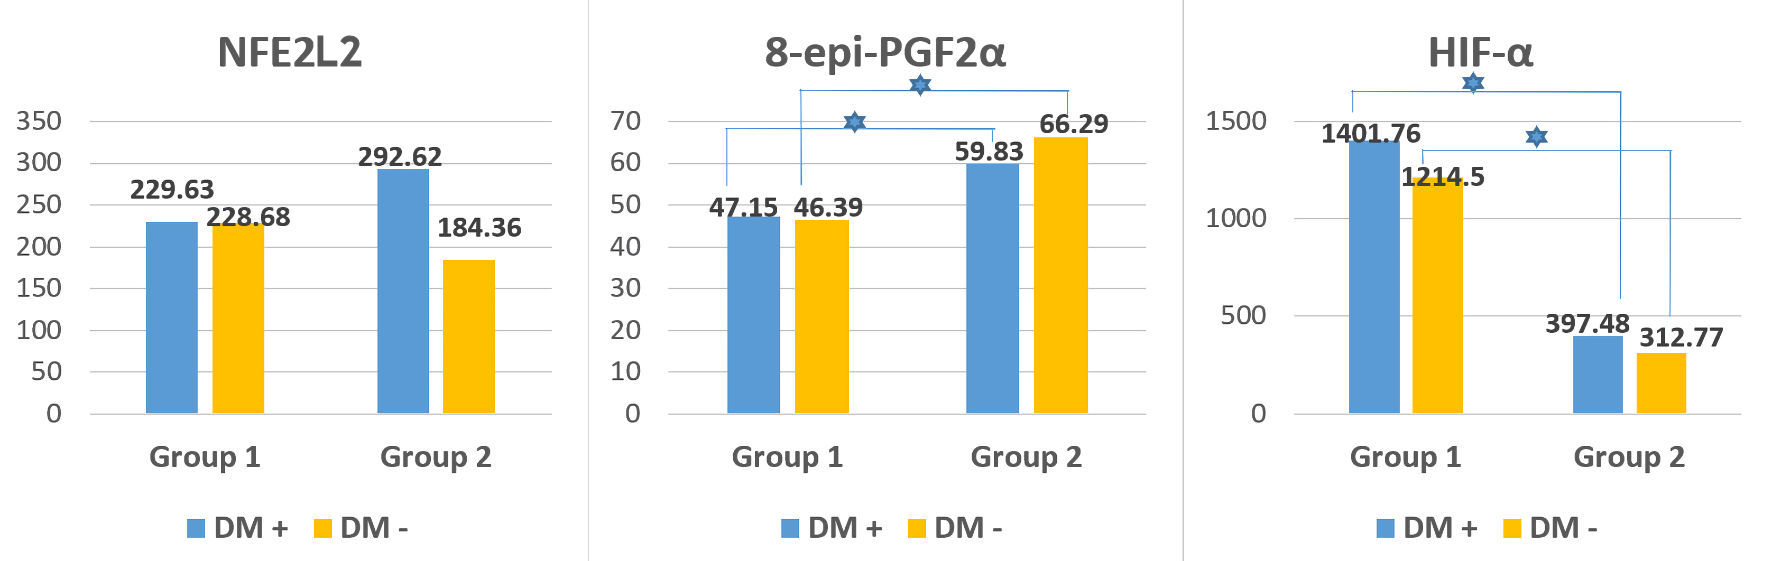
↓  Figure 3. Oxidative stress, antioxidant defense and hypoxia indicators (mean values) in patients with DM (DM+) and without DM (DM-) in patients from group 1 (active COVID-19) and group 2 (post-COVID-19 with new-onset carbohydrate disorders). The blue star indicates a statistically significant difference (P < 0.05) between the two subgroups (DM+ and DM-). 8-epi-PGF2α: 8-epi-prostaglandyn F2 alpha; NFE2L2: nuclear factor erythroid 2-related factor 2; HIF-1α: hypoxia inducible factor-1 alpha; DM: diabetes mellitus; COVID-19: coronavirus disease 2019.
Figure 3.
↓  Figure 4. Distribution of the patients according to the diagnosis of DM and its duration among the three groups. DM: diabetes mellitus.
Figure 4.

Tables

↓  Table 1. General Clinical Characteristics of the Study Population
 
Variable Group 1 (n = 32) Group 2 (n = 35) Group 3 (n = 33) All (n = 100)
DM: diabetes mellitus.
Age (mean) 66.71 ± 4.87 45.35 ± 4.98 48.21 ± 4.51 53.07 ± 3.27
Gender
  Male N = 18 (56.25%) N = 13 (37.15%) N = 3 (9.1%) N = 34 (34%)
  Female N = 14 (43.75%) N = 22 (62.85%) N = 30 (90.90%) N = 66 (66%)
Family history of DM
  Yes N = 7 (21.88%) N = 14 (40%) N = 15 (45.45%) N = 36 (36%)
  No N = 25 (78.12%) N = 21 (60%) N = 18 (54.55%) N = 64 (64%)
Residence
  Urban N = 22 (68.75%) N = 25 (71.43%) N = 23 (69.70%) N = 70 (70%)
  Rural N = 10 (31.25%) N = 10 (28.57%) N = 10 (30.30%) N = 30 (30%)
Smoking
  Yes N = 7 (21.88%) N = 8 (22.86%) N = 10 (30.30%) N = 25 (25%)
  No N = 25 (78.12%) N = 27 (77.14%) N = 23 (69.70%) N = 75 (75%)
Sedentary lifestyle
  Yes N = 22 (68.75%) N = 13 (37.15%) N = 20 (60.60%) N = 55 (55%)
  No N = 10 (31.25%) N = 22 (62.85%) N = 13 (39.40%) N = 45 (45%)


↓  Table 2. Metabolic Characteristics of the Study Population
 
Variable Group 1 (n = 32) Group 2 (n = 35) Group 3 (n = 33) All (n = 100)
BMI: body mass index; T1DM: type 1 diabetes mellitus; T2DM: type 2 diabetes mellitus; IFG: impaired fasting glucose; IGT: impaired glucose tolerance; IR: insulin resistance; DM: diabetes mellitus.
BMI
  Mean - 31.91 ± 2.57 35.67 ± 2.8
  < 18.5 kg/m2 - N = 0 (0%) N = 0 (0%)
  18.5 - 24.99 kg/m2 - N = 7 (20%) N = 4 (12.12%)
  25 - 29.99 kg/m2 - N = 9 (25.72%) N = 4 (12.12%)
  30 - 34.99 kg/m2 - N = 6 (17.15%) N = 8 (24.24%)
  35 - 39.99 kg/m2 - N = 8 (22.85%) N = 6 (18.18%)
  > 40 kg/m2 - N = 5 (14.28%) N = 11 (33.33%)
DM
  Yes N = 16 (50%) N = 19 (54.28%) N = 11 (33.33%) N = 46 (46%)
  No N = 16 (50%) N = 16 (45.72%) N = 22 (76.76%) N =54 (54%)
New-diagnosed DM
  Yes N = 7 (21.88%) N = 19 (54.28%) N = 2 (6.06%) N =28 (28%)
  No N =25 (78.12%) N = 16 (45.72%) N = 31 (93.94%) N =72 (72%)
Type of carbohydrate disorder
  T1DM N = 8 (22.85%) N = 0 (0%)
  T2DM N = 11 (31.43%) N = 11 (33.33%)
  IFG N = 4 (11.43%) N = 4 (12.12%)
  IGT N = 3 (8.57%) N = 2 (6.06%)
  IR/hyper-insulinemia N = 9 (25.72%) N = 16 (48.48%)


↓  Table 3. Standard Biochemical Parameters (Lipid Profile, UA and Liver Function Test) of the Study Population
 
Variable (mean ± SD) Group 1 (n = 32) Group 2 (n = 35) Group 3 (n = 33) P value
NS: no significance; P < 0.05 indicates a statistically significance difference. *P < 0.05: statistically significant difference between group 1 and group 2; **P < 0.05: statistically significant difference between group 2 and group 3. ***P < 0.05: statistically significant difference between group 1 and group 3. SD: standard deviation; TC: total cholesterol; TG: triglycerides; LDL-C: low-density lipoprotein cholesterol; HDL-C: high-density lipoprotein cholesterol; UA: uric acid; AST: aspartate aminotransferase; ALT: alanine aminotransferase; GGT: gamma-glutamyl transferase.
Lipid profile parameters
  TC (mmol/L) 4.00 ± 1.11 4.87 ± 1.46 4.89 ± 1.14 < 0.05*
< 0.05***
  TG (mmol/L) 2.05 ± 0.86 1.88 ± 0.84 1.90 ± 0.82 NS
  LDL-C (mmol/L) 3.23 ± 0.93 3.10 ± 1.37 3.19 ± 0.96 NS
  HDL-C (mmol/L) 0.72 ± 0.24 0.96 ± 0.38 0.87 ± 0.23 < 0.05*
UA (µmol/mL) 367.79 ± 159.0 398.23 ± 101.58 416.31 ± 101.37 < 0.05***
Liver function test
  AST (IU/L) 32.72 ± 30.52 20.13 ± 13.73 24.50 ± 19.35 NS
  ALT (IU/L) 34.77 ± 26.54 34.34 ± 45.74 26.09 ± 20.81 NS
  GGT (IU/L) 106.78 ± 199.04


↓  Table 4. Immunological and Other Parameters Evaluated Among the Study Population
 
Variable (mean ± SD) Group 1 (n = 32) Group 2 (n = 35) Group 3 (n = 33) P value
NS: no significance; P < 0.05 indicates statistically significance difference. *P < 0.05: statistically significant difference between group 1 and group 2; **P < 0.05: statistically significant difference between group 2 and group 3; ***P < 0.05: statistically significant difference between group 1 and group 3. SD: standard deviation; CD: cluster of differentiation; IL: interleukin; IFN-γ: interferon-gamma; TNF-α: tumor-necrosis factor-alpha; HCFD: human complement factor D; 8-epi-PGF2α: 8-epi-Prostaglandyn F2 alpha; NFE2L2: nuclear factor erythroid 2-related factor 2; HIF-1α: hypoxia inducible factor - 1 alpha.
CD4 (ng/mL) 8.65 ± 2.07 8.24 ± 3.18 4.41 ± 1.30 P < 0.05***
CD8 (ng/mL) 18.70 ± 4.21 24.45 ± 8.27 31.08 ± 7.73 NS
IL-7 (pg/mL) 36.70 ± 4.2 34.38 ± 11.71 55.22 ± 10.52 P < 0.05**
P < 0.05***
IL-10 (pg/mL) 4.54 ± 1.84 3.45 ± 1.48 2.99 ± 0.45 NS
IL-17A (pg/mL) 29.44 ± 1.90 30.26 ± 5.23 40.45 ± 12.62 P < 0.05**
IFN-γ (pg/mL) 12.23 ± 1.29 5.90 ± 1.51 14.90 ± 2.09 P < 0.05**
P < 0.05***
TNF-α (pg/mL) 117.09 ± 30.13 129.09 ± 40.17 86.36 ± 25.82 NS
HCFD (ng/mL) 8,027.77 ± 5,178.25 966.18 ± 700.37 34,611.23 ± 10,086.35 P < 0.05*
P < 0.05**
P < 0.05***
8-epi-PGF2α (pg/mL) 46.74 ± 3.91 62.64 ± 8.47 85.81 ± 28.41 P < 0.05*
P < 0.05**
P < 0.05***
NFE2L2 (pg/mL) 229.21 ± 26.27 245.91 ± 95.33 220.42 ± 38.32 NS
HIF-1α (pg/mL) 1,321.51 ± 474.21 358.76 ± 164.45 558.87 ± 168.36 P < 0.05*
P < 0.05**
P < 0.05***


↓  Table 5. Evaluated Glycemic and Hormonal Parameters Among the Studied Population
 
Variable (mean ± SD) Group 1 (n = 32) Group 2 (n = 35) Group 3 (n = 33) P value
NS: no significance; P < 0.05 indicates statistically significance difference. *P < 0.05: statistically significant difference between group 1 and group 2; **P < 0.05: statistically significant difference between group 2 and group 3; ***P < 0.05: statistically significant difference between group 1 and group 3. SD: standard deviation; HbA1c: glycated hemoglobin; GP-73: golgi protein-73.
Fasting glucose (mmol/L) 7.37 ± 1.81 7.64 ± 3.7 5.69 ± 1.76 P < 0.05**
P < 0.05***
HbA1c (%) 6.33 ± 0.83 8.00 ± 2.69 7.04 ± 1.4 NS
Insulin (µIU/mL) 26.19 ± 16.52 20.11 ± 19.5 31.86 ± 62.38 NS
C-peptide (ng/mL) 1.21 ± 1.21 1.54 ± 1.29 0.41 ± 0.61 P < 0.05**
P < 0.05***
Proinsulin (pg/mL) 56.03 ± 34.14 41.55 ± 39.98 54.22 ± 52.37 NS
Glucagon (pg/mL) 6,456.68 ± 2,391.16 5,403.88 ± 1,999.43 8,152.59 ± 1,492.96 P < 0.05**
P < 0.05***
GP-73 (ng/mL) 20.78 ± 9.7 42.39 ± 20.34 48.91 ± 26.15 P < 0.05*
P < 0.05***
Leptin (ng/mL) 20.25 ± 26.30 32.14 ± 25.69 52.02 ± 34.59 P < 0.05*
P < 0.05***
Adiponectin (µg/mL) 23.53 ± 3.92 25.03 ± 1.84 25.87 ± 0.60 NS


↓  Table 6. Estimated Insulin and Non-Insulin Derived Indices Among the Studied Population
 
Variable (mean ± SD) Group 1 (n = 32) Group 2 (n = 35) Group 3 (n = 33) P value
NS: no significance; P < 0.05 indicates statistically significance difference. *P < 0.05: statistically significant difference between group 1 and group 2; **P < 0.05: statistically significant difference between group 2 and group 3; ***P < 0.05: statistically significant difference between group 1 and group 3. SD: standard deviation; HOMA-IR: homeostasis model assessment of insulin resistance; HOMA-B: homeostasis model assessment of beta-cell function.
HOMA-IR 8.57 ± 5.59 7.41 ± 11.37 8.4 ± 17.67 NS
HOMA-B 159.33 ± 138.77 183.14 ± 175.85 330.09 ± 441.90 P < 0.05**
P < 0.05***
C-peptide/glucose ratio 0.89 ± 0.81 1.35 ± 1.26 0.45 ± 0.69 P < 0.05**
P < 0.05***
Insulin/proinsulin ratio 0.73 ± 0.87 0.71 ± 0.89 0.43 ± 0.26 P < 0.05**
P < 0.05***
Adiponectin/leptin ratio 5.81 ± 8.35 2.24 ± 3.69 0.89 ± 0.79 P < 0.05**
P < 0.05***