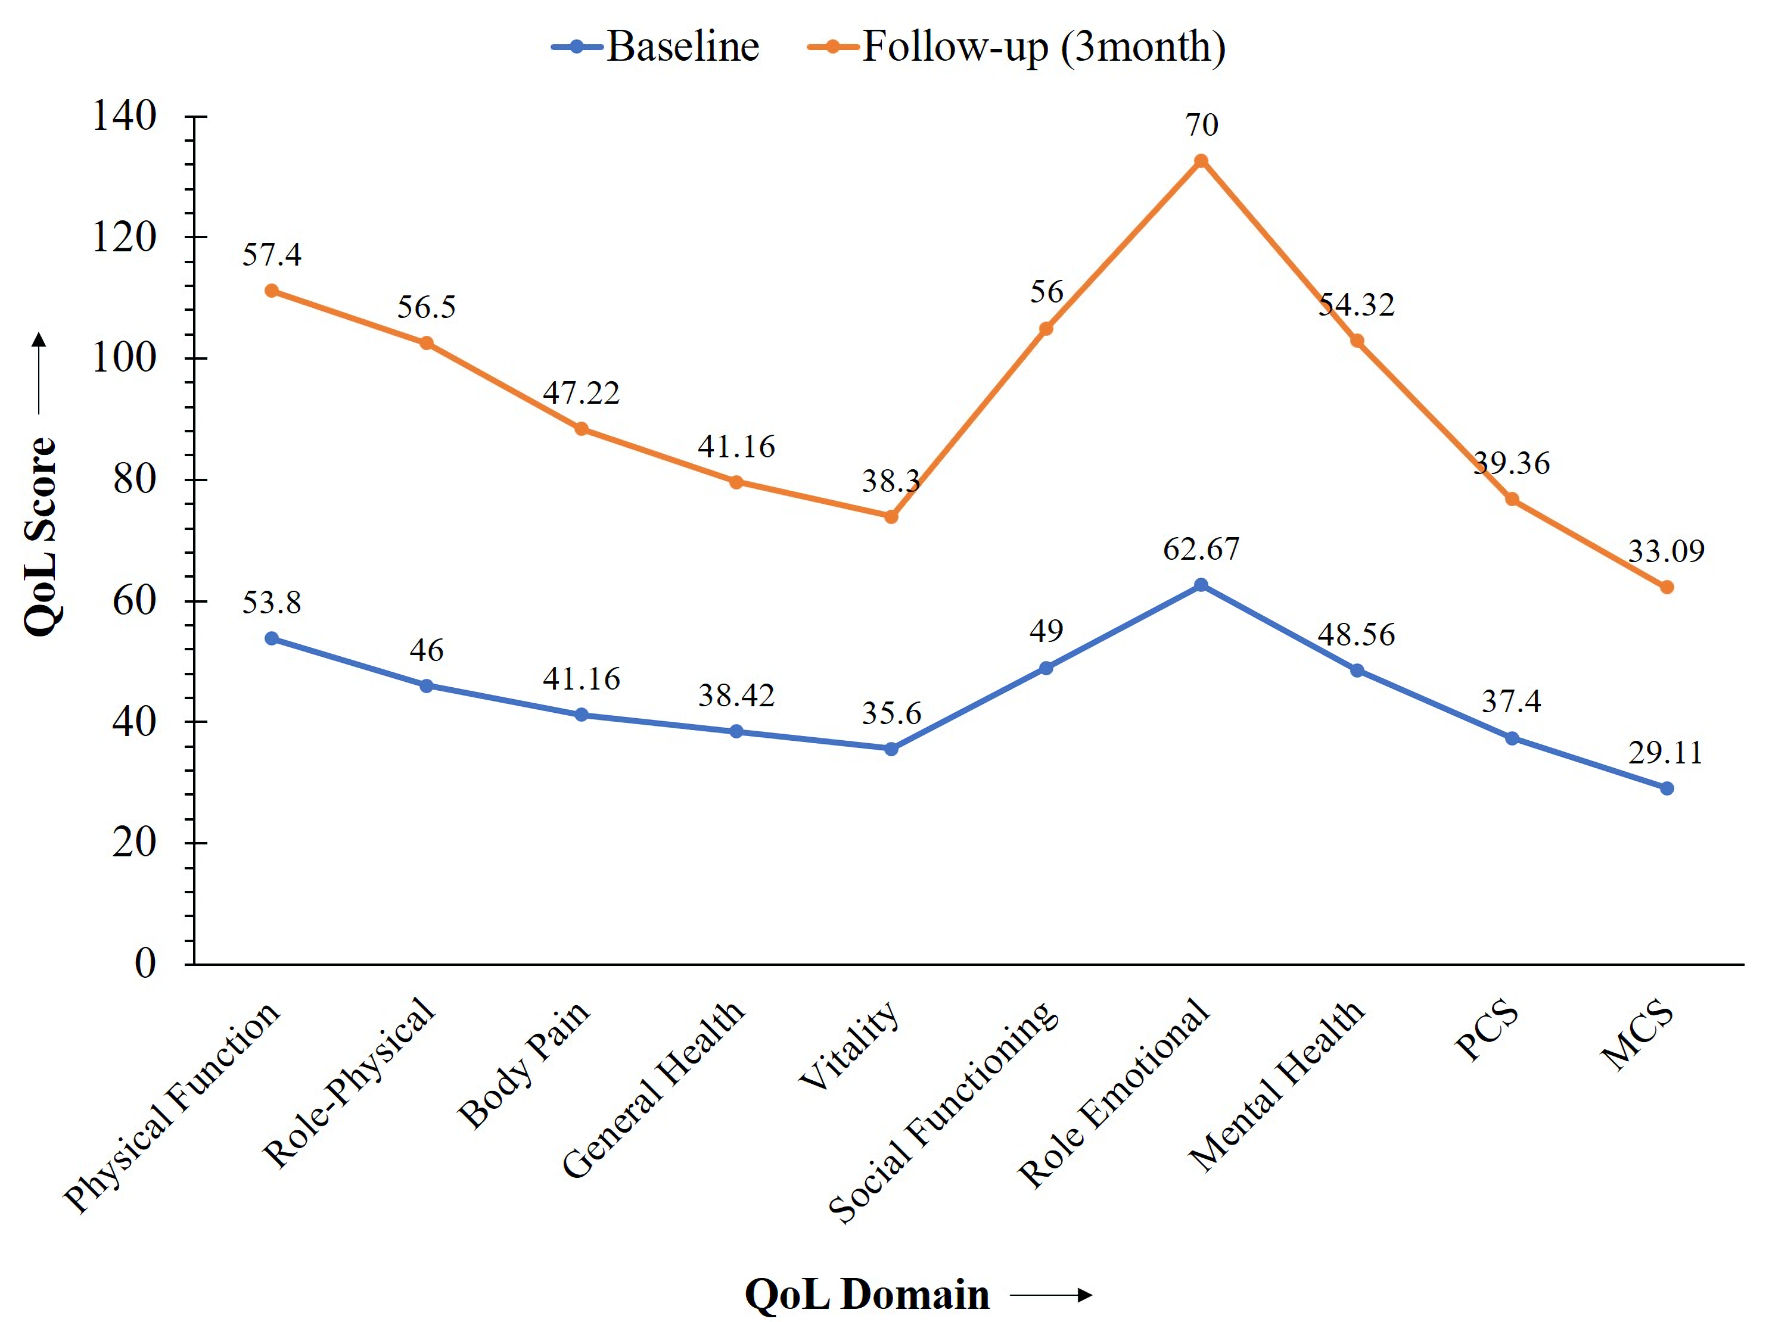
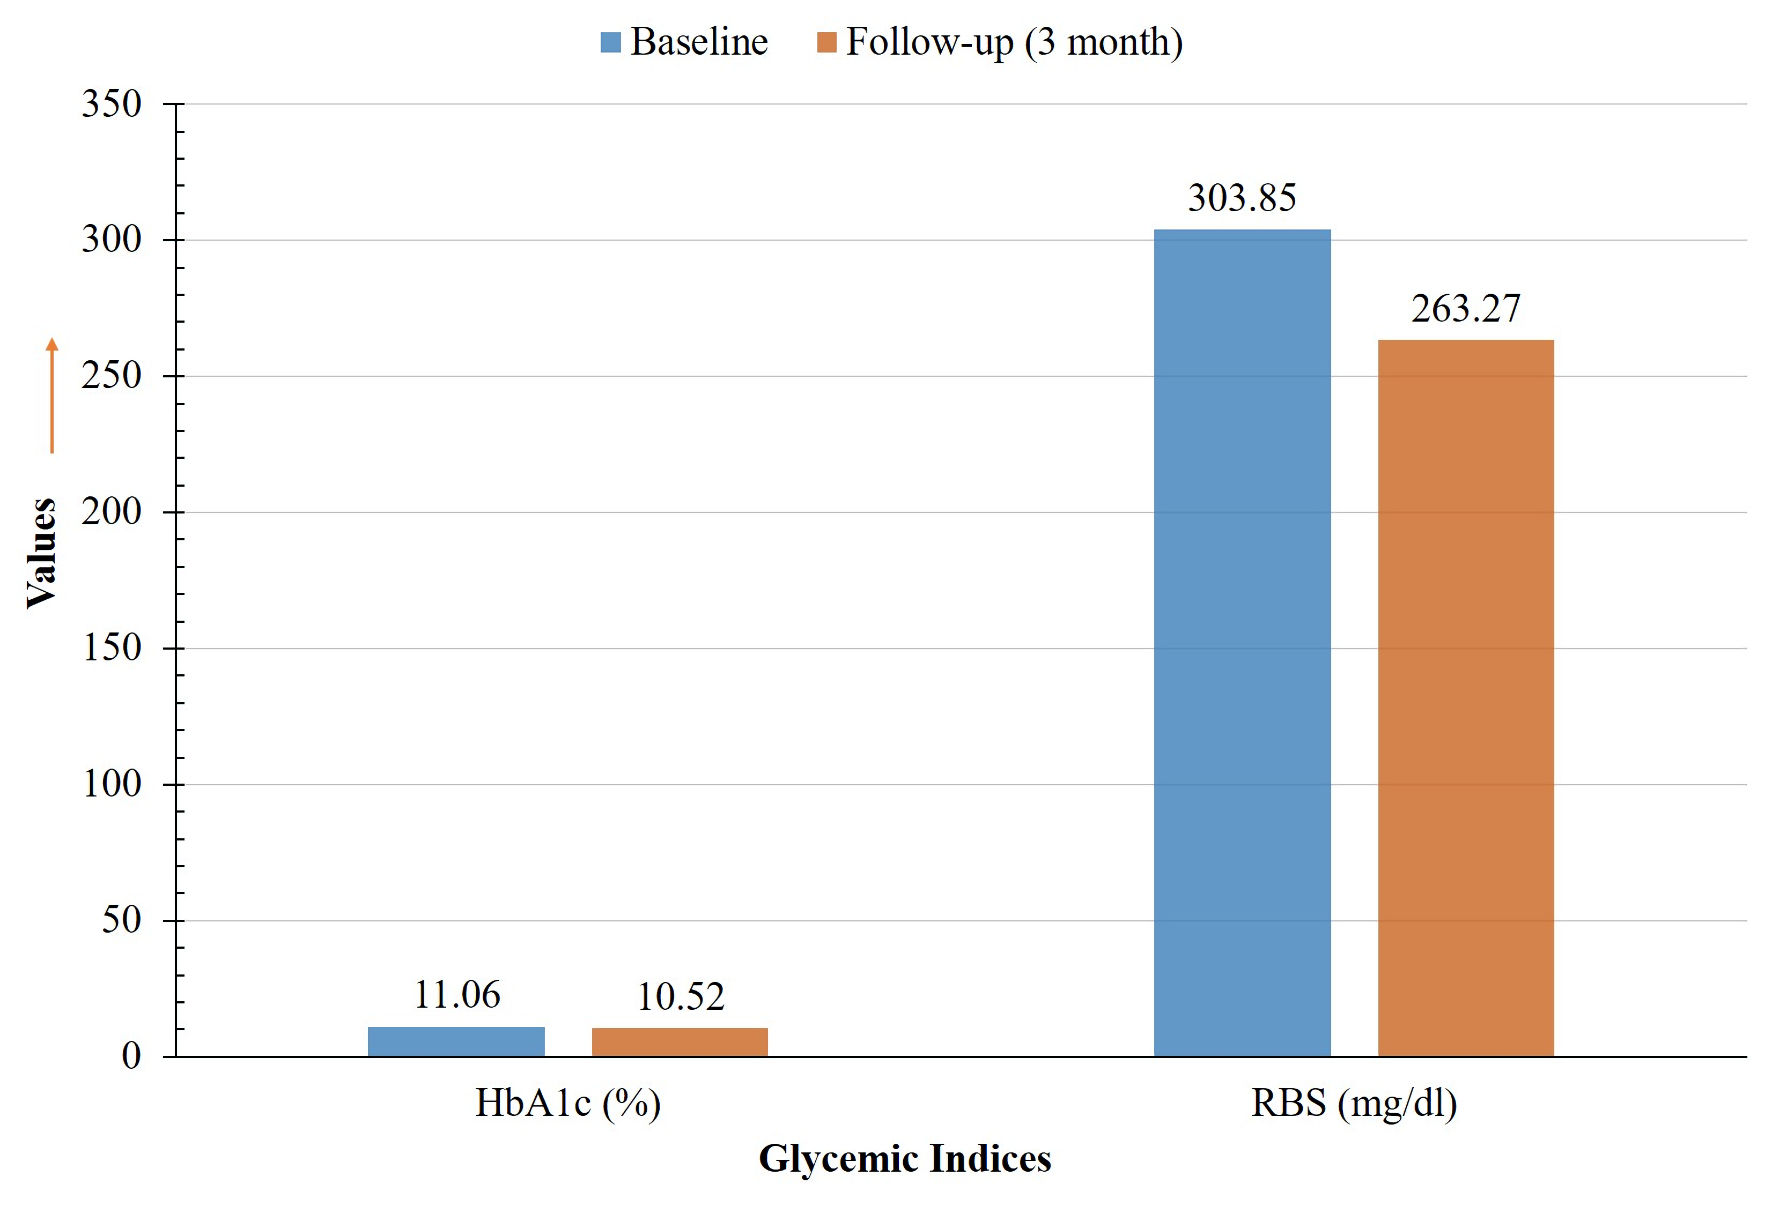
↓ Figure 1. Impact of structural counseling on
glycemic control. HRQoL: health-related quality of life; PCS: Physical Component Score; MCS: Mental
Component Score.
| Journal of Endocrinology and Metabolism, ISSN 1923-2861 print, 1923-287X online, Open Access |
| Article copyright, the authors; Journal compilation copyright, J Endocrinol Metab and Elmer Press Inc |
| Journal website https://jem.elmerpub.com |
Original Article
Volume 15, Number 5, December 2025, pages 191-201
Impact of Disease-Specific Counseling on Quality of Life and Glycemic Control in Different Types of Diabetes
Figures
Tables
| Variables | Total | Type 1 DM (30.0%) | Type 2 DM (54.00%) | Pancreatic DM (16.0%) | P value |
|---|---|---|---|---|---|
| All the values are presented as frequency (%) or mean and standard deviation (SD) otherwise stated. P value was considered significant at < 0.05. P values were calculated using Chi-square test/Fisher’s exact test for categorical variables, one-way ANOVA/Kruskal-Wallis test for continuous variables. *P ≤ 0.001. IQR: interquartile range; DM: diabetes mellitus; BMI: body mass index; ANOVA: analysis of variance. | |||||
| Age, mean ± SD | 42.56 ± 15.00 | 27.11 ± 7.27 | 52.01 ± 11.87 | 39.66 ± 8.71 | < 0.001* |
| Age (years), n (%) | |||||
| < 20 | 7 (4.7) | 7 (15.6) | 0 | 0 | |
| 21 - 35 | 43 (28.7) | 32 (71.1) | 5 (6.2) | 6 (25) | |
| 36 - 50 | 58 (38.7) | 6 (13.3) | 37 (45.7) | 15 (62.5) | < 0.001* |
| 51 - 65 | 28 (18.7) | 0 | 25 (30.9) | 3 (12.5) | |
| > 65 | 14 (9.3) | 0 | 14 (17.3) | 0 | |
| Gender, n (%) | |||||
| Male | 93 (62.0) | 15 (33.3) | 54 (66.7) | 24 (100) | < 0.001* |
| Female | 57 (38.0) | 30 (66.7) | 27 (33.3) | 0 | |
| Area of residence, n (%) | |||||
| Rural | 81 (54.0) | 27 (60) | 42 (51.9) | 12 (50) | 0.620 |
| Urban | 69 (46.0) | 18 (40) | 39 (48.1) | 12 (50) | |
| Addiction, n (%) | |||||
| Alcohol | 6 (4.0) | 0 | 3 (3.7) | 3 (12.5) | 0.010 |
| Smoking | 60 (40.0) | 12 (26.7) | 36 (44.4) | 12 (50) | |
| Tobacco | 84 (56.0) | 33 (73.3) | 42 (51.9) | 9 (37.5) | |
| Marital status, n (%) | |||||
| Married | 114 (76.0) | 24 (53.3) | 69 (85.2) | 21 (87.5) | < 0.001* |
| Unmarried | 24 (16.0) | 21 (46.7) | 0 | 3 (12.5) | |
| Widow/widower | 12 (8.0) | 0 | 12 (14.8) | 0 | |
| BMI category, (kg/m2) n (%) | |||||
| Underweight (< 18.5) | 31 (20.7) | 20 (44.4) | 3 (3.7) | 8 (33.3) | |
| Normal (18.5 - 22.9) | 49 (32.7) | 20 (44.4) | 17 (21.0) | 12 (50.0) | < 0.001* |
| Overweight (23 - 24.9) | 24 (16.0) | 4 (8.9) | 19 (23.5) | 1 (4.2) | |
| Obese class I (25 - 29.9) | 37 (24.7) | 1 (2.2) | 33 (40.7) | 3 (12.5) | |
| Obese class II (> 30) | 9 (6.0) | 0 | 9 (11.1) | 0 | |
| Duration of DM (months), median (IQR) | 48 (24 - 84) | 66 (24 - 108) | 48 (36 - 72) | 31 (15 - 48) | 0.001* |
| Domain | Baseline | At follow-up (3 month) | P value |
|---|---|---|---|
| Data are presented as mean ± SD. P values were calculated using paired t-test. *P < 0.001. P value was considered significant at < 0.05. HRQoL: health-related quality of life; PCS: Physical Component Score; MCS: Mental Component Score; SD: standard deviation. | |||
| Physical function | 53.80 ± 30.24 | 57.40 ± 29.17 | < 0.001* |
| Role-physical | 46.00 ± 43.55 | 56.50 ± 42.81 | < 0.001* |
| Body pain | 41.16 ± 28.21 | 47.22 ± 29.82 | < 0.001* |
| General health | 38.42 ± 27.05 | 41.16 ± 26.99 | < 0.001* |
| Vitality | 35.60 ± 26.41 | 38.30 ± 25.30 | < 0.001* |
| Social functioning | 49.00 ± 22.41 | 56.00 ± 22.19 | < 0.001* |
| Role emotional | 62.67 ± 39.93 | 70.00 ± 39.71 | < 0.001* |
| Mental health | 48.56 ± 20.07 | 54.32 ± 17.77 | < 0.001* |
| PCS | 37.40 ± 12.77 | 39.36 ± 13.33 | < 0.001* |
| MCS | 29.11 ± 13.30 | 33.09 ± 12.71 | < 0.001* |
| Composite score | T1DM (mean ± SD) | T2DM (mean ± SD) | Pancreatic DM (mean ± SD) | P value |
|---|---|---|---|---|
| Values are presented as mean ± SD. P values were calculated using one-way ANOVA/Kruskal-Wallis test. P value was considered significant at < 0.05 *P < 0.05. DM: diabetes mellitus; T1DM: type 1 diabetes mellitus; T2DM: type 2 diabetes mellitus; HRQoL: health-related quality of life; PCS: Physical Component Score; MCS: Mental Component Score; SD: standard deviation; ANOVA: analysis of variance. | ||||
| Physical function | 67.33 ± 26.68 | 51.85 ± 31.35 | 35.00 ± 20.11 | < 0.001* |
| Role physical | 48.33 ± 42.77 | 44.44 ± 44.02 | 46.88 ± 45.03 | 0.887 |
| Bodily pain | 41.20 ± 29.95 | 46.67 ± 25.61 | 22.50 ± 26.23 | 0.001* |
| General health | 45.27 ± 31.20 | 40.56 ± 25.16 | 18.38 ± 12.24 | < 0.001* |
| Vitality | 44.67 ± 30.48 | 35.37 ± 24.11 | 19.38 ± 16.83 | 0.001* |
| Social functioning | 55.00 ± 20.54 | 51.39 ± 22.53 | 29.69 ± 14.19 | < 0.001* |
| Role emotional | 66.67 ± 36.93 | 61.73 ± 38.41 | 58.33 ± 50.36 | 0.680 |
| Mental health | 55.47 ± 24.31 | 48.00 ± 18.30 | 37.50 ± 9.57 | 0.001* |
| PCS | 39.52 ± 13.25 | 37.97 ± 12.91 | 31.51 ± 9.76 | 0.038* |
| MCS | 33.13 ± 15.07 | 28.68 ± 12.35 | 23.01 ± 10.51 | 0.009* |
| Composite score | T1DM (mean ± SD) | T2DM (mean ± SD) | Pancreatic DM (mean ± SD) | P value |
|---|---|---|---|---|
| Values are presented as mean ± SD. P values were calculated using one-way ANOVA/Kruskal-Wallis test. P value was considered significant at < 0.05. *P < 0.05. DM: diabetes mellitus; T1DM: type 1 diabetes mellitus; T2DM: type 2 diabetes mellitus; HRQoL: health-related quality of life; PCS: Physical Component Score; MCS: Mental Component Score; SD: standard deviation; ANOVA: analysis of variance. | ||||
| Physical function | 68.00 ± 27.12 | 56.67 ± 30.89 | 40.00 ± 15.74 | 0.001* |
| Role physical | 48.33 ± 42.77 | 59.26 ± 42.84 | 62.50 ± 42.35 | 0.296 |
| Bodily pain | 45.60 ± 31.32 | 54.48 ± 27.07 | 25.75 ± 25.73 | < 0.001* |
| General health | 45.80 ± 31.93 | 45.52 ± 23.93 | 17.75 ± 9.78 | < 0.001* |
| Vitality | 44.00 ± 29.78 | 40.00 ± 23.12 | 21.88 ± 15.31 | 0.001* |
| Social functioning | 62.50 ± 17.88 | 58.80 ± 20.49 | 34.38 ± 22.80 | < 0.001* |
| Role emotional | 68.89 ± 37.87 | 69.14 ± 38.65 | 75.00 ± 47.40 | 0.799 |
| Mental health | 62.93 ± 17.88 | 53.04 ± 16.85 | 42.50 ± 12.25 | < 0.001* |
| PCS | 39.00 ± 14.66 | 41.41 ± 12.94 | 33.15 ± 10.15 | 0.027* |
| MCS | 36.86 ± 13.65 | 32.24 ± 12.20 | 28.89 ± 11.12 | 0.030* |
| Parameter | T1DM (mean ± SD) | T2DM (mean ± SD) | Pancreatic DM (mean ± SD) | Total (mean ± SD) | P value |
|---|---|---|---|---|---|
| P values were calculated using one-way ANOVA for between-group comparison, paired t-test for within-group comparison. P value was considered significant at < 0.05. *P < 0.01. DM: diabetes mellitus; T1DM: type 1 diabetes mellitus; T2DM: type 2 diabetes mellitus; HbA1c: glycated hemoglobin; RBS: random blood sugar; SD: standard deviation; ANOVA: analysis of variance. | |||||
| HbA1c, baseline | 11.07 ± 2.23 | 10.67 ± 2.20 | 12.35 ± 1.11 | 11.06 ± 2.15 | 0.003* |
| HbA1c, follow-up | 10.76 ± 2.13 | 9.93 ± 2.83 | 12.05 ± 1.37 | 10.52 ± 2.55 | 0.001* |
| RBS, baseline | 285.89 ± 23.34 | 314.27 ± 30.02 | 302.33 ± 23.90 | 303.85 ± 29.83 | < 0.001* |
| RBS, follow-up | 262.04 ± 61.29 | 253.32 ± 61.88 | 299.17 ± 39.16 | 263.27 ± 60.53 | 0.004* |