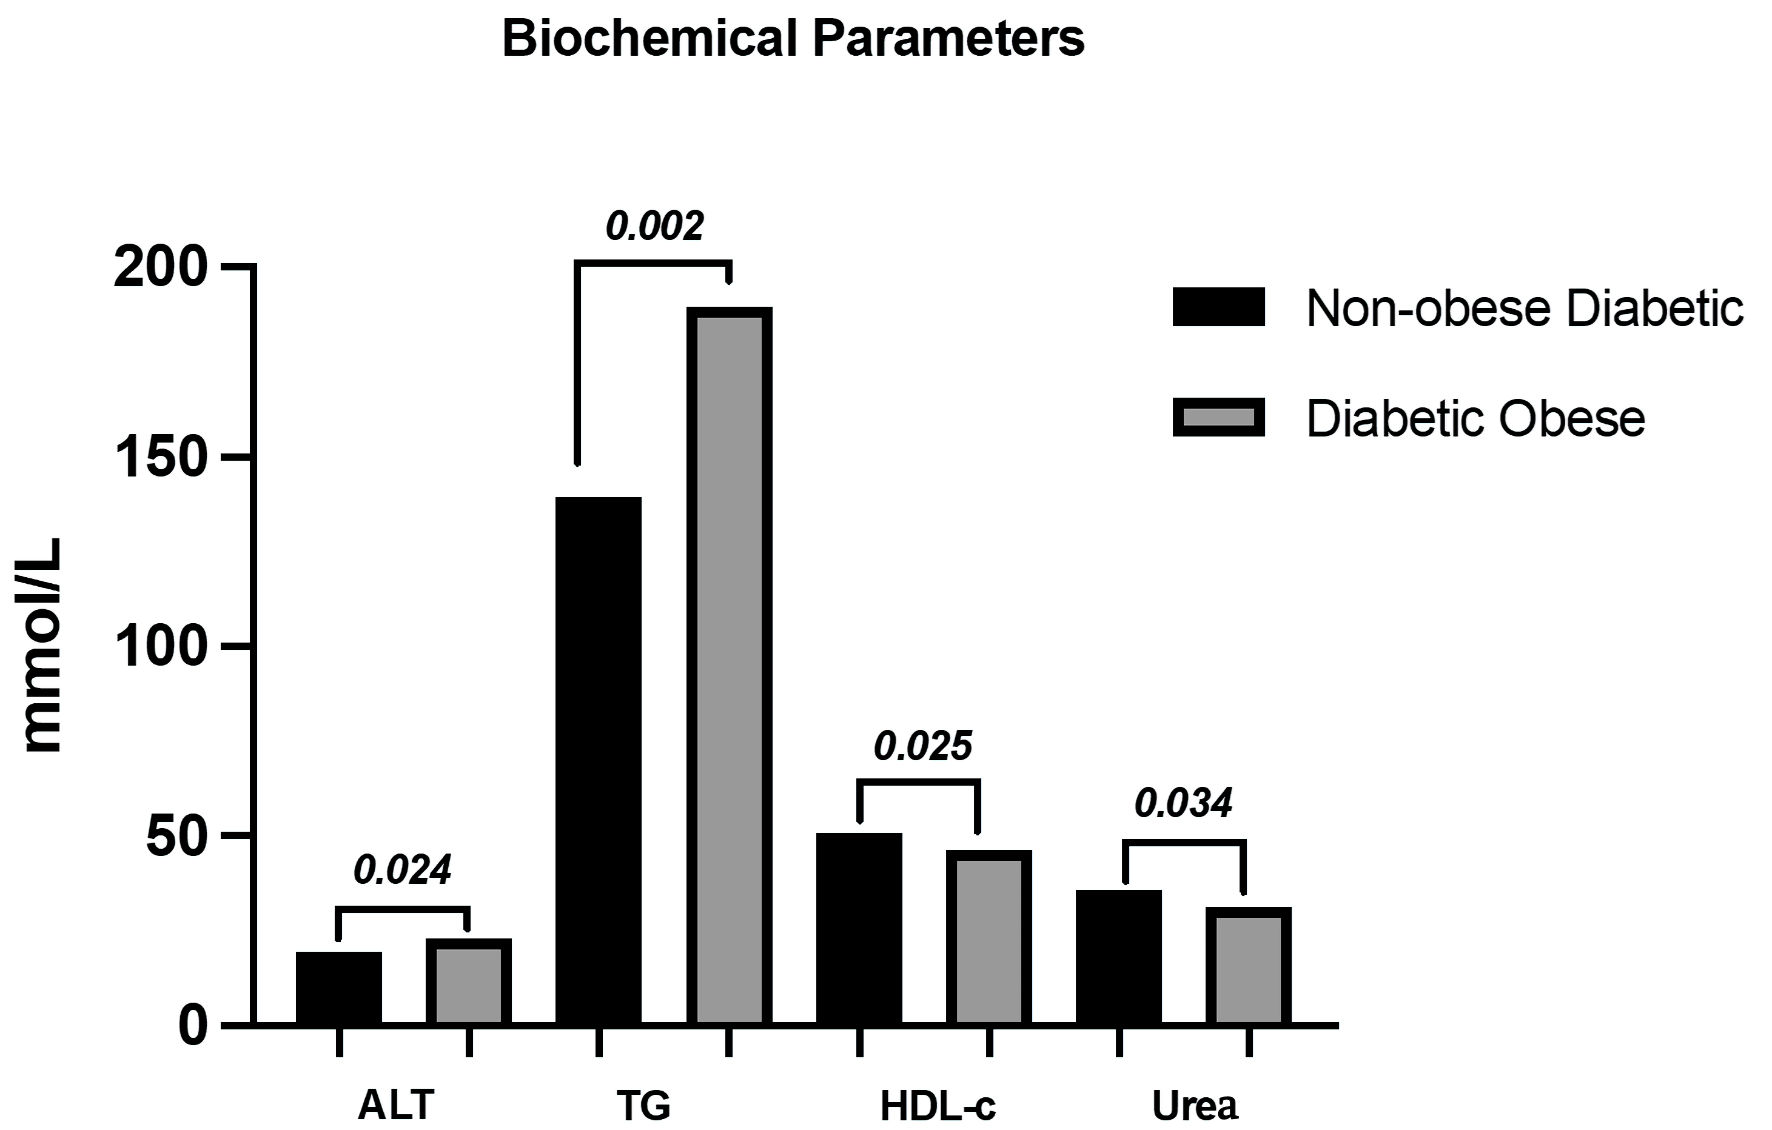
↓ Figure 1. Biochemical parameters measured in
the study groups. ALT: alanine aminotransferase; TG: triglyceride; HDL-C: high-density lipoprotein
cholesterol.
| Journal of Endocrinology and Metabolism, ISSN 1923-2861 print, 1923-287X online, Open Access |
| Article copyright, the authors; Journal compilation copyright, J Endocrinol Metab and Elmer Press Inc |
| Journal website https://jem.elmerpub.com |
Original Article
Volume 16, Number 1, February 2026, pages 29-37
Investigation of GHRL, RETN, ADIPOQ, NPY and MC4R Gene Polymorphisms in Obese and Non-Obese Patients With Diabetes
Figures
Tables
| SNP | Forward primer (5'–3') | Forward/reverse primer (5'–3') | Reverse primer (5'–3') |
|---|---|---|---|
| PCR: polymerase chain reaction; SNP: single-nucleotide polymorphism. | |||
| rs1862513 | GGGCATTTGGGTATGAATGTG | TTCCAACAGGGCCTCCG | TTCCAACAGGGCCTCCA |
| rs4684677 | TGGCTGTGCTGCTGGTACT | TGGCTGTGCTGCTGGTACC | AGATGGTGAGTGGGAAGGTG |
| rs17782313 | GCTTTTCTTGTCATTTCCATCA | GCTTTTCTTGTCATTTCCATCT | TAACAAACAGCCCCCAAGTC |
| rs16147 | TCAGCAAACTGGGGGAATAG | CCTGCCAACAGGACTACCAA | CCTGCCAACAGGACTACCAT |
| rs2241766 | GCTATTAGCTCTGCCCGGT | GCTATTAGCTCTGCCCGGG | TGAGGGTGAAGATGGGAAAG |
| Non-obese diabetic | Obese diabetic | P value | |
|---|---|---|---|
| The values expressed as X ± SE in the table were analyzed using independent samples t-tests (X: mean; SE: standard error). P represents the significance of value between the groups. *P < 0.05. ALT: alanine aminotransferase; AST: aspartate aminotransferase; TC: total cholesterol; TG: triglyceride; HDL-C: high-density lipoprotein cholesterol; LDL-C: low-density lipoprotein cholesterol; HbA1c: hemoglobin A1c; BMI: body mass index. | |||
| Age | 50.86 ± 1.51 | 55.89 ± 1.02 | 0.006* |
| Urea | 31.37 ± 0.98 | 35.79 ± 1.82 | 0.034* |
| Creatinine | 0.78 ± 0.02 | 0.85 ± 0.04 | 0.08 |
| ALT | 19.60 ± 1.01 | 23.27 ± 1.25 | 0.024* |
| AST | 18.10 ± 0.66 | 20.03 ± 0.84 | 0.075 |
| TC | 200.50 ± 5.63 | 211.35 ± 8.26 | 0.281 |
| TG | 139.64 ± 8.53 | 189.82 ± 13.42 | 0.002* |
| HDL-c | 50.89 ± 1.76 | 46.29 ± 1.02 | 0.025* |
| LDL-c | 122.01 ± 4.58 | 121.87 ± 3.33 | 0.968 |
| Glucose | 163.98 ± 6.81 | 181.78 ± 6.71 | 0.064 |
| HbA1c | 8.14 ± 0.22 | 8.33 ± 0.19 | 0.514 |
| BMI | 24.80 ± 0.31 | 36.00 ± 0.45 | < 0.0001* |
| Genotypes/alleles | Obese diabetic, n (%) | Non-obese diabetic, n (%) | P value |
|---|---|---|---|
| P represents the significance of value between the groups. *P < 0.05. | |||
| RETN rs1862513 | |||
| CC | 46 (46.5%) | 43 (43.4%) | 0.005* |
| CG | 46 (46.5%) | 33 (33.3%) | |
| GG | 7 (7.1%) | 23 (23.2%) | |
| C allele | 138 (69.7%) | 119 (60.1%) | 0.002* |
| G allele | 60 (30.3%) | 79 (39.9%) | 0.67 |
| GHRL rs4684677 | |||
| TT | 0 (0%) | 2 (2%) | 0.36 |
| TA | 5 (5.1%) | 5 (5.1%) | |
| AA | 94 (94.9%) | 92 (92.9%) | |
| T allele | 5 (2.5%) | 9 (4.5%) | 0.551 |
| A allele | 193 (97.5%) | 189 (95.5%) | 0.155 |
| MC4R rs17782313 | |||
| TT | 7 (7.1%) | 20 (20.2%) | 0.008* |
| TC | 83 (83.8%) | 65 (65.7%) | |
| CC | 9 (9.1%) | 14 (14.1%) | |
| T allele | 97 (49%) | 105 (53 %) | 0.267 |
| C allele | 101 (51%) | 93 (47%) | 0.007* |
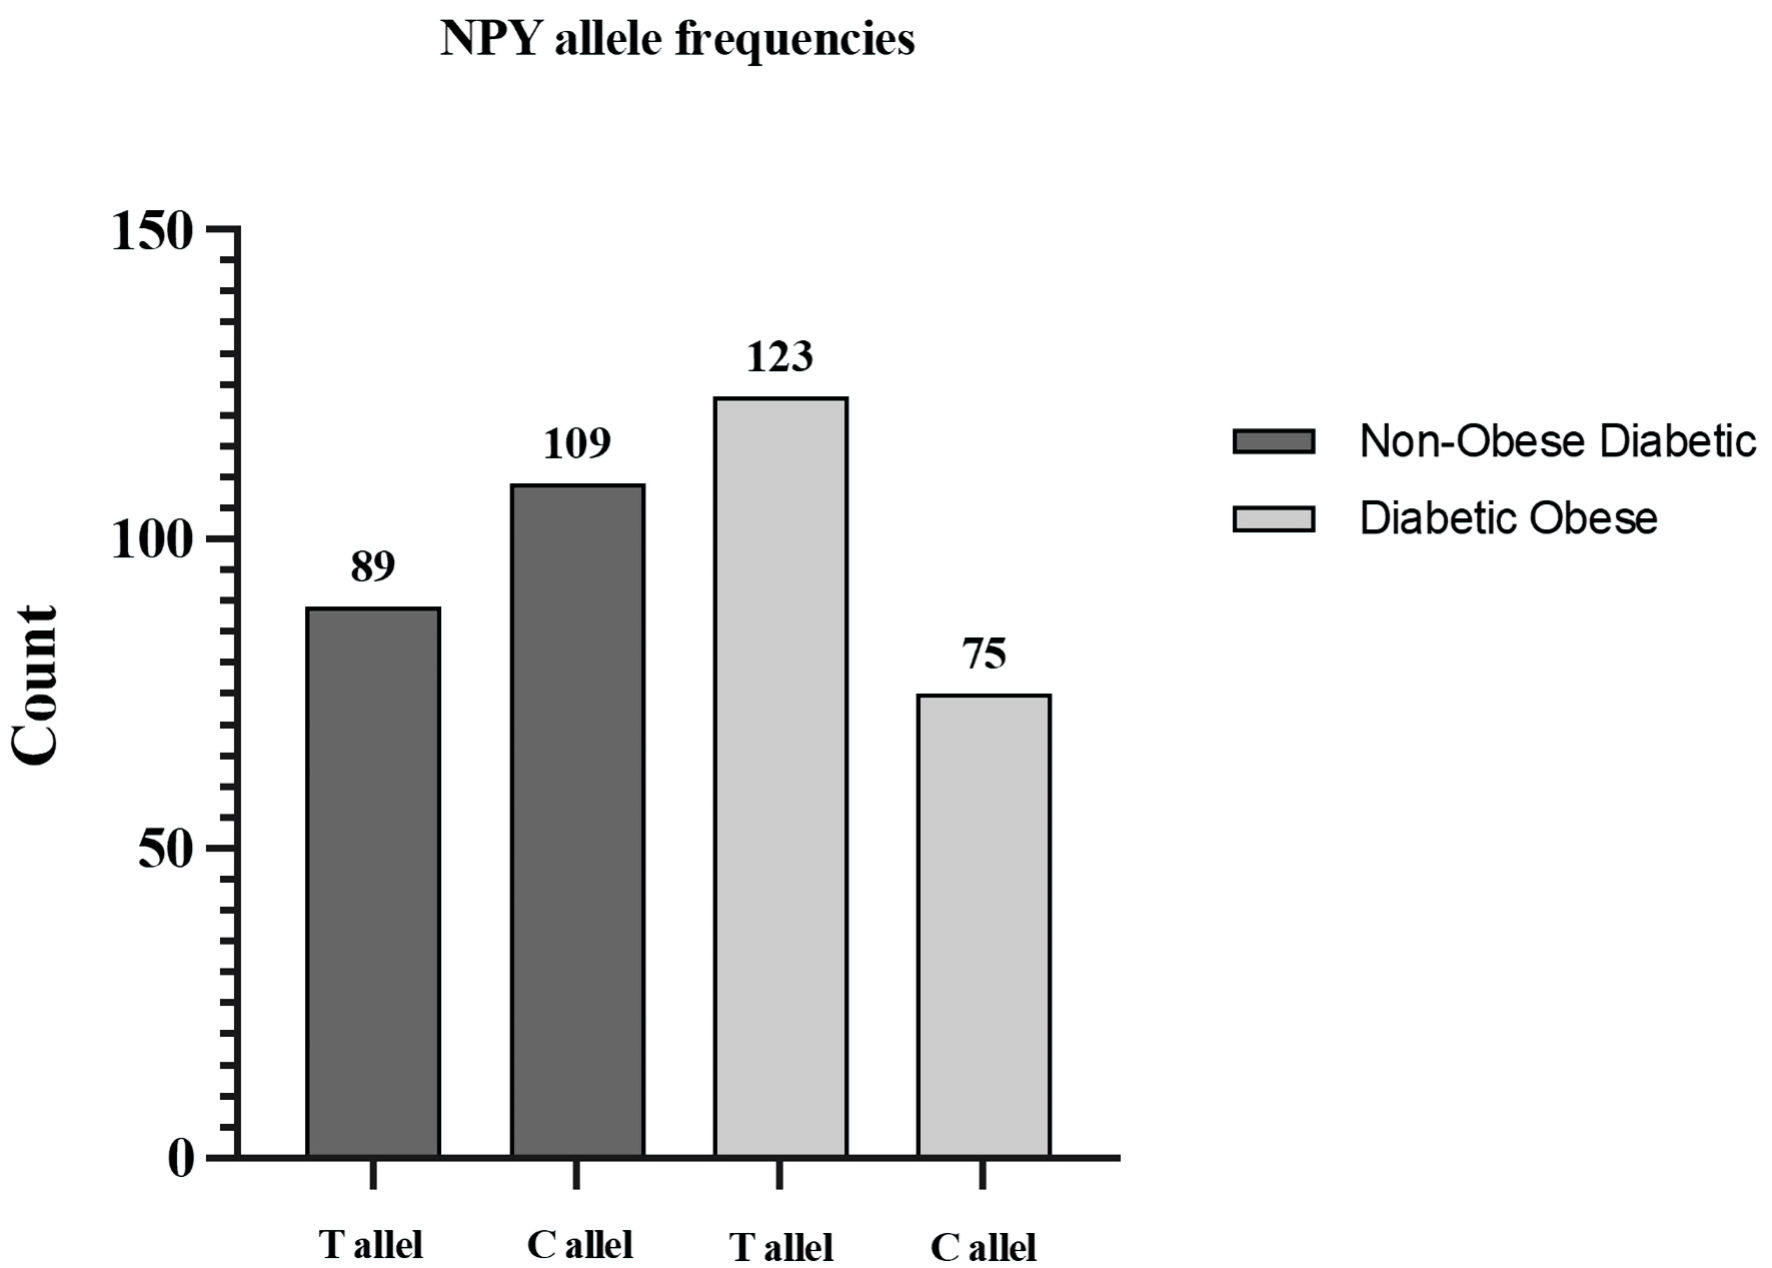
| NPY rs16147 | |||
| TT | 26 (26.3%) | 11 (11.1%) | < 0.0001* |
| TC | 71 (71.7%) | 67 (67.7%) | |
| CC | 2 (2%) | 21 (21.2%) | |
| T allele | 123 (62.1%) | 89 (45%) | < 0.0001* |
| C allele | 75 (37.9%) | 109 (55%) | 0.006* |
| ADIPOQ rs2241766 | |||
| TT | 76 (76.8%) | 78 (78.8%) | 0.1 |
| TG | 10 (10.1%) | 3 (3%) | |
| GG | 13 (13.1) | 18 (18.2%) | |
| T allele | 162 (81.8%) | 159 (80.3%) | 0.328 |
| G allele | 36 (18.2%) | 39 (19.7%) | 0.732 |