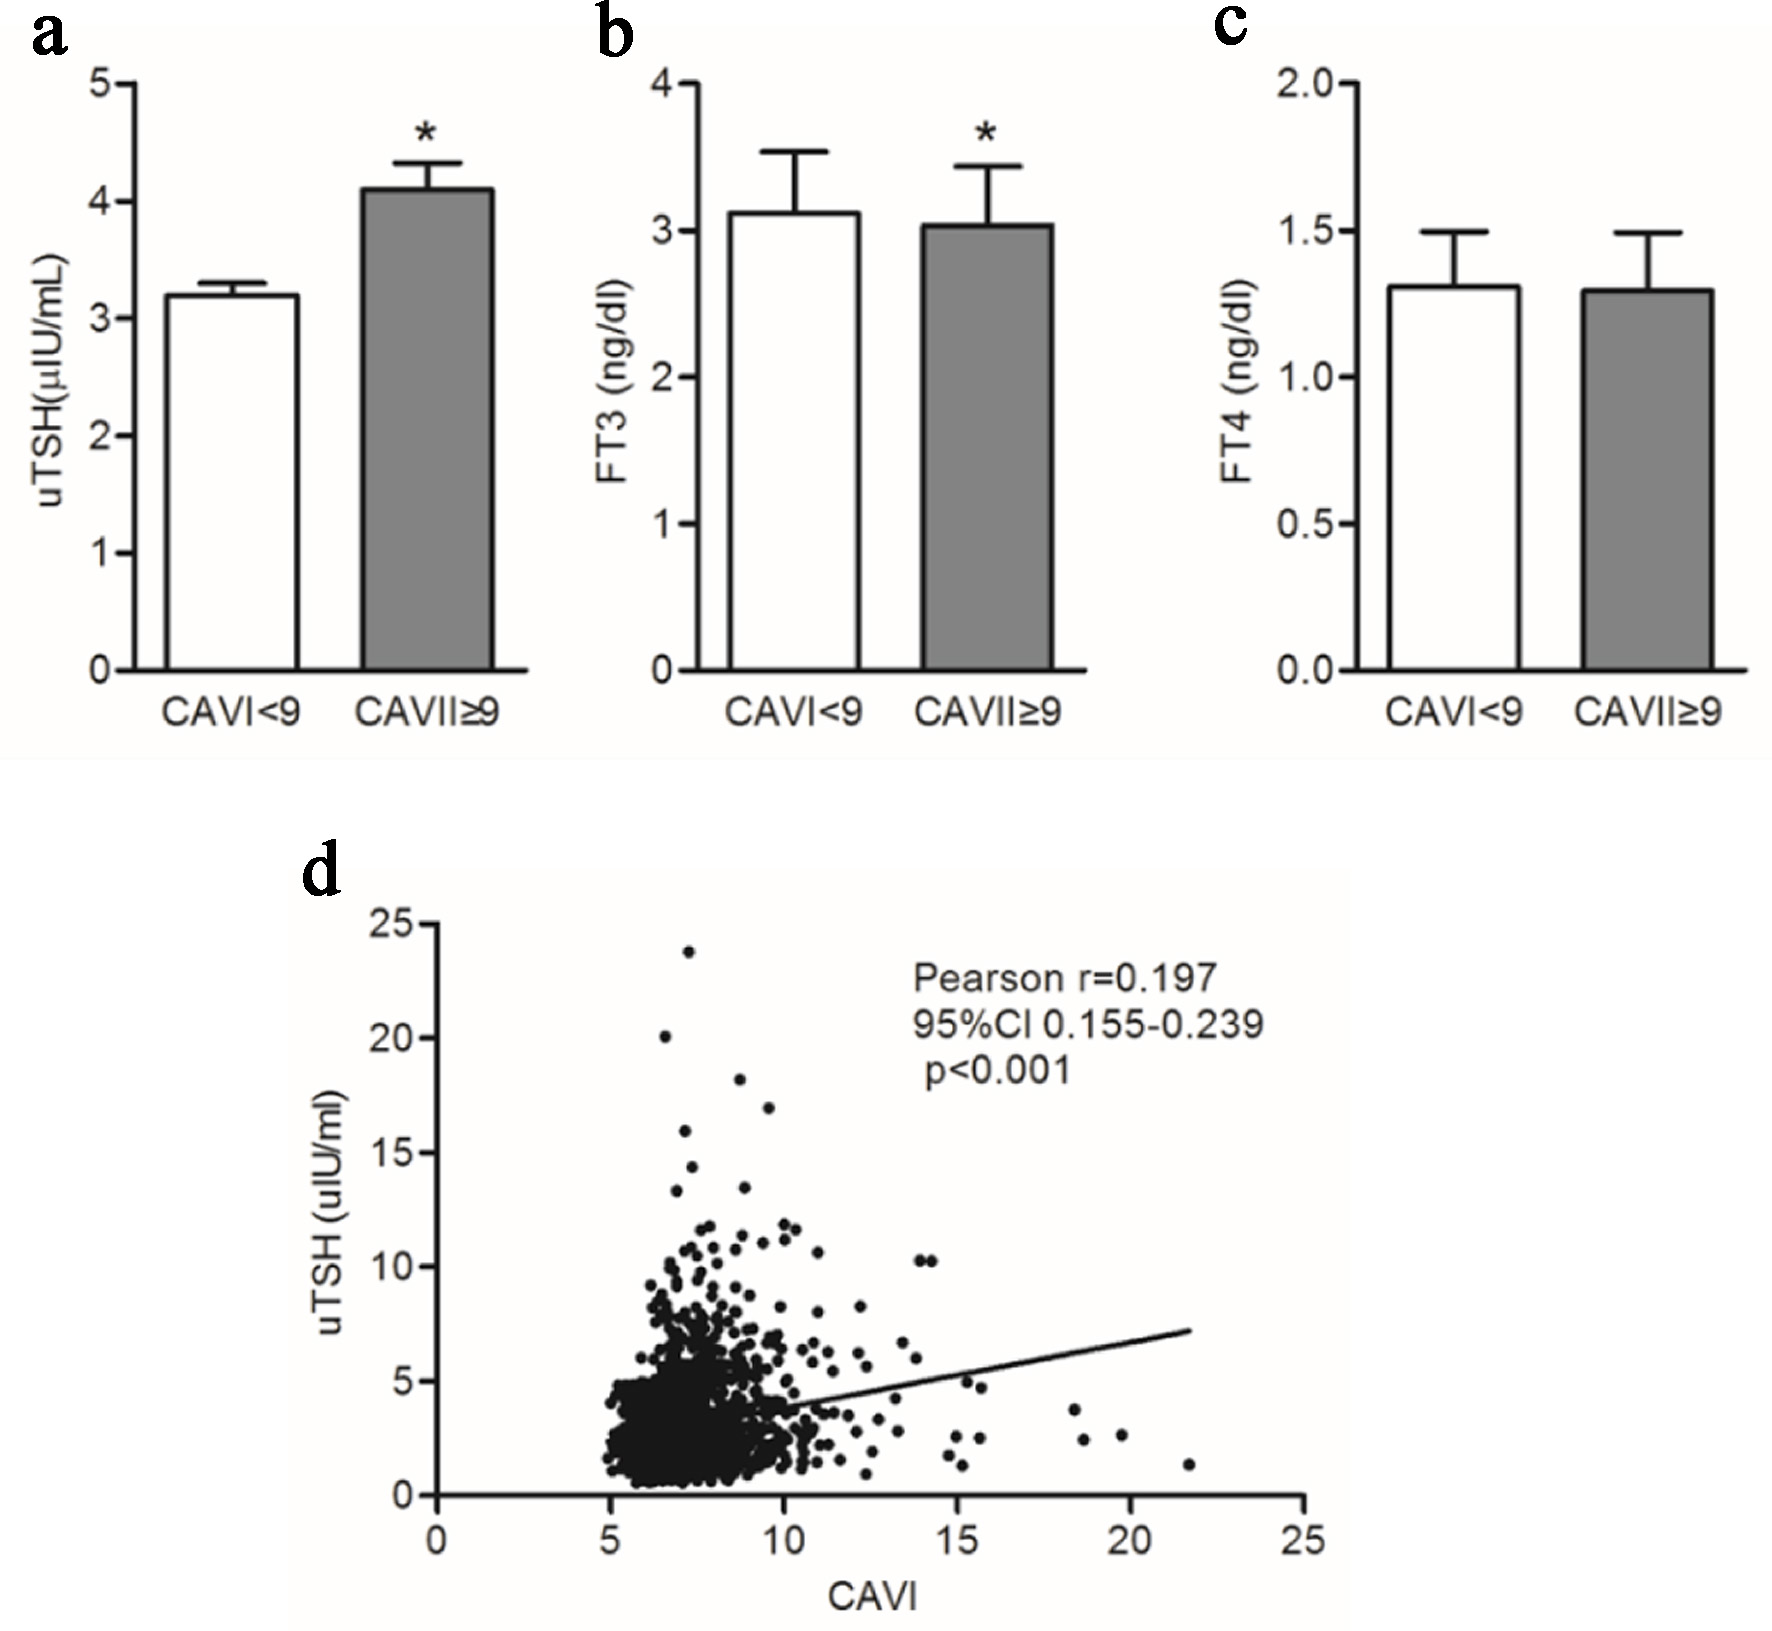
| Journal of Endocrinology and Metabolism, ISSN 1923-2861 print, 1923-287X online, Open Access |
| Article copyright, the authors; Journal compilation copyright, J Endocrinol Metab and Elmer Press Inc |
| Journal website https://jem.elmerpub.com |
Original Article
Volume 16, Number 1, February 2026, pages 22-28
Relationship Between Subclinical Hypothyroidism and Cardio-Ankle Vascular Index: A Cross-Sectional Study
Figures


Tables
| Indicators | Control (n = 1,749) | SCH (n = 247) | P value |
|---|---|---|---|
| BMI: body mass index; BMR: basal metabolic rate; DBP: diastolic blood pressure; HR: heart rate; SBP: systolic blood pressure; SCH: subclinical hypothyroidism; WC: waist circumference. | |||
| Female (%) | 1,011 (57.8) | 139 (56.3) | 0.680 |
| Age (years) | 48.32 ± 10.19 | 48.41 ± 13.75 | 0.654 |
| Height (cm) | 164.80 ± 7.58 | 164.10 ± 8.28 | 0.131 |
| Weight (kg) | 64.83 ± 11.58 | 66.60 ± 12.38 | 0.043 |
| BMI (kg/m2) | 23.69 ± 3.35 | 24.22 ± 3.23 | 0.034 |
| WC (cm) | 81.72 ± 10.04 | 83.81 ± 9.88 | 0.004 |
| SBP (mm Hg) | 123.2 ± 17.92 | 125.2 ± 17.49 | 0.077 |
| DBP (mm Hg) | 76.57 ±12.24 | 76.25 ± 11.20 | 0.915 |
| HR (bpm) | 79.75 ± 11.92 | 75.19 ± 10.95 | < 0.001 |
| BMR | 1,507 ± 212.2 | 1,359 ± 243.2 | < 0.001 |
| Fat (%) | 22.51 ± 4.88 | 27.94 ± 6.55 | < 0.001 |
| Fat (kg) | 16.18 ± 4.91 | 22.43 ± 4.06 | < 0.001 |
| Indicators | Control | SCH | P value |
|---|---|---|---|
| apoA: apolipoprotein A; apoB: apolipoprotein B; FBG: fasting blood glucose; HDL: high-density lipoprotein; hsCRP: hypersensitivity C-reactive protein; LDL: low-density lipoprotein; SCH: subclinical hypothyroidism; TC: total cholesterol; TG: triglycerides. | |||
| TC (mmol/L) | 4.98 ± 0.92 | 5.43 ± 1.01 | < 0.001 |
| TG (mmol/L) | 1.87 ± 1.49 | 2.19 ± 1.59 | 0.001 |
| HDL (mmol/L) | 1.39 ± 0.36 | 1.36 ± 0.36 | 0.311 |
| LDL (mmol/L) | 3.07 ± 0.83 | 3.31 ± 0.89 | 0.002 |
| apoA (g/L) | 1.55 ± 0.25 | 1.53 ± 0.25 | 0.582 |
| apoB (g/L) | 0.99 ± 0.23 | 1.09 ± 0.25 | < 0.001 |
| apoB/apoA | 0.66 ± 0.19 | 0.73 ± 0.21 | 0.003 |
| FBG (mmol/L) | 5.55 ± 1.25 | 5.48 ± 1.10 | 0.095 |
| hsCRP (mg/L) | 0.83 ± 1.56 | 1.33 ± 2.78 | 0.051 |
| Indicators | Control (n = 1,749) | SCH (n = 247) | P value |
|---|---|---|---|
| ABI: ankle-brachial index; baPWV: brachial-ankle pulse wave velocity; CAVI: cardio-ankle vascular index; SCH: subclinical hypothyroidism. | |||
| CAVI | 7.04 ± 1.31 | 7.93 ± 1.38 | < 0.001 |
| CAVI ≥ 9, n (%) | 98 (5.60) | 37 (14.98) | 0.004 |
| ABI | 1.11 ± 0.08 | 1.22 ± 0.08 | < 0.001 |
| ABI ≥ 1.3, n (%) | 12 (0.69) | 5 (2.02) | 0.049 |
| baPWV (cm/s) | 1,346 ± 279.8 | 1,418 ± 302.5 | 0.003 |
| baPWV ≥ 1,800, n (%) | 101 (5.77) | 26 (10.53) | 0.008 |