Journal of Endocrinology and Metabolism, ISSN 1923-2861 print, 1923-287X online, Open Access
Article copyright, the authors; Journal compilation copyright, J Endocrinol Metab and Elmer Press Inc
Journal website https://jem.elmerpub.com

Original Article

Volume 16, Number 2, April 2026, pages 118-127


Neuroprotective and Neurodegenerative Markers in the Early Detection of Peripheral Neuropathy in Type 2 Diabetes Patients

Figures

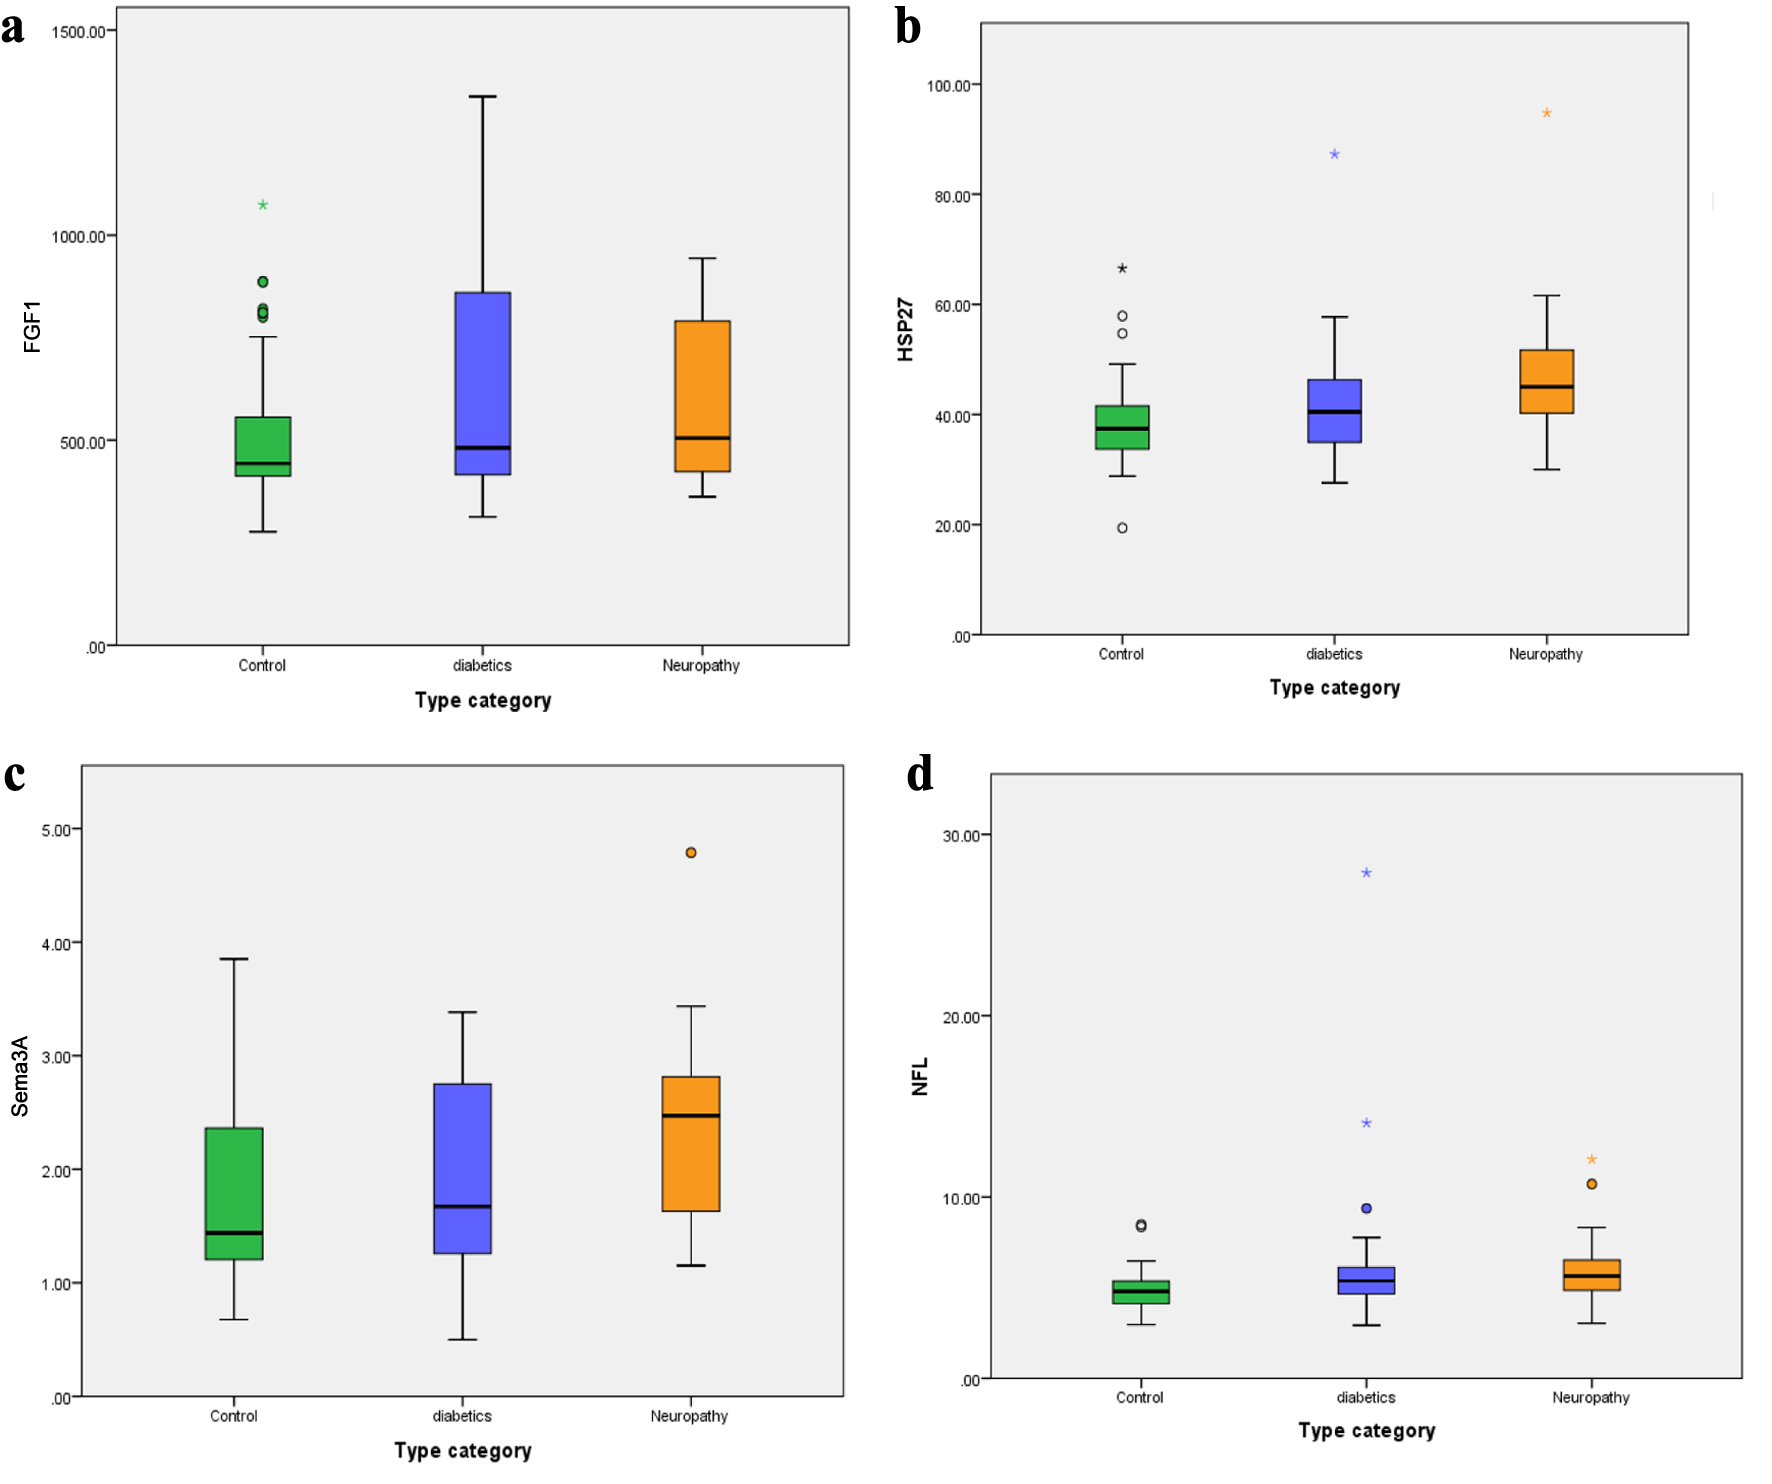
↓  Figure 1. Box-whisker plots of serum (a) fibroblast growth factor 1 (FGF1), (b) heat shock protein 27 (HSP27), (c) semaphorin3A (Sema3A), and (d) nerve filament light chain (NFL) levels in diabetic neuropathy, diabetic patients, and control groups.
Figure 1.
↓  Figure 2. Receiver operating characteristic (ROC) analyses for fibroblast growth factor 1 (FGF1), heat shock protein 27 (HSP27), semaphorin3A (Sema3A), and nerve filament light chain (NFL).
Figure 2.

Tables

↓  Table 1. Clinical Characteristic Feature
 
VariablePatients with DPNPatients with DWNControl
DPN: diabetic peripheral neuropathy; DWN: diabetic without neuropathy; SD: standard deviation.
Age, years (mean ± SD)54.04 ± 8.34547.44 ± 6.36444.51 ± 6.291
Weight, kg (mean ± SD)83.56 ± 14.99585.31 ± 11.55487.80 ± 13.069
Height, cm (mean ± SD)168.33 ± 9.283168.58 ± 7.911175.87 ± 6.897
Duration of diabetes mellitus, years5.32 ± 6.5613.04 ± 2.518
HbA1c, % (mmol/mol) (mean ± SD)9.3±1.9% (78 ± 21)7.7±1.6% (60 ± 17)
Smoking
  Yes12 (26.7%)10 (20.8%)24 (53.3%)
  No33 (73.3%)38 (79.2%)21 (46.7%)
Pain sensation
  Yes7 (15.6%)
  No38 (84.8%)48 (100%)45 (100%)
Weakness
  Yes9 (20%)
  No36 (80%)48 (100%)45 (100%)
Numbness
  Yes40 (88.9%)
  No5 (11.1%)48 (100%)45 (100%)
Burning sensation
  Yes25 (55.6%)
  No20 (44.4%)48 (100%)45 (100%)
Family history
  Yes31 (68.9%)23 (47.9%)
  No14 (31.1%)25 (52.1%)45 (100%)
Education
  Primary27 (60%)18 (37.5%)12 (26.7%)
  Secondary15 (33.1%)22 (45.8%)19 (42.3%)
  Diploma1 (2.3%)3 (6.3%)8 (17.8%)
  Bachelor2 (4.6%)5 (10.4%)6 (13.2%)
Severity of neuropathy
  Mild15 (37.7)
  Moderate to severe30 (62.3%)
Body mass index
  Normal11.1%8.3%17.8%
  Overweight40%52.1%48.9%
  Obese class I44.4%25%28.9%
  Obese class II4.5%14.6%4.4%


↓  Table 2. Concentration of FGF1, HSP27, Sema3, and NFL in DPN and Control Groups
 
ParametersPatients with DPN, median (range)Control, median (range)P valueOR95% CI
Lower boundUpper bound
CI: confidence interval; DPN: diabetic peripheral neuropathy; FGF1: fibroblast growth factor 1; HSP27: heat shock protein 27; NFL: nerve filament light chain; OR: odd ratio; Sema3A: semaphorin3A.
FGF1, ng/mL505 (582)434 (797)0.3700.9980.9941.002
HSP27, ng/mL45 (64.77)37.42 (47.12)0.0031.1121.0361.194
Sema3A, ng/mL2.47 (3.64)1.43 (3.18)0.0343.2071.0949.395
NFL, ng/mL5.64 (9.04)4.79 (5.53)0.0291.5901.0482.41


↓  Table 3. Concentration of FGF1, HSP27, Sema3A, NFL in the DPN and DWN Groups
 
ParametersPatients with DPN, median (range)Patients with DWN, median (range)P valueOR95% CI
Lower boundUpper bound
CI: confidence interval; DPN: diabetic peripheral neuropathy; DWN: diabetic without neuropathy; FGF1: fibroblast growth factor 1; HSP27: heat shock protein 27; NFL: nerve filament light chain; OR: odd ratio; Sema3A: semaphorin3A.
FGF1, ng/mL505 (582)481.5 (1,025)0.6090.9900.9840.996
HSP27, ng/mL45 (64.77)40.45 (59.70)0.0161.0640.9821.152
Sema3A, ng/mL2.47 (3.64)1.66 (2.89)0.0271.9961.5172.074
NFL, ng/mL5.64 (9.04)5.37 (24.95)0.3600.8640.6251.195


↓  Table 4. Concentration of Parameters Under Study With Respect to Severity in Patients With DPN
 
ParametersDPN patientsP-value
Mild (N = 15), median (range)Moderate to severe (N = 30), median (range)
DPN: diabetic peripheral neuropathy; FGF1: fibroblast growth factor 1; HSP27: heat shock protein 27; N: number of samples; NFL: nerve filament light chain; Sema3A: semaphorin3A.
FGF1, ng/mL771 (544)475.5 (582)0.008
HSP27, ng/mL40.9 (25.61)47.12 (57.95)0.029
Sema3A, ng/mL2.62 (2.15)1.86 (3.64)0.198
NFL, ng/mL5.63 (4.7)5.79 (8.03)0.152


↓  Table 5. Associations Between the Parameters Under Study and Diabetic Neuropathy
 
ParametersβP-valueOR95% CI
Lower boundUpper bound
β coefficient (per unit increase in serum biomarker level; ng/mL). CI: confidence interval; FGF1: fibroblast growth factor 1; HSP27: heat shock protein 27; NFL: nerve filament light chain; OR: odd ratio; Sema3A: semaphorin3A.
FGF1, ng/mL−0.010< 0.0010.9900.9850.995
HSP27, ng/mL1.0520.1121.0530.9881.123
Sema3A, ng/mL3.007< 0.0016.2234.3279.512
NFL, ng/mL−0.0870.5300.9170.6991.203


↓  Table 6. Association Between Variables (Age, Duration, BMI) and Diabetic Neuropathy
 
VariablesβP-valueOR95% CI
LowerUpper
BMI: body mass index; CI: confidence interval; OR: odds ratio.
Age0.129< 0.0011.1371.0611.219
Duration0.589< 0.0011.8021.4302.270
BMI−0.0410.4320.9600.8671.063


↓  Table 7. Coordinates of ROC Curve for Serum FGF1, HSP27, Sema3A, and NFL
 
ParametersFGF1HSP27Sema3ANFL
AUC: area under the curve; CI: confidence interval; FGF1: fibroblast growth factor 1; HSP27: heat shock protein 27; NFL: nerve filament light chain; ROC: receiver operating characteristic; Sema3A: semaphorin3A.
AUC0.4690.7460.7830.625
Cutoff value476.540.1131.4934.919
Sensitivity60%75.6%80%73.3%
Specificity56.3%54.4%60%68.8%
95% CI0.350–0.5880.534–0.7580.521–7460.437–674
Accuracy57.5%61.3%66.5%70.3%