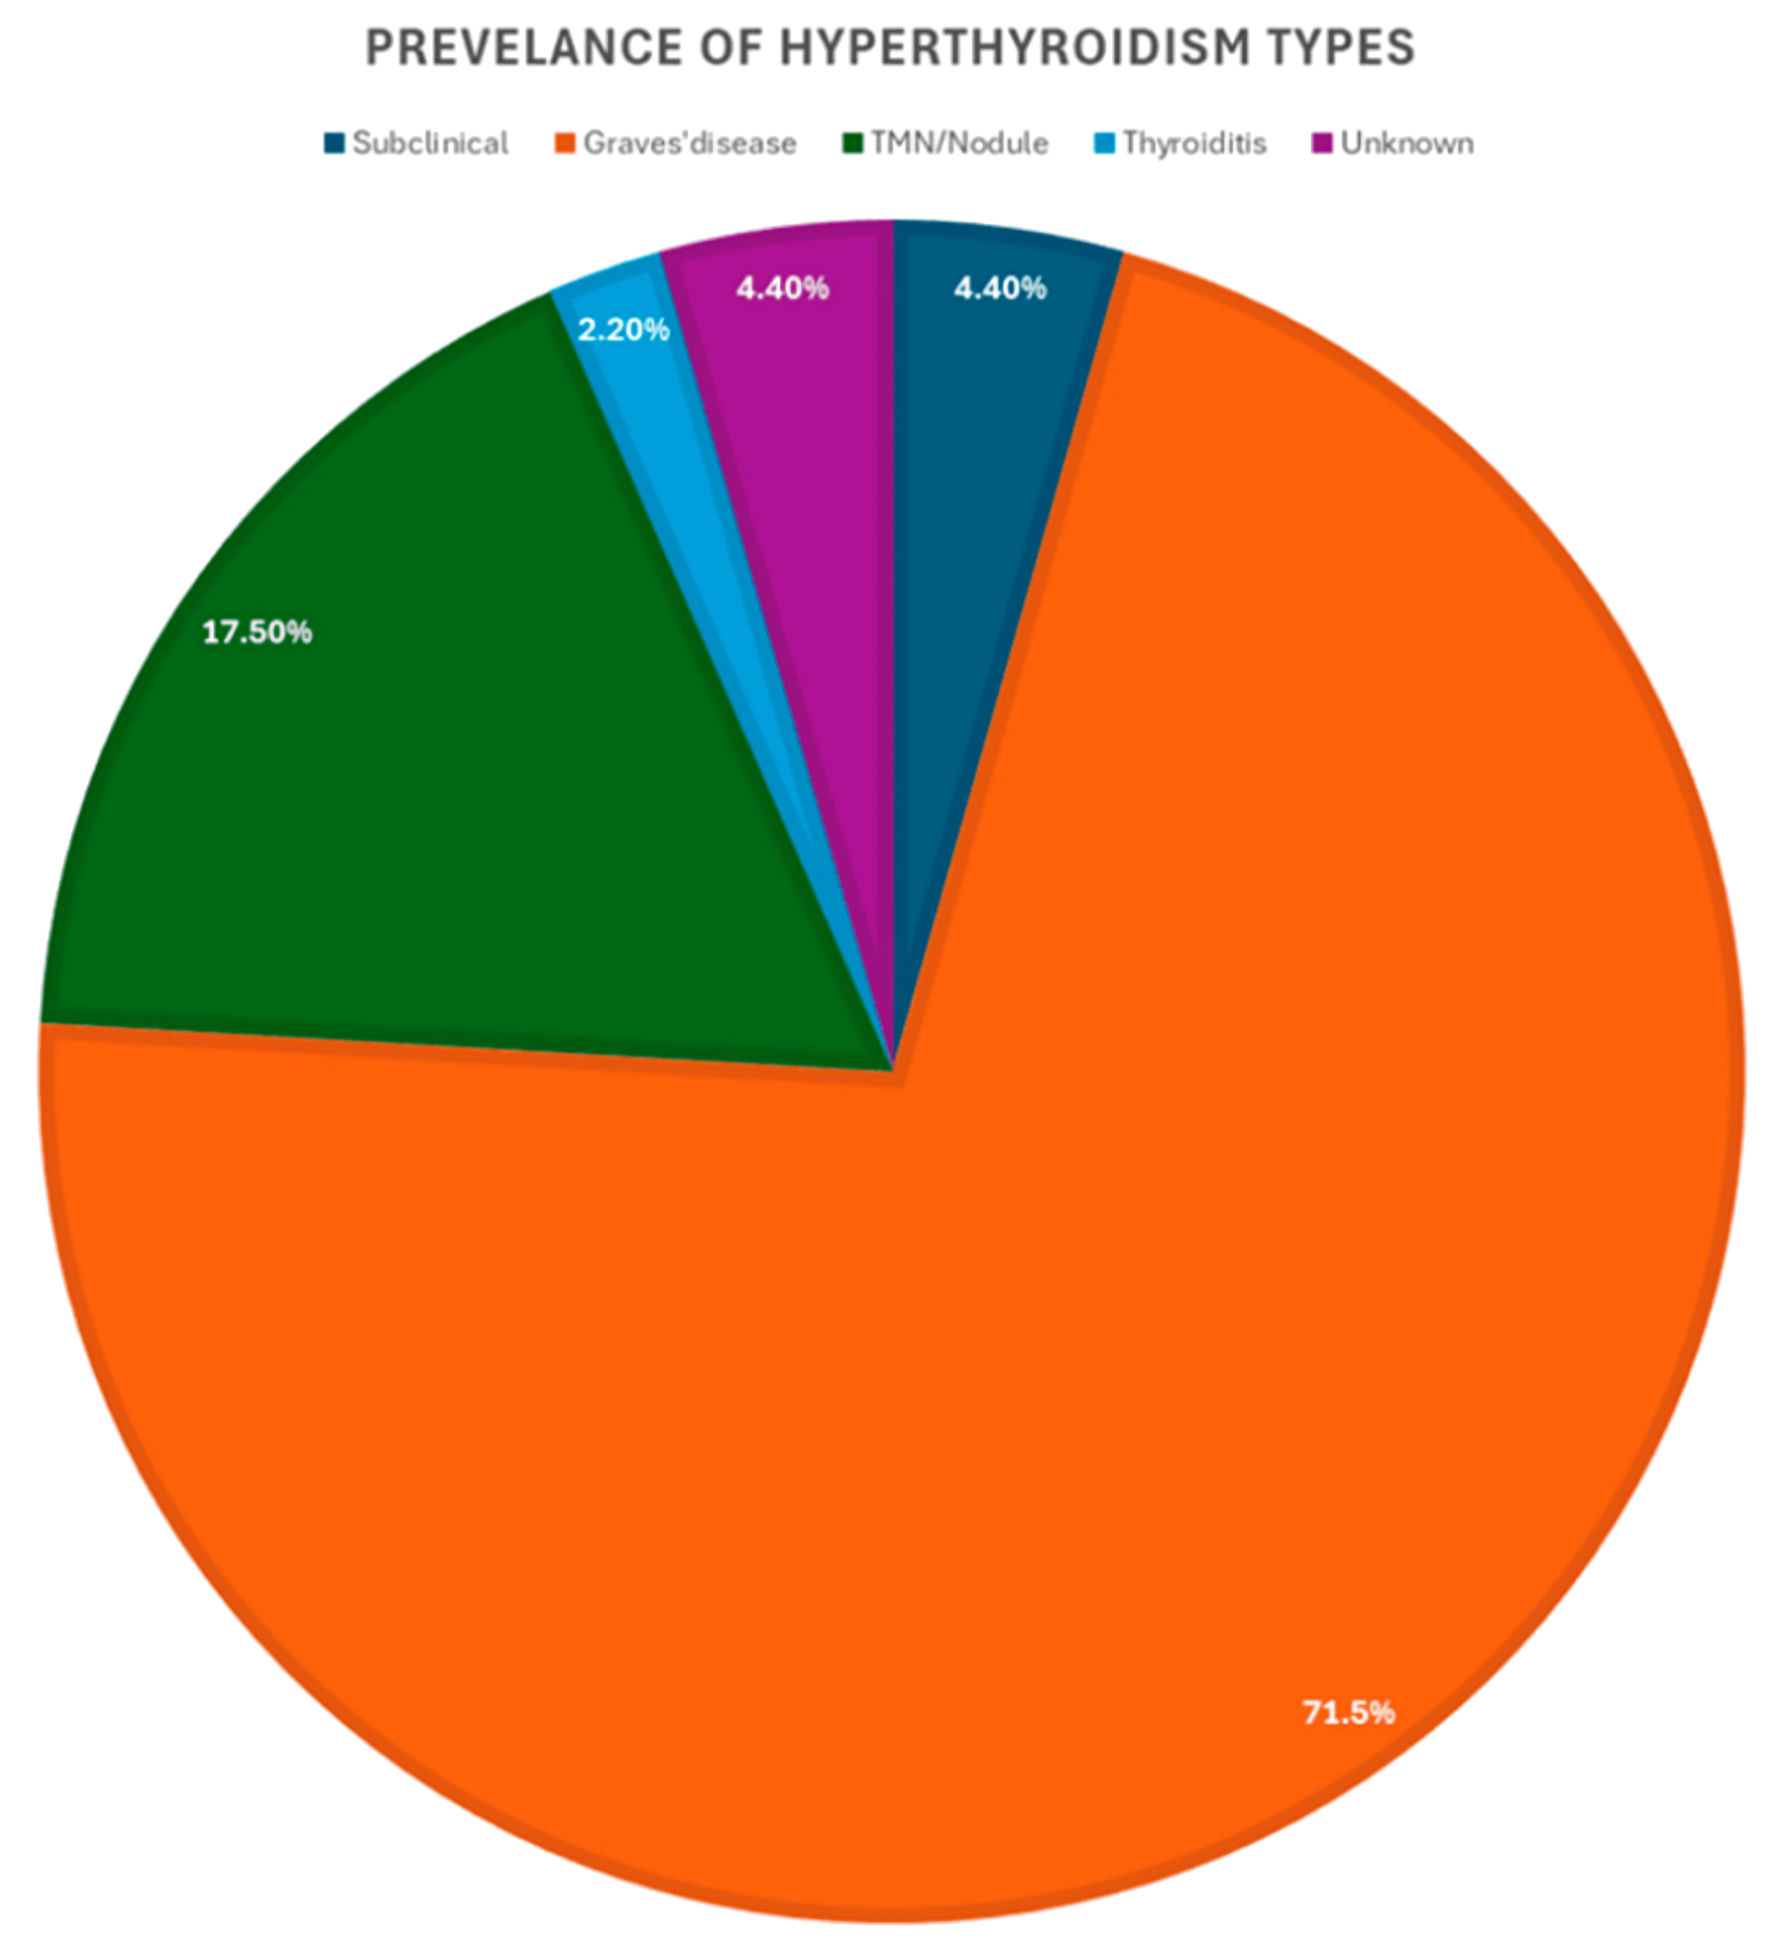
↓ Figure 1. Prevalence of hyperthyroidism types.
| Journal of Endocrinology and Metabolism, ISSN 1923-2861 print, 1923-287X online, Open Access |
| Article copyright, the authors; Journal compilation copyright, J Endocrinol Metab and Elmer Press Inc |
| Journal website https://jem.elmerpub.com |
Original Article
Volume 16, Number 3, June 2026, pages 148-156
Therapeutic Outcomes of Methimazole in Hyperthyroidism Patients
Figure
Tables
| Characteristics | N | Percentage (%) |
|---|---|---|
| Denominator of the percentage is the total number of subjects in each group. BMI: body mass index; TMN: toxic multinodular goiter. | ||
| 18–39 years | 23 | 8.3% |
| 30–59 years | 172 | 62.1% |
| > 59 years | 82 | 29.6% |
| Male | 82 | 29.6% |
| Female | 195 | 70.4% |
| BMI < 18.5 | 6 | 2.2% |
| BMI 18.5–24.9 | 53 | 19.1% |
| BMI 25–29 | 90 | 32.5% |
| BMI 30–34.9 | 71 | 25.6% |
| BMI 35–39 | 42 | 15.2% |
| BMI > 40 | 14 | 5.1% |
| Smokers | 26 | 9.6% |
| Non-smokers | 246 | 90.4% |
| Subclinical hyperthyroidism | 12 | 4.4% |
| Graves’ disease | 196 | 71.5% |
| TMN/nodule | 48 | 17.5% |
| Thyroiditis | 6 | 2.2% |
| Unknown type of hyperthyroidism | 12 | 4.4% |
| System | Side effects | 0–6 months (n = 65) | 6.1–12 months (n = 38) | 12.1–24 months (n = 42) | > 24 months (n = 132) | Total (n = 277) | P |
|---|---|---|---|---|---|---|---|
| Denominator of the percentage is the total number of subjects in each group. aChi-square test is used to calculate the P value. bFisher’s exact test is used to calculate the P value. In this study, a P value < 0.05 is considered significant. | |||||||
| Gastrointestinal effects | Sore throat | 3 (4.8%) | 5 (13.2%) | 5 (12.2%) | 31 (23.8%) | 44 (16.2%) | 0.0067a |
| Nausea | 4 (6.5%) | 5 (13.2%) | 6 (14.6%) | 19 (14.5%) | 34 (12.5%) | 0.4334a | |
| Vomiting | 3 (4.8%) | 5 (13.2%) | 4 (9.8%) | 21 (16.0%) | 33 (12.1%) | 0.1434b | |
| Hepatotoxicity | 1 (1.6%) | 1 (2.6%) | 1 (2.4%) | 3 (2.3%) | 6 (2.2%) | 1.0000b | |
| Musculoskeletal effects | Arthralgia | 7 (10.8%) | 7 (18.4%) | 6 (14.3%) | 30 (22.7%) | 50 (18.1%) | 0.1962a |
| Dermatological effects | Rashes | 21 (32.3%) | 7 (18.4%) | 14 (33.3%) | 41 (31.1%) | 83 (30%) | 0.4737a |
| Angioedema | 2 (3.2%) | 2 (5.3%) | 3 (7.3%) | 8 (6.1%) | 15 (5.5%) | 0.7948b | |
| Hematological effects | Leukopenia | 11 (17.7%) | 5 (13.2%) | 6 (14.6%) | 22 (16.8%) | 44 (16.2%) | 0.9241a |
| Anemia | 1 (1.6%) | 1 (2.6%) | 2 (4.9%) | 7 (5.3%) | 11 (4.0%) | 0.7261b | |
| Thrombocytopenia | 3 (4.8%) | 3 (7.9%) | 2 (4.9%) | 12 (9.2%) | 20 (7.3%) | 0.7176b | |
| Neutropenia | 5 (8.1%) | 2 (5.3%) | 6 (14.6%) | 16 (12.3%) | 29 (10.7%) | 0.4743b | |
| System | Side effects | 18–29 age (n = 23) | 30–59 age (n = 172) | > 59 age (n = 82) | Total (n = 277) | P |
|---|---|---|---|---|---|---|
| Denominator of the percentage is the total number of subjects in each group. aChi-square test is used to calculate the P value. bFisher’s exact test is used to calculate the P value. A P value < 0.05 is considered significant. | ||||||
| Gastrointestinal effects | Sore throat | 3 (14.3%) | 31 (18.5%) | 10 (12.2%) | 44 (16.2%) | 0.4382a |
| Nausea | 4 (19.0%) | 20 (11.8%) | 10 (12.2%) | 34 (12.5%) | 0.6381a | |
| Vomiting | 3 (14.3%) | 19 (11.2%) | 11 (13.4%) | 33 (12.1%) | 0.8423a | |
| Hepatotoxicity | 1 (4.5%) | 2 (1.2%) | 3 (3.7%) | 6 (2.2%) | 0.2388b | |
| Musculoskeletal effects | Arthralgia | 2 (8.7%) | 24 (14%) | 24 (29.3%) | 50 (18.1%) | 0.1756a |
| Dermatological effects | Rashes | 10 (43.5%) | 48 (27.9%) | 25 (27.9%) | 83 (30%) | 0.5581a |
| Angioedema | 1 (4.8%) | 5 (3.0%) | 9 (11.0%) | 15 (5.5%) | 0.0317b | |
| Hematological effects | Leukopenia | 3 (14.3%) | 23 (13.6%) | 18 (22.0%) | 44 (16.2%) | 0.2354a |
| Anemia | 1 (4.8%) | 3 (1.8%) | 7 (8.5%) | 11 (4.0%) | 0.0340b | |
| Thrombocytopenia | 1 (4.5%) | 6 (3.6%) | 13 (15.9%) | 20 (7.3%) | 0.0019 a | |
| Neutropenia | 5 (23.8%) | 16 (9.5%) | 8 (9.8%) | 29 (10.7%) | 0.1290a | |
| System | Side effects | Sub clinical (n = 12) | Graves (n = 196) | TMN/nodule (n = 48) | Thyroiditis (n = 6) | Unknown (n = 12) | Total (n = 274) | P |
|---|---|---|---|---|---|---|---|---|
| Denominator of the percentage is the total number of subjects in each group. aFisher’s exact test is used to calculate the P value. bChi-square test is used to calculate the P value. A P value < 0.05 is considered significant. TMN: toxic multi-nodular; NA: not available. | ||||||||
| Gastrointestinal effects | Sore throat | 3 (25.0%) | 35 (17.9%) | 5 (10.9%) | 1 (16.7%) | NA | 44 (16.4%) | 0.4240a |
| Nausea | 1 (8.3%) | 24 (12.3%) | 8 (17.0%) | 1 (16.7%) | NA | 34 (12.6%) | 0.6836a | |
| Vomiting | 2 (16.7%) | 22 (11.3%) | 7 (14.9%) | 1 (16.7%) | 1 (11.1%) | 33 (12.3%) | 0.7728a | |
| Hepatotoxicity | NA | 5 (2.6%) | 1 (2.1%) | NA | NA | 6 (2.2%) | 1.0000a | |
| Musculoskeletal effects | Arthralgia | 6 (50%) | 33 (16.8%) | 10 (20.8%) | 0 (0%) | 0 (0%) | 49 (17.9%) | 0.5950a |
| Dermatological effects | Rashes | 3 (25%) | 61 (31.1%) | 13 (27.1%) | 6 (100%) | 0 (0%) | 83 (30.3%) | 0.4737b |
| Angioedema | 1 (8.3%) | 8 (4.1%) | 4 (8.5%) | 2 (33.3%) | NA | 15 (5.6%) | 0.0521a | |
| Hematological effects | Leukopenia | 2 (16.7%) | 31 (15.9%) | 8 (17.0%) | 2 (33.3%) | 1 (11.1%) | 44 (16.4%) | 0.7698a |
| Anemia | NA | 8 (4.1%) | 2 (4.3%) | NA | NA | 10 (3.7%) | 1.0000a | |
| Thrombocytopenia | 2 (16.7%) | 11 (5.6%) | 3 (6.4%) | 2 (33.3%) | 1 (10.0%) | 19 (7.0%) | 0.0567a | |
| Neutropenia | 1 (8.3%) | 22 (11.3%) | 4 (8.5%) | 1 (16.7%) | 1 (11.1%) | 29 (10.8%) | 0.9126a | |
| Category | Sub-category | N | Percentage (%) |
|---|---|---|---|
| Denominator of the percentage is the total number of subjects in each group. T4: thyroxine; TSH: thyroid-stimulating hormone; NA: not available. | |||
| T4 levels before methimazole | < 5 µg/dL | 1 | 0.4% |
| 5–12 µg/dL | 35 | 12.8% | |
| >12 µg/dL | 225 | 82.4% | |
| NA | 12 | 4.4% | |
| TSH levels before methimazole | < 0.35 µg/dL | 233 | 84.4% |
| 0.35–4.5 µg/dL | 29 | 10.5% | |
| > 4.5 µg/dL | 4 | 1.4% | |
| NA | 10 | 3.6% | |
| T4 levels after methimazole | <5 µg/dL | 117 | 43% |
| 5–12 µg/dL | 151 | 55.5% | |
| > 12 µg/dL | 4 | 1.5% | |
| TSH levels after methimazole | <5 µg/dL | 41 | 15% |
| 5–12 µg/dL | 202 | 73.7% | |
| > 12 µg/dL | 30 | 10.9% | |
| NA | 1 | 0.4% | |