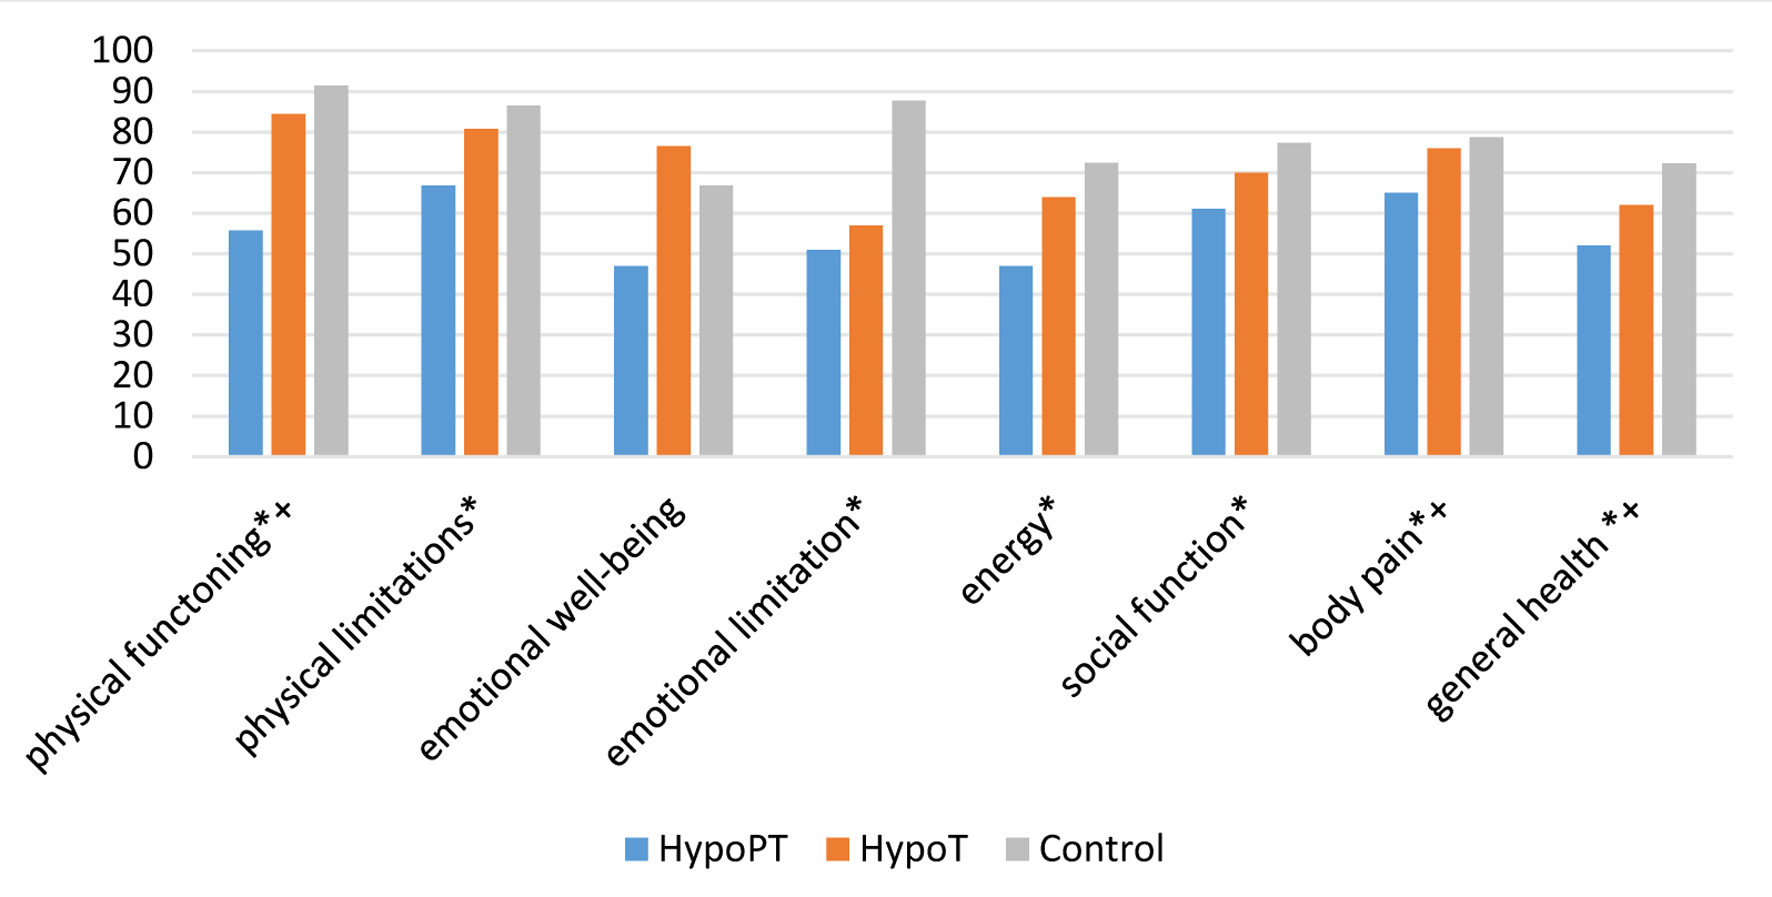
| Journal of Endocrinology and Metabolism, ISSN 1923-2861 print, 1923-287X online, Open Access |
| Article copyright, the authors; Journal compilation copyright, J Endocrinol Metab and Elmer Press Inc |
| Journal website https://jem.elmerpub.com |
Original Article
Volume 16, Number 3, June 2026, pages 157-165
Long-Term Postsurgical Hypoparathyroidism: Subtle Musculoskeletal Alterations and Marked Quality-of-Life Impairment
Figures


Tables
| Control (n = 30) (mean ± SD) | HypoT (n = 30) (mean ± SD) | HypoPT + T (n = 30) (mean ± SD) | P | |
|---|---|---|---|---|
| *Statistically significant differences (P < 0.05). BMI: body mass index; FFM: fat-free mass; HypoT: postsurgical hypothyroidism; HypoPT + T: postsurgical hypoparathyroidism and hypothyroidism; SD: standard deviation. | ||||
| Gender (female/male) | 26/4 | 26/4 | 26/4 | |
| Age (years) | 42.3 ± 9.8 (46) | 42.9 ± 7.4 (44) | 42.3 ± 8.9 (40) | 0.69 |
| Height (cm) | 160.8 ± 7.2 (160) | 160.2 ± 6.4 (160) | 161.7 ± 7.4 (160) | 0.53 |
| Weight (kg) | 75.9 ± 14.8 (74.8) | 75.3 ± 15.7 (71.5) | 77.9 ± 16.2 (75.2) | 0.79 |
| BMI (kg/cm2) | 29.9 ± 6.6 (28.4) | 29.9 ± 6.5 (30.2) | 29.4 ± 5.5 (29.2) | 0.93 |
| FFM (kg) | 44.7 ± 10.6 (44.6) | 37.6 ± 14.4 (38.5) | 36.3 ± 14.3 (37.5) | 0.01* |
| Control (n = 30) | HypoT (n = 30) | HypoPT + T (n = 30) | P | |
|---|---|---|---|---|
| Values are n (%) or mean. HypoT: postsurgical hypothyroidism; HypoPT + T: postsurgical hypoparathyroidism and hypothyroidism. | ||||
| Surgery type | 0.09 | |||
| Total | - | 22 | 27 | |
| Subtotal | - | 8 | 3 | |
| Time since surgery (years) | - | 9 | 8.1 | 0.51 |
| Diseases necessitating surgery | ||||
| Multinodular goiter | - | 23 | 22 | |
| Diffuse goiter | - | 2 | 3 | |
| Graves | - | 5 | 5 | |
| Medical treatments | ||||
| Levothyroxine, n (%) | - | 30 (100) | 30 (100) | |
| Dose (µg/day) | 129 (50–200) | 120.8 (25–225) | 0.68 | |
| Alfacalcidiol, n (%) | - | - | 30 (100) | |
| Dose (µg/day) | 0.8 (0.25–2) | |||
| Use of calcium supplement, n (%) | - | - | 30 (100) | |
| Dose (mg/day) | - | - | 600 (600–1,800) | |
| Use of vitamin D3 supplement, n (%) | - | - | 7 (23) | |
| Dose (IU/day) | - | - | 800 (800–1,600) | |
| Reference | Control (n = 30) | HypoT (n = 30) | HypoPT + T (n = 30) | P | |
|---|---|---|---|---|---|
| Values are mean ± SD. *Statistically significant differences (P < 0.05).CK: creatinin kinase; eGFR: estimated glomerular filtration rate; HypoT: postsurgical hypothyroidism; HypoPT + T: postsurgical hypoparathyroidism and hypothyroidism; PTH: parathyroid hormone; ST4: free T4; TSH: thyroid-stimulating hormone. | |||||
| TSH (mIU/L) | 0.40–3.77 | 2.1 ± 1 | 2.3 ± 1.4 | 1.8 ± 1.5 | 0.15 |
| ST4 (ng/dL) | 0.93–1.6 | 1.2 ± 0.1 | 1.3 ± 0.2 | 1.4 ± 0.2 | 0.11 |
| Calcium (mg/dL) | 8.8–10.6 | 9 ± 0.4 | 9.1 ± 0.5 | 8.8 ± 0.5 | 0.05 |
| Phosphate (mg/dL) | 2.6–4.5 | 3.5 ± 0.3 | 3.5 ± 0.5 | 3.7 ± 0.6 | 0.11 |
| Magnesium (mmol/L) | 0.66–1.07 | 0.83 ± 0.06 | 0.84 ± 0.05 | 0.83 ± 0.04 | 0.18 |
| Creatinine (mg/dL) | < 0.90 | 0.76 ± 0.1 | 0.74 ± 0.1 | 0.70 ± 0.1 | 0.11 |
| eGFR (mL/min/1.73 m2) | ≥ 90 | 103 ± 23 | 95.8 ± 13.4 | 97 ± 16.8 | 0.11 |
| PTH (ng/mL) | 15–65 | 39.9 ± 11.4 | 42.2 ± 11.5 | 15.5 ± 7.7 | 0.0* |
| 25OHVitD | 30–80 | 33.3 ± 3.5 | 33.7 ± 2.8 | 34.6 ± 4.1 | 0.37 |
| CK (U/L) | < 170 | 78.3 ± 41.8 | 116.5 ± 62.6 | 119.4 ± 57.2 | 0.0* |
| Control (n = 30) | HypoT (n = 30) | HypoPT + T (n = 30) | P | |
|---|---|---|---|---|
| Values are mean ± SD. HypoT: postsurgical hypothyroidism; HypoPT + T: postsurgical hypoparathyroidism and hypothyroidism. | ||||
| Pinch grip strength (kg) | 4.2 ± 0.9 | 4.2 ± 0.9 | 4.1 ± 0.9 | 0.94 |
| Lateral grip strength (kg) | 6.6 ± 1.5 | 6.2 ± 1.8 | 6.1 ± 1 | 0.38 |
| Triple grip strength (kg) | 5.3 ± 1.3 | 5.3 ± 1.5 | 5.2 ± 1.6 | 0.97 |
| Hand wrist grip strength (kg) | 26.1 ± 4.6 | 26.5 ± 4.3 | 25 ± 6.7 | 0.54 |
| 60°/s extension lower extremite peak tork (Nm) | 87 ± 24.8 | 85.7 ± 14.6 | 84.6 ± 23 | 0.97 |
| 60°/s flexion lower extremite peak tork (Nm) | 57.5 ± 16.7 | 58.3 ± 11.7 | 54.9 ± 20.1 | 0.46 |
| 120°/s extension lower extremite peak tork (Nm) | 61.1 ± 22.5 | 55.6 ± 11.4 | 53.5 ± 13.3 | 0.19 |
| 120°/s flexion lower extremite peak tork (Nm) | 44.5 ± 18.2 | 45.9 ± 9 | 40.6 ± 14.5 | 0.33 |
| 180°/s extension lower extremite peak tork (Nm) | 45.4 ± 17 | 44 ± 10.6 | 40.5 ± 11 | 0.35 |
| 180°/s flexion lower extremite peak tork (Nm) | 37.1 ± 14.3 | 36.9 ± 7.7 | 33.5 ± 12.5 | 0.28 |
| Control (n = 30) | HypoT (n = 30) | HypoPT + T (n = 30) | P | |
|---|---|---|---|---|
| Values are mean ± SD. *Statistically significant differences (P < 0.05). HypoT: postsurgical hypothyroidism; HypoPT + T: postsurgical hypoparathyroidism and hypothyroidism. RCS: repeated chair stands; TUG: timed up and go. | ||||
| RCS | 11.7 ± 1.6 | 11 ± 2 | 9.9 ± 2 | 0.001* |
| TUG (s) | 12.9 ± 1 | 15 ± 1.8 | 14.7 ± 2.2 | 0.0* |