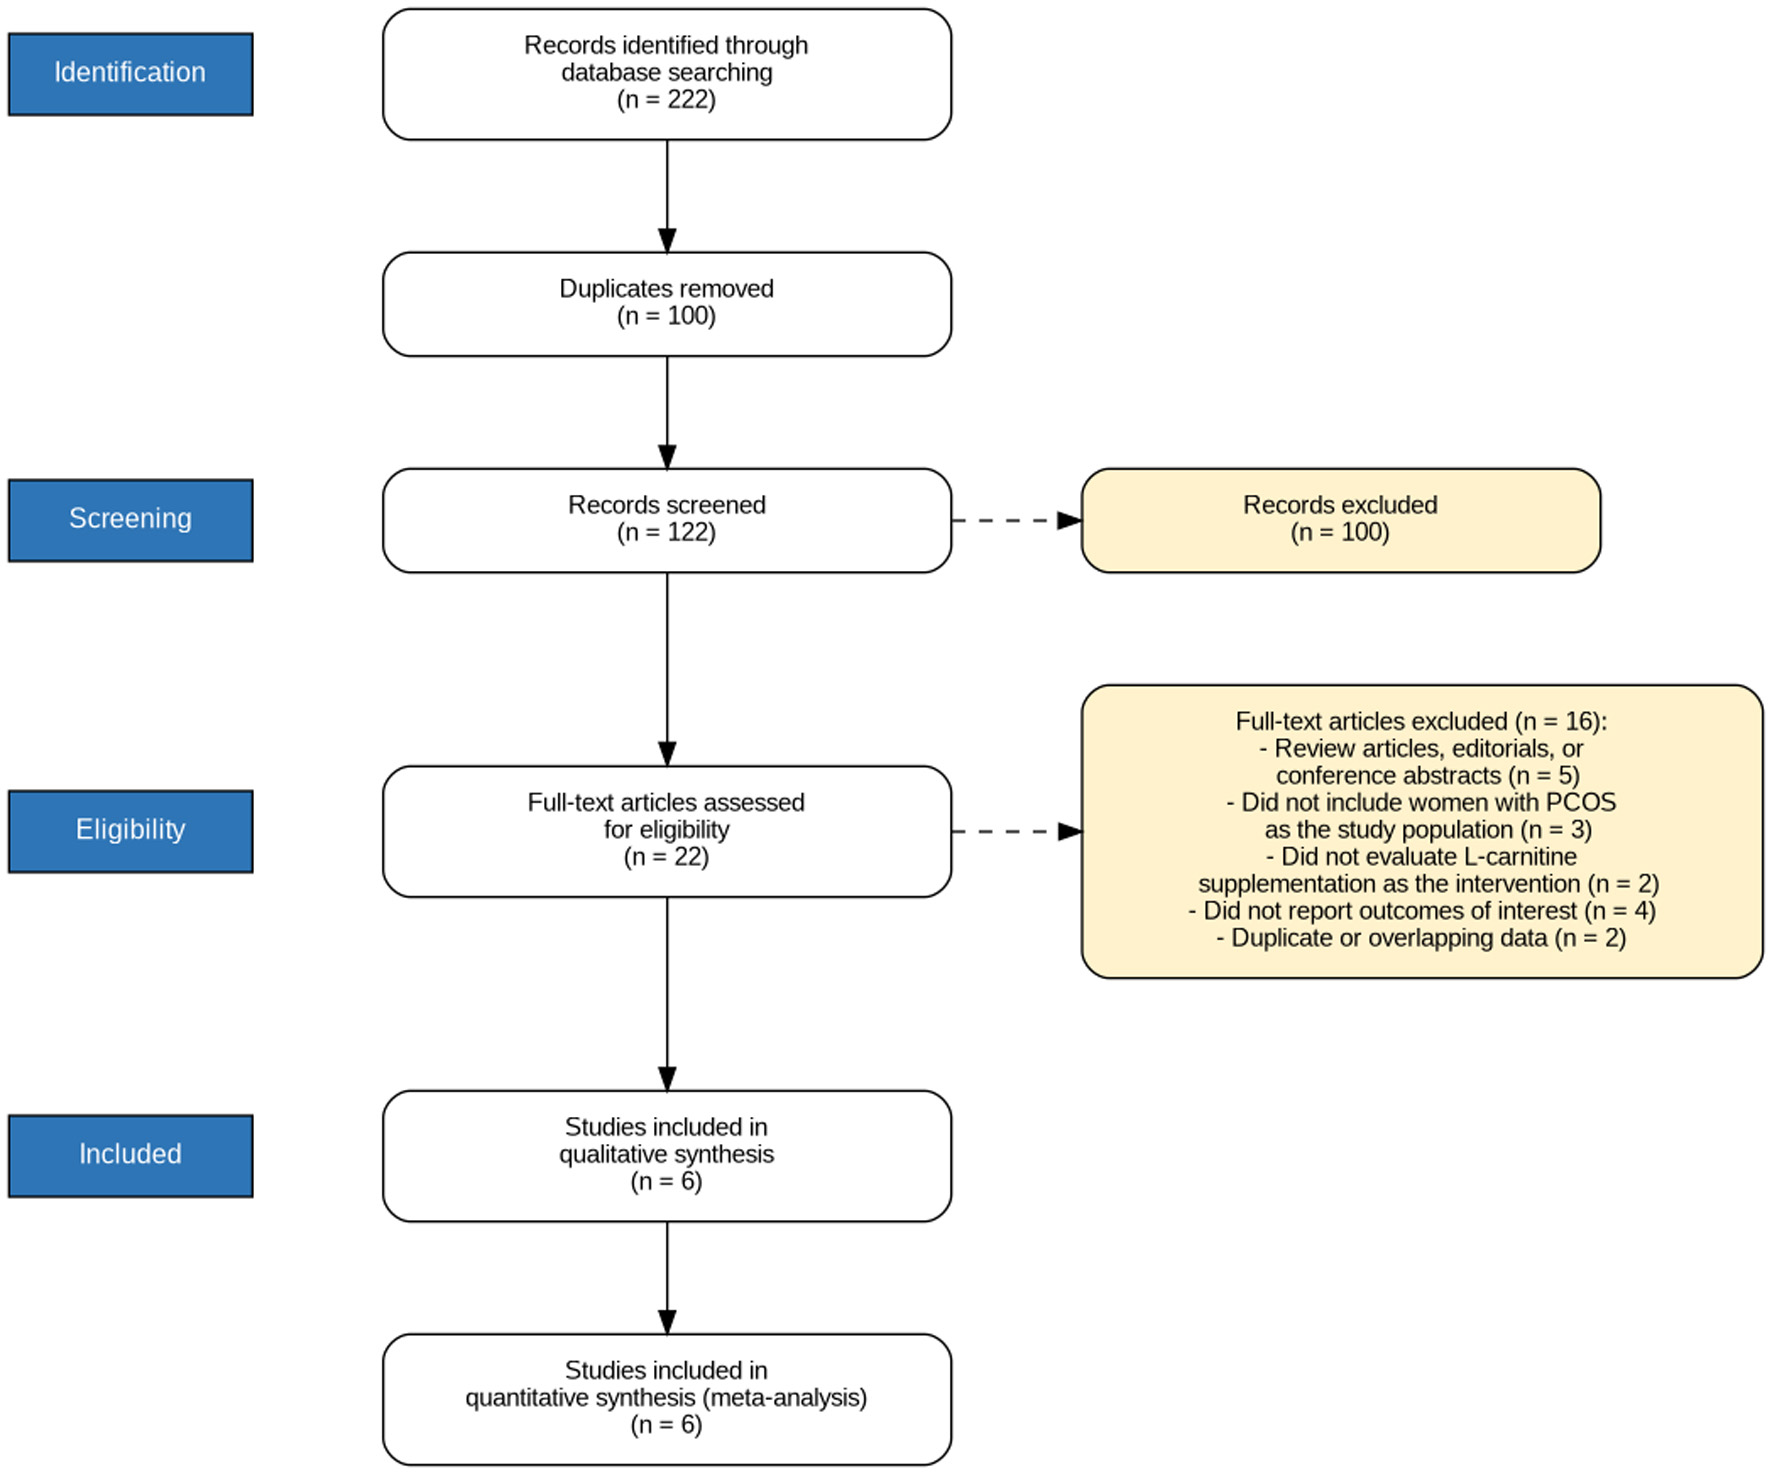
↓ Figure 1. PRISMA flow diagram illustrating the systematic literature search and study selection process, including the number of records identified, screened, assessed for eligibility, and finally included in the meta-analysis.
| Journal of Endocrinology and Metabolism, ISSN 1923-2861 print, 1923-287X online, Open Access |
| Article copyright, the authors; Journal compilation copyright, J Endocrinol Metab and Elmer Press Inc |
| Journal website https://jem.elmerpub.com |
Original Article
Volume 16, Number 2, April 2026, pages 109-117
Impact of L-Carnitine on Reproductive Outcomes in Women With Polycystic Ovarian Syndrome: A Systematic Review and Meta-Analysis of Randomized Controlled Trials
Figures
Table
| Study ID | Study location | Study arms | Sample size | Maternal age (years) | BMI | Duration of infertility (years) | Type of infertility, n (%) | Interventions | |
|---|---|---|---|---|---|---|---|---|---|
| Primary | Secondary | ||||||||
| BMI: body mass index; CC: clomiphene citrate; GnRH: gonadotropin-releasing hormone; LC: L-carnitine; NA: not available. | |||||||||
| Hafezi et al, 2024 [14] | Iran | LC group | 47 | 29.8 ± 4 | 27.4 ± 5.2 | 6.8 ± 3.9 | 40 (85) | 7 (15) | Three tablets of L-carnitine (1,000 mg) daily plus GnRH antagonist protocol. |
| Control group | 50 | 30.4 ± 4.3 | 27.4 ± 3.7 | 6.5 ± 4 | 39 (78) | 11 (22) | Placebo plus GnRH antagonist protocol. | ||
| Chaleshtori et al, 2022 [19] | Iran | LC group | 74 | 30.29 ± 2.2 | 30.85 ± 1.93 | 2.3 ± 1.6 | 74 (100) | 0 (0) | 150 mg/day oral CC plus 3 g oral L-carnitine daily. |
| Control group | 74 | 31.29 ± 4.7 | 31.45 ± 5.71 | 2.14 ± 1.9 | 55 (74) | 19 (26) | 150 mg/day oral CC plus placebo. | ||
| Sheida et al, 2023 [20] | Iran | LC group | 41 | 30 ± 5.01 | 28.06 ± 3.38 | 5.92 ± 2.94 | 35 (85) | 6 (15) | L-carnitine (3,000 mg) daily plus GnRH antagonist protocol. |
| Control group | 39 | 31.57 ± 4.7 | 28.22 ± 3.33 | 5.95 ± 3.95 | 35 (90) | 4 (10) | Placebo plus GnRH antagonist protocol. | ||
| Kortam et al, 2020 [18] | Egypt | LC group | 47 | 25.2 ± 3.9 | 30 ± 5.2 | 2.35 ± 1.5 | 34 (72) | 13 (28) | Oral CC (50 mg tablet, two times per day) plus oral L-carnitine supplementation (1 g tablet, three times per day). |
| Control group | 47 | 25.8 ± 2.6 | 30.4 ± 3 | 2.2 ± 0.9 | 35 (74) | 12 (26) | Oral CC (50 mg tablet, two times per day) plus placebo. | ||
| Gharib, 2019 [13] | Egypt | LC group | 20 | 24.65 ± 2.1 | 28.25 ± 1.8 | 2.8 ± 0.83 | NA | NA | Letrozole (2.5 mg tablets) plus L-carnitine (2 g/day) |
| Control group | 20 | 24.15 ± 2.45 | 27.49 ± 2.3 | 3.1 ± 1.09 | NA | NA | Letrozole (2.5 mg tablets) plus placebo. | ||
| Abd-Elfattah et al, 2019 [17] | Egypt | LC group | 25 | 26.12 ± 3.28 | 31.22 ± 2.56 | NA | NA | NA | 100–150 mg/day oral CC plus L-carnitine (3 g daily) |
| Control group | 25 | 25.64 ± 2.63 | 31.79 ± 2.72 | NA | NA | NA | 100–150 mg/day oral CC plus placebo. | ||