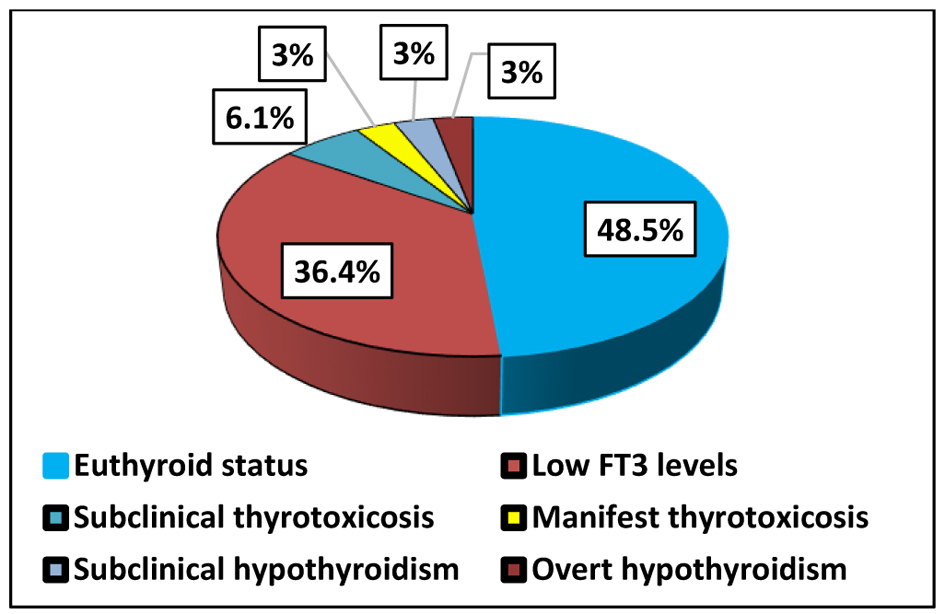
↓ Figure 1. Thyroid status in patients with active COVID-19 infection (group 1). COVID-19: coronavirus disease 2019.
| Journal of Endocrinology and Metabolism, ISSN 1923-2861 print, 1923-287X online, Open Access |
| Article copyright, the authors; Journal compilation copyright, J Endocrinol Metab and Elmer Press Inc |
| Journal website https://jem.elmerpub.com |
Original Article
Volume 16, Number 2, April 2026, pages 70-81
From Inflammation to Endocrine Dysregulation: Thyroid Hormonal Alterations in COVID-19
Figures
Tables
| Variable | Group 1 (n = 33) | Group 2 (n = 35) | Group 3 (n = 33) |
|---|---|---|---|
| SD: standard deviation. | |||
| Age (mean ± SD) | 69.88 ± 11.89 | 45.24 ± 14.47 | 46.73 ± 13.01 |
| Gender | |||
| Male (n, %) | 15 (45.5%) | 11 (31.4%) | 3 (9.1%) |
| Female (n, %) | 18 (54.5%) | 24 (68.6%) | 30 (90.9%) |
| Parameters | Group 1 (n = 33) | Group 2 (n = 35) | Group 3 (n = 33) | P-value (1–2/2–3/1–3) |
|---|---|---|---|---|
| Values are expressed as mean ± SD and Me (IQR). Overall between-group differences were assessed using the Kruskal–Wallis test, and when appropriate, pairwise comparisons between groups were performed using the Mann–Whitney U test. A P-value < 0.05 was considered statistically significant. FT3: free triiodothyronine; FT4: free thyroxine; Tg: thyroglobulin; TPO: thyroid peroxidase; TSH: thyroid-stimulating hormone. | ||||
| TSH (mIU/L) | 1.35 ± 1.21 1.30 (1.32) | 2.57 ± 2.95 1.78 (1.76) | 4.51 ± 1.23 2.29 (3.23) | 0.063/0.240/0.000 |
| FT3 (pmol/L) | 3.03 ± 0.94 2.81 (1.28) | 6.52 ± 8.34 4.48 (1.33) | 5.09 ± 0.87 4.98 (1.58) | 0.000/0.077/0.000 |
| FT4 (pmol/L) | 21.17 ± 28.25 13.96 (2.90) | 30.58 ± 40.73 14.04 (2.16) | 21.50 ± 19.23 13.56 (1.91) | 0.091 |
| Tg (ng/mL) | 17.66 ± 4.13 11.90 (10.57) | 16.86 ± 6.02 12.38 (39.51) | 17.24 ± 3.01 15.23 (19.47) | 0.404 |
| TPO (pg/mL) | 137.39 ± 211.07 47.80 (113.60) | 53.71 ± 134.15 16.87 (55.66) | 186.94 ± 146.21 129.33 (195.00) | 0.089 |
| Marker | Group 1 (n = 33) | Group 2 (n = 35) | Group 3 (n = 33) | P-value (1–2/2–3/1–3) |
|---|---|---|---|---|
| Values are expressed as mean ± SD and Me (IQR). Pairwise comparisons between groups were performed using the Mann–Whitney U test. A P-value < 0.05 was considered statistically significant. IFN-γ: interferon-gamma; IL-7: interleukin-7; IL-10: interleukin-10; IL-17A: interleukin-17A. | ||||
| IL-17A (pg/mL) | 29.45 ± 4.90 28.07 (3.86) | 32.48 ± 27.84 25.13 (5.35) | 41.91 ± 37.26 29.04 (7.71) | 0.001/0.000/0.142 |
| IL-10 (pg/mL) | 4.54 ± 4.75 2.92 (2.10) | 2.77 ± 2.89 1.86 (0.96) | 3.10 ± 1.31 3.02 (0.83) | 0.005/0.001/0.402 |
| IL-7 (pg/mL) | 36.70 ± 10.8 36.76 (13.25) | 27.27 ± 8.35 26.73 (13.25) | 58.06 ± 30.14 51.41 (26.13) | 0.000/0.000/0.000 |
| IFN-γ (pg/mL) | 12.23 ± 3.33 11.17 (5.48) | 8.64 ± 4.94 8.75 (7.83) | 15.01 ± 6.17 13.12 (9.10) | 0.003/0.000/0.106 |
| Маrkers | Group 1 (n = 33) | Group 2 (n = 35) | Group 3 (n = 33) | P-value (1–2/2–3/1–3) |
|---|---|---|---|---|
| Values are expressed as mean ± SD and Me (IQR). Pairwise comparisons between groups were performed using the Mann–Whitney U test. A P-value < 0.05 was considered statistically significant. HIF-1α: hypoxia-inducible factor-1 alpha; NFE2L2: nuclear factor erythroid 2-related factor 2. | ||||
| HIF-1α (pg/mL) | 1321.51 ± 1224.92 1035.67 (878.89) | 424.33 ± 321.3 364.67 (357.71) | 558.87 ± 458.98 373.96 (412.77) | 0.000/0.134/0.000 |
| NFE2L2 (pg/mL) | 229.23 ± 69.04 226.90 (92.53) | 185.97 ± 146.56 148.98 (120.64) | 220.58 ± 107.32 214.31 (180.53) | 0.004/0.069/0.595 |
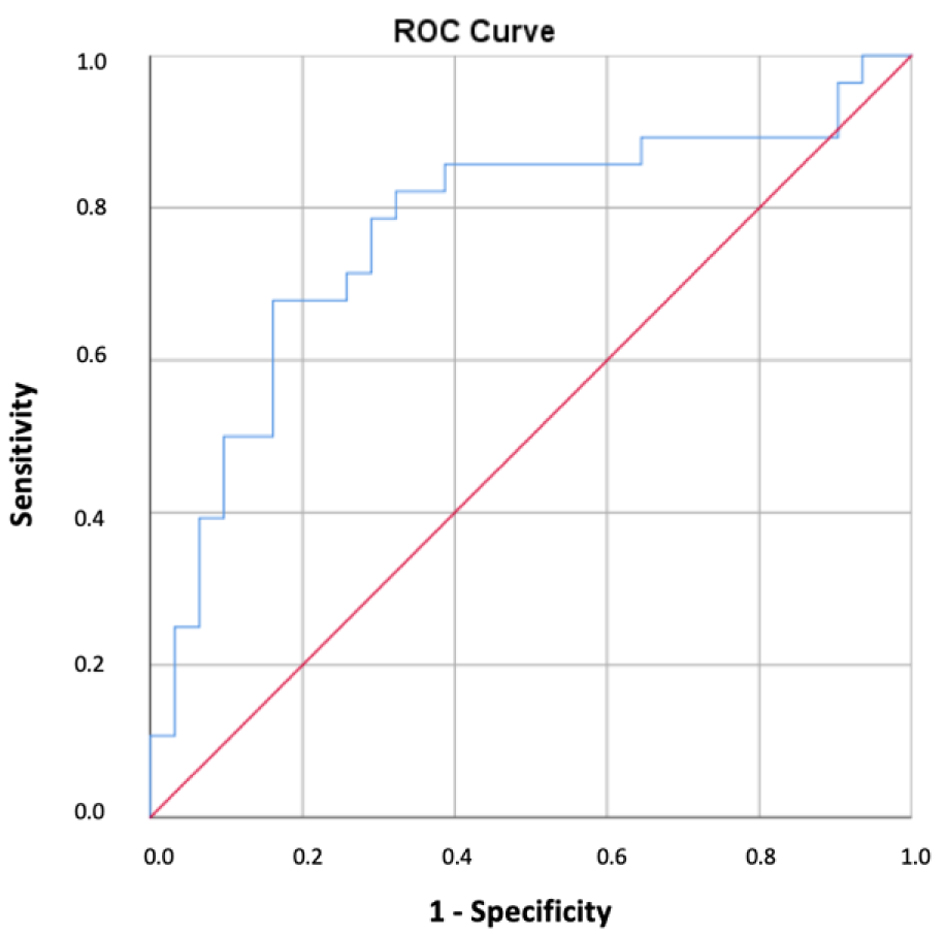
| Variable | AUC (95% CI) | P-value | Cut-off (pg/mL) | Sensitivity (%) | Specificity (%) |
|---|---|---|---|---|---|
| AUC: area under the curve; CI: confidence interval; COVID-19: coronavirus disease 2019; HIF-1α: hypoxia-inducible factor-1 alpha; ROC: receiver operating characteristic. | |||||
| HIF-1α | 0.771 (0.644–0.897) | < 0.001 | 842.6 | 0.67 | 0.83 |
| Correlations | Group 1 | Group 2 | Group 3 |
|---|---|---|---|
| Data are presented as Spearman correlation coefficients (r). Statistical significance was considered at P < 0.05. FT3: free triiodothyronine; FT4: free thyroxine; IL-7: interleukin-7; IL-10: interleukin-10; TPO: thyroid peroxidase. | |||
| IL-7–TPO | r = 0.390, P = 0.049 | - | - |
| IL-7–FT3 | r = −0.440, P = 0.021 | - | - |
| FT4–IL-10 | - | r = 0.438, P = 0.014 | r = −0.418, P = 0.042 |
| FT3–IL-10 | - | - | r = −0.631, P = 0.001 |