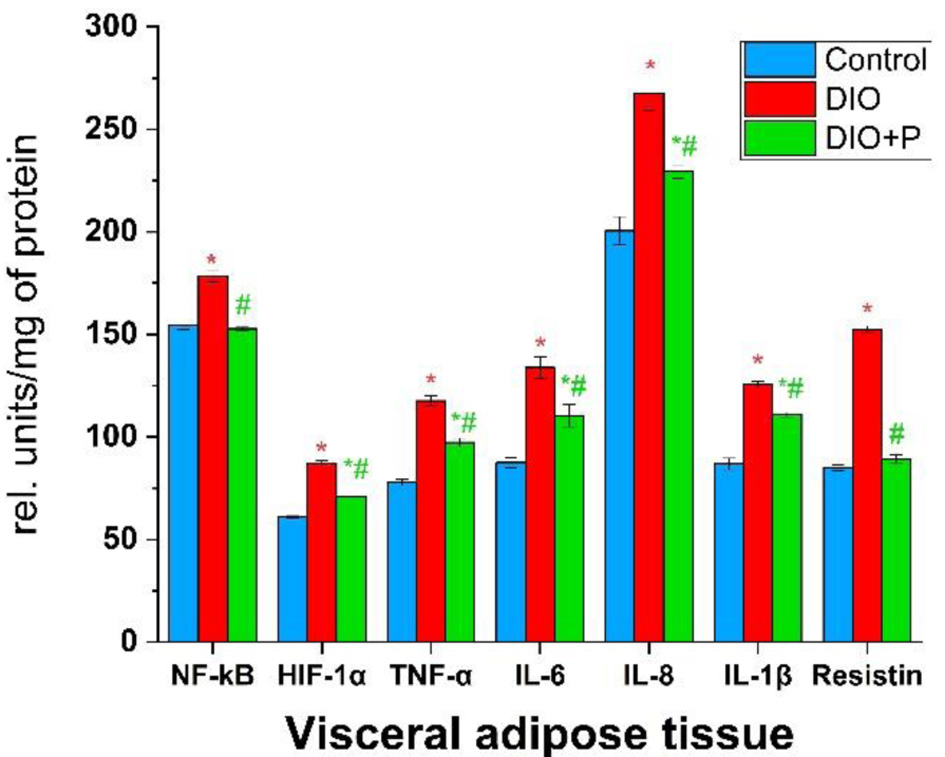
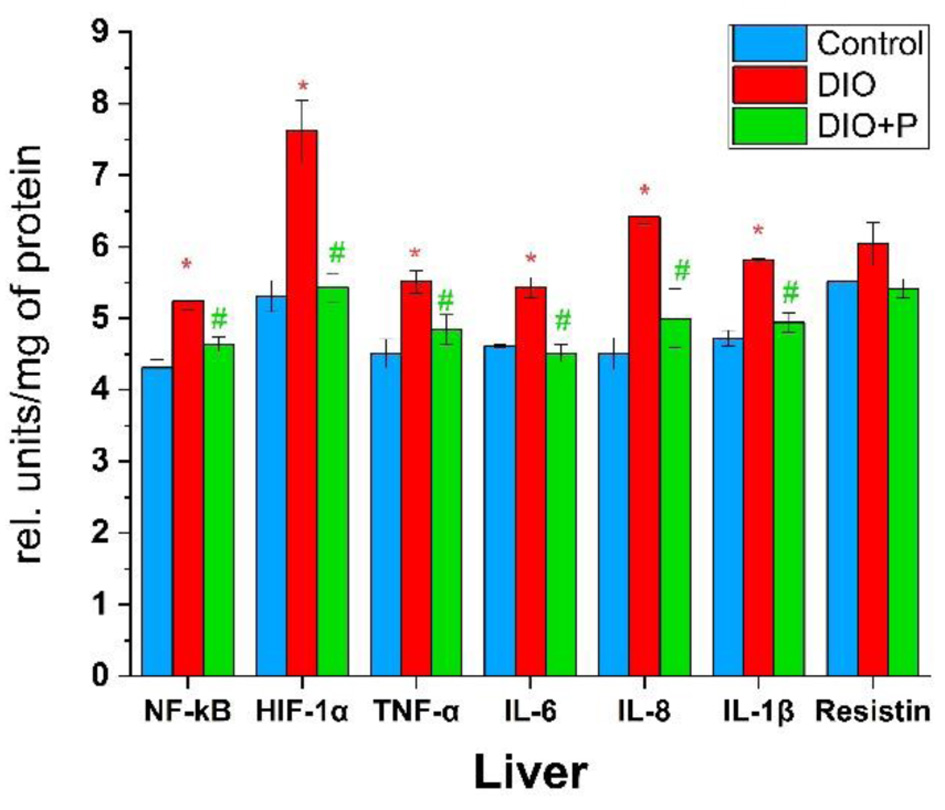
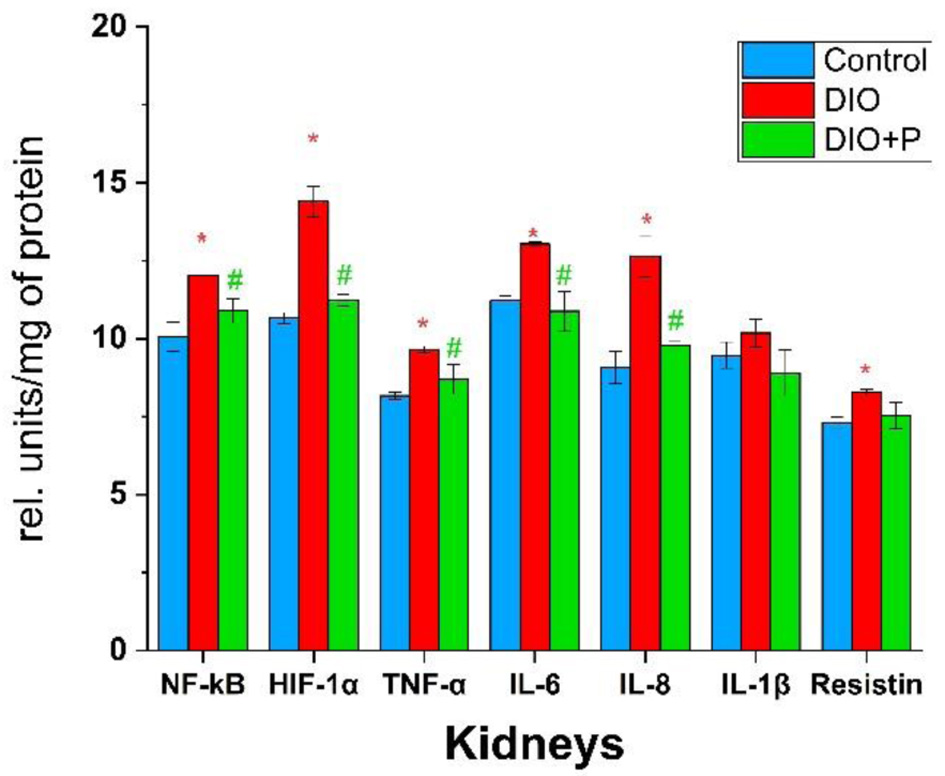
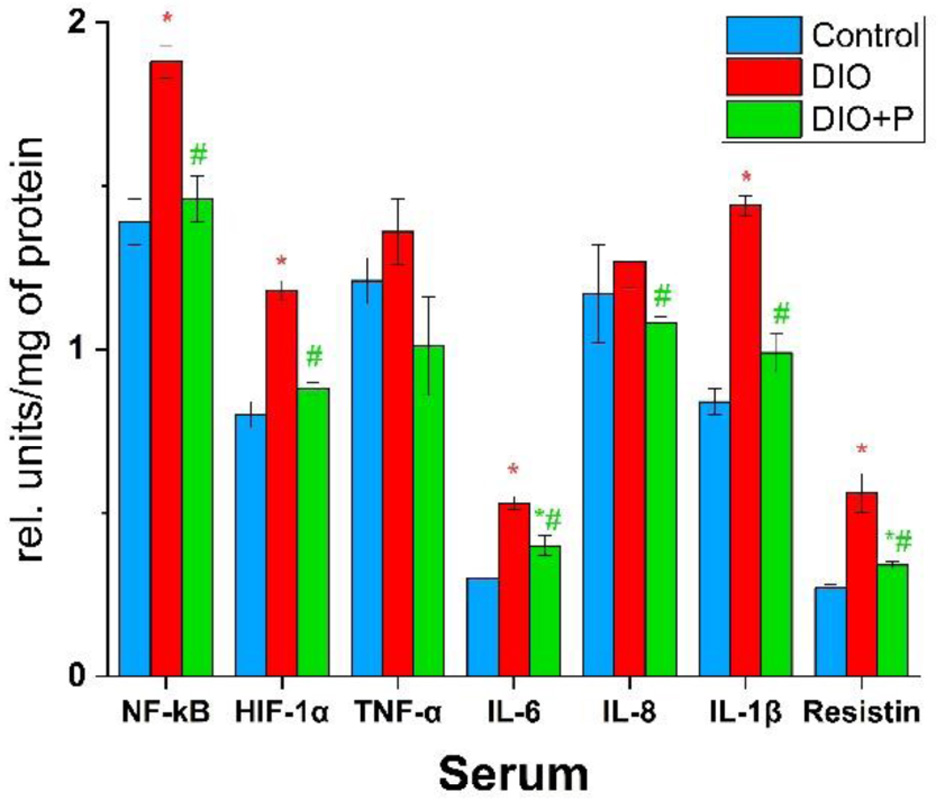
↓ Figure 1. Concentrations of cytokines and pro-inflammatory transcription factors in rats’ sera. *P < 0.05 (compared to control group), #P < 0.05 (compared to DIO group), n = 5. DIO: diet-induced obesity.
| Journal of Endocrinology and Metabolism, ISSN 1923-2861 print, 1923-287X online, Open Access |
| Article copyright, the authors; Journal compilation copyright, J Endocrinol Metab and Elmer Press Inc |
| Journal website https://jem.elmerpub.com |
Original Article
Volume 16, Number 2, April 2026, pages 101-108
Common Bean (Phaseolus vulgaris) Husk Peptides Mitigate Cytokine Dysregulation and Inflammation in Obese Rats
Figures