Journal of Endocrinology and Metabolism, ISSN 1923-2861 print, 1923-287X online, Open Access
Article copyright, the authors; Journal compilation copyright, J Endocrinol Metab and Elmer Press Inc
Journal website https://jem.elmerpub.com

Original Article

Volume 000, Number 000, May 2026, pages 000-000


The Influence of Age on the Efficacy of a Novel Antidiabetic Drug Imeglimin in Patients With Poorly Controlled Type 2 Diabetes

Figure

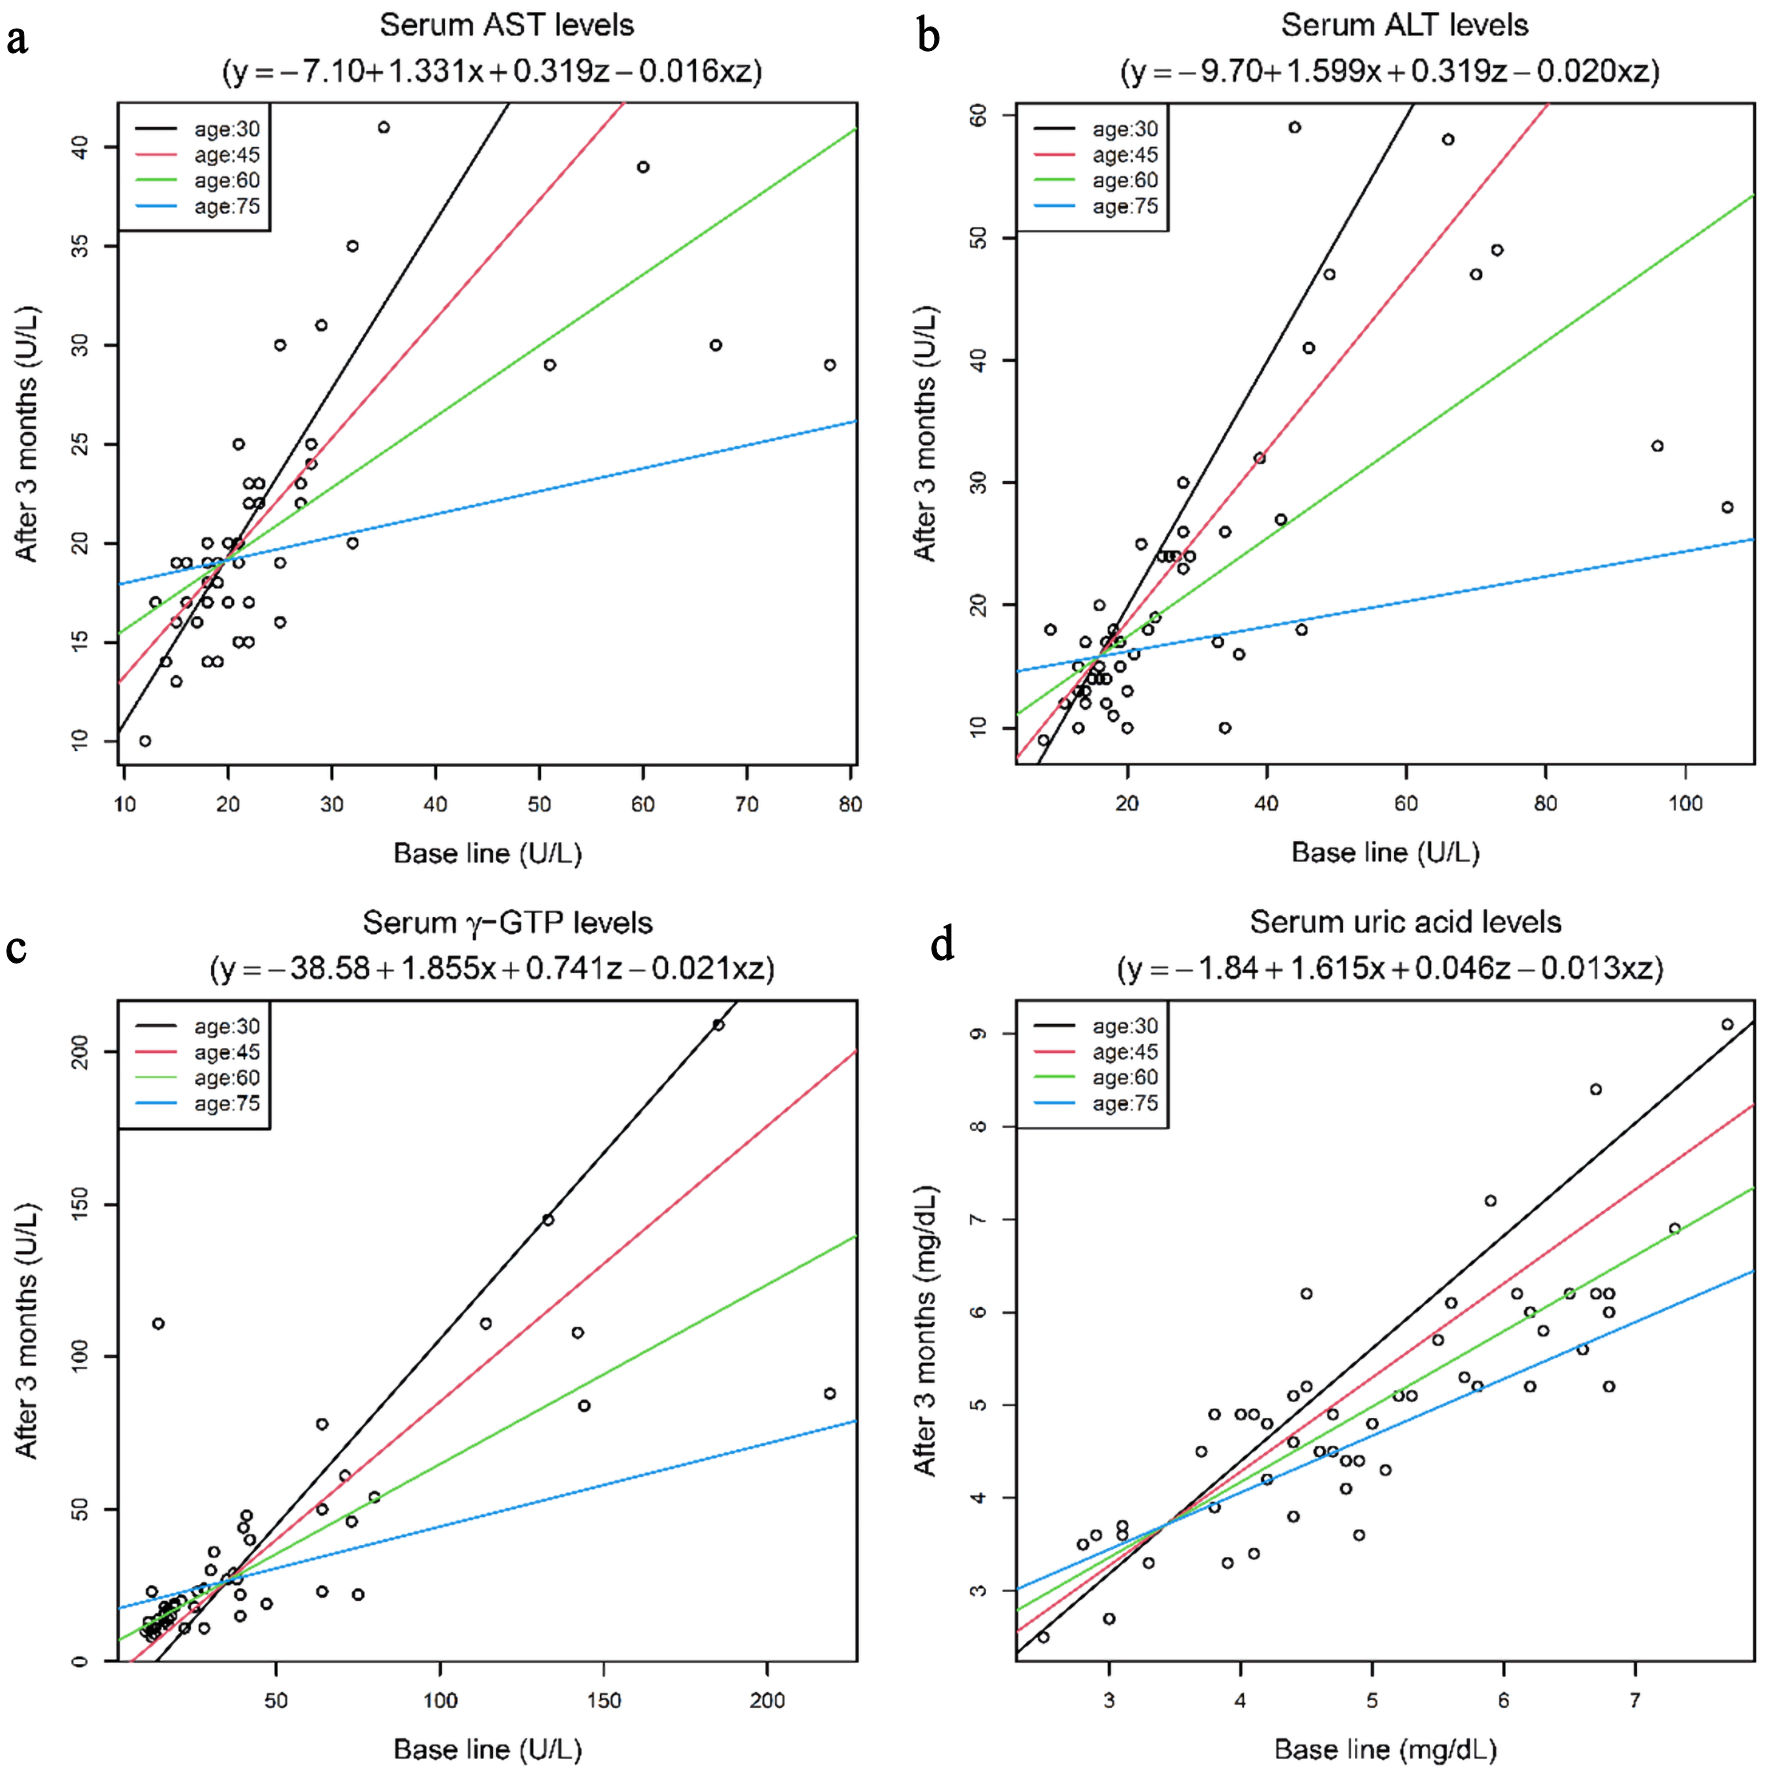
↓  Figure 1. Scatter plot of the serum AST, ALT, γ-GTP, and uric acid levels before and after 3 months of imeglimin treatment, with regression line for each age group. (a) Serum AST levels. (b) Serum ALT levels. (c) Serum γ-GTP levels. (d) Serum uric acid levels. In the equations, x represents baseline values, y represents values after 3 months, and z represents age. N = 52. Regression analysis was performed. AST: aspartate aminotransferase; ALT: alanine aminotransferase; γ-GTP: γ-glutamyl transferase.
Figure 1.

Tables

↓  Table 1. Patient Characteristics at Baseline
 
GroupImeglimin
Data are expressed as means ± SD. SD: standard deviation.
N52
Duration of diabetes (years)10 ± 7
Male/female35/14
Age (years)63 ± 14
Age distribution (n)
  30s1
  40s11
  50s13
  60s12
  70s9
  80s6
  90s1


↓  Table 2. Responses to Imeglimin in Japanese Patients With Type 2 Diabetes Mellitus (N = 52 (Male: 35; Female: 17))
 
Before3 months of therapy95% CI of difference
Data are expressed as means ± SD. *P < 0.05, **P < 0.01. BMI: body mass index; HbA1c: hemoglobin A1c; LDL-C: low-density lipoprotein cholesterol; HDL-C: high-density lipoprotein cholesterol; AI index: atherogenic index; L/H: LDL-C/HDL-C; AST: aspartate aminotransferase; ALT: alanine aminotransferase; γ-GTP: γ-glutamyl transpeptidase; Cre: creatinine; eGFR: estimated glomerular filtration rate; BUN: blood urea nitrogen; CI: confidence interval; SD: standard deviation.
Body weight (kg)74.8 ± 22.073.5 ± 22.3**–2.2, –0.4
BMI (kg/m2)27.2 ± 6.826.7 ± 6.9**–0.81, –0.19
HbA1c (%)8.6 ± 1.17.7 ± 1.0**–1.2, –0.6
Total cholesterol (mg/dL)190 ± 39177 ± 43**–21, –4
LDL-C (mg/dL)106 ± 3297 ± 33**–16, –2
HDL-C (mg/dL)57 ± 2056 ± 17–3.9, 1.9
Non-HDL-C (mg/dL)133± 38121 ± 42**–20, –3
Triglycerides (mg/dL)191 ± 137188 ± 278–86, 81
AI index2.6 ± 1.22.4 ± 1.1*–0.59, –0.01
L/H2.0 ± 0.81.9 ± 0.8**–0.34, –0.06
AST (U/L)24.2± 12.920.8 ± 6.4*–6.6, –0.2
ALT (U/L)28.8 ± 20.821.9 ± 12.0**–12.0, –2.0
γ-GTP (U/L)44.4 ± 46.536.9 ± 39.8–16.5, 1.5
Cre0.8 ± 0.30.8 ± 0.3–0.03, 0.03
eGFR75 ± 2275 ± 20–2.5, 3.1
BUN17.1 ± 4.617.0 ± 4.3–1.4, 1.2
Amylase (IU/L)74.5 ± 36.474.4 ± 30.6–8.1, 7.9
Uric acid (mg/dL)4.9 ± 1.34.9 ± 1.3–0.24, 0.24