Journal of Endocrinology and Metabolism, ISSN 1923-2861 print, 1923-287X online, Open Access
Article copyright, the authors; Journal compilation copyright, J Endocrinol Metab and Elmer Press Inc
Journal website https://jem.elmerpub.com

Original Article

Volume 16, Number 5, October 2026, pages 217-227


Prevalence, Geographic Distribution, and Socioeconomic Disparities of Normal-Weight Central Obesity: An Analysis of 46,493 Adults

Figures

↓  Figure 1. Geographic distribution of the prevalence of normal-weight central obesity (NWCO) by department among Peruvian adults with normal body mass index (BMI), ENDES 2018–2024. (a) Department-level point map using the corrected estimand among adults with normal BMI (range: 24.0–41.9%). (b) LISA classification; no statistically significant local clusters were identified. Global Moran’s I = 0.167 (Monte Carlo P = 0.070).
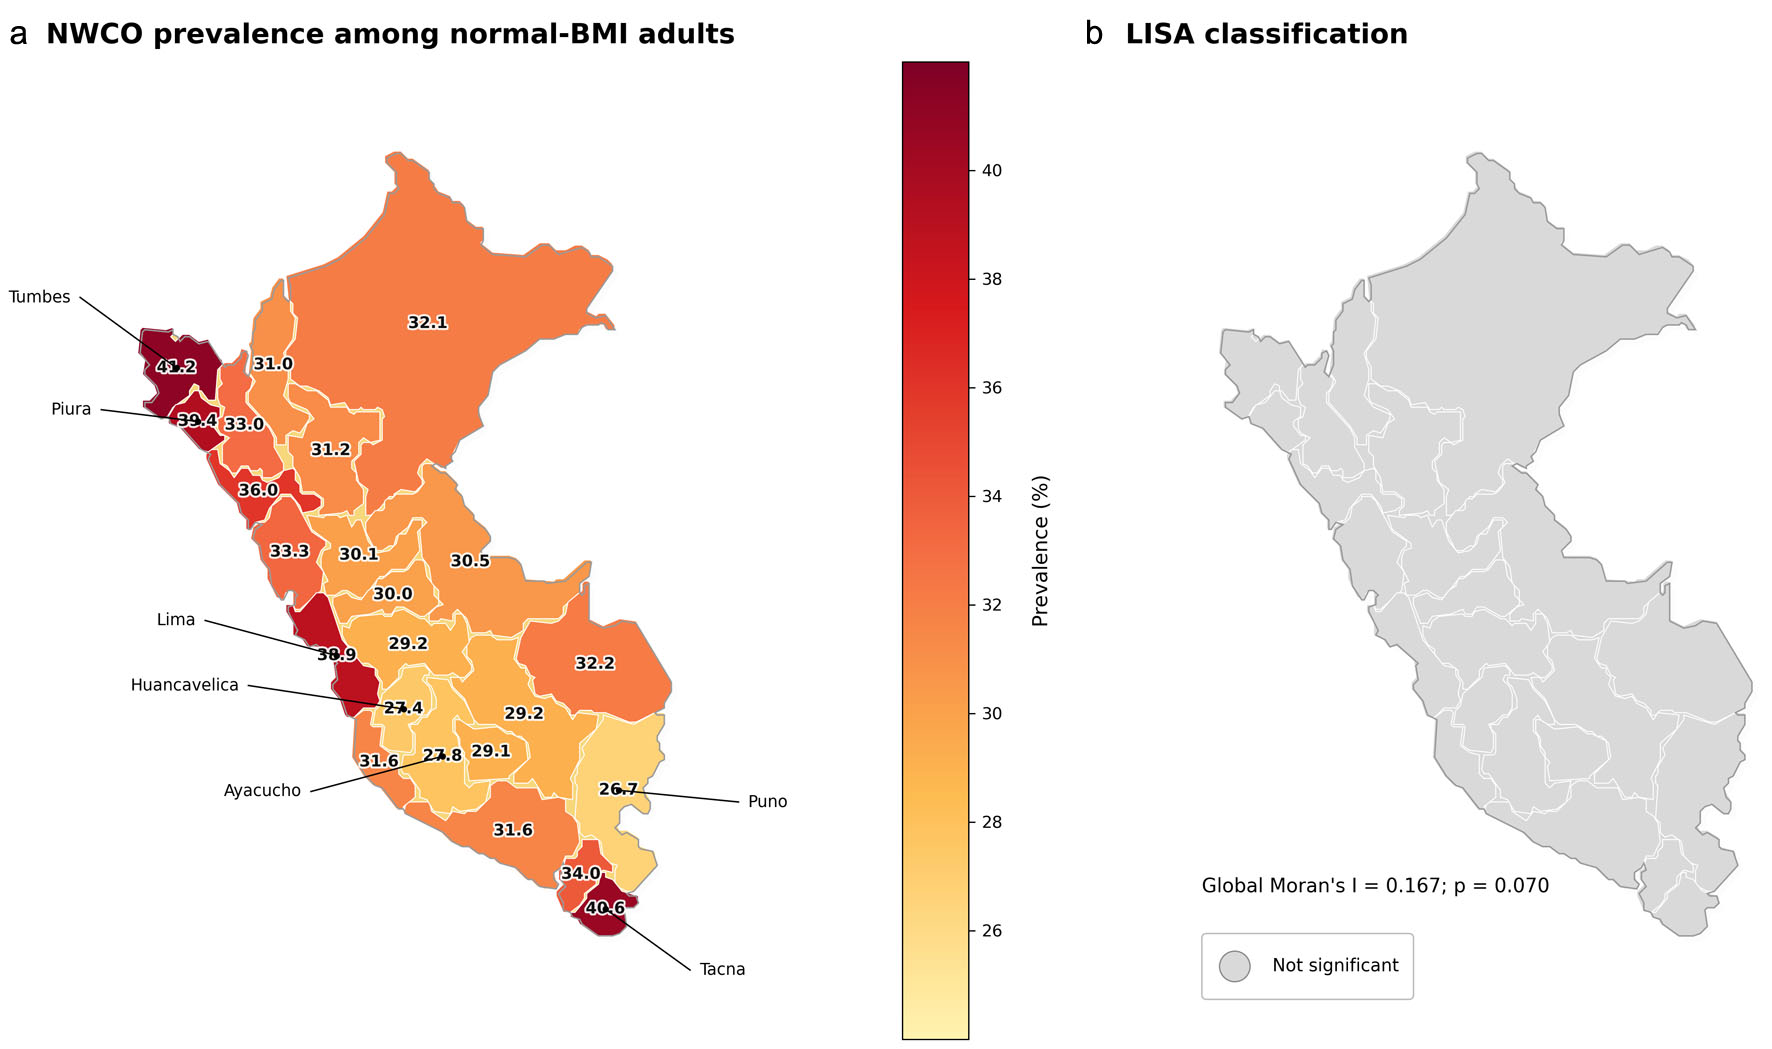
Figure 1.
↓  Figure 2. Concentration curve for normal-weight central obesity (NWCO) by wealth index, ENDES 2018–2024. The curve below the diagonal indicates concentration among higher wealth groups. Concentration index = 0.100.
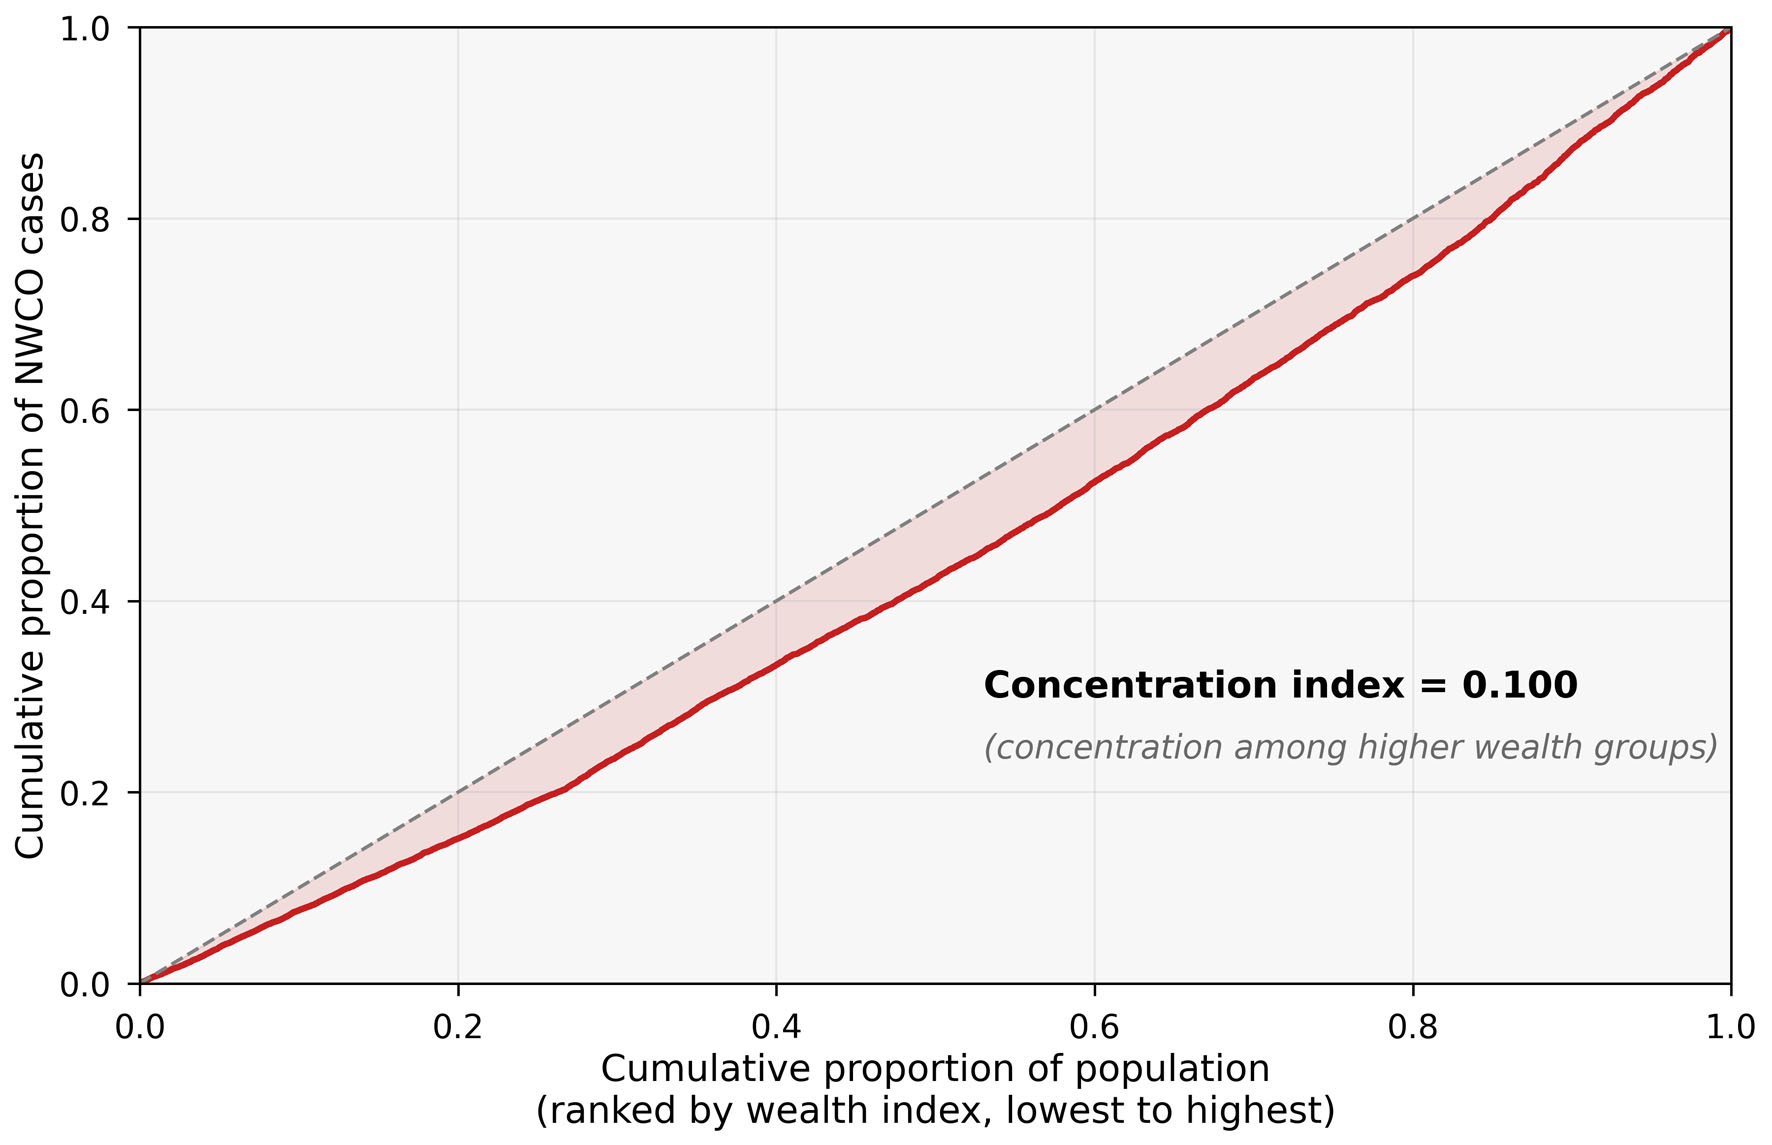
Figure 2.
↓  Figure 3. Temporal trends in normal-weight central obesity (NWCO) prevalence overall and by sex, ENDES 2018–2024. Annual change was not statistically significant overall (−0.46 pp/year, P = 0.172), among men (−0.21 pp/year, P = 0.356), or among women (−0.63 pp/year, P = 0.101).
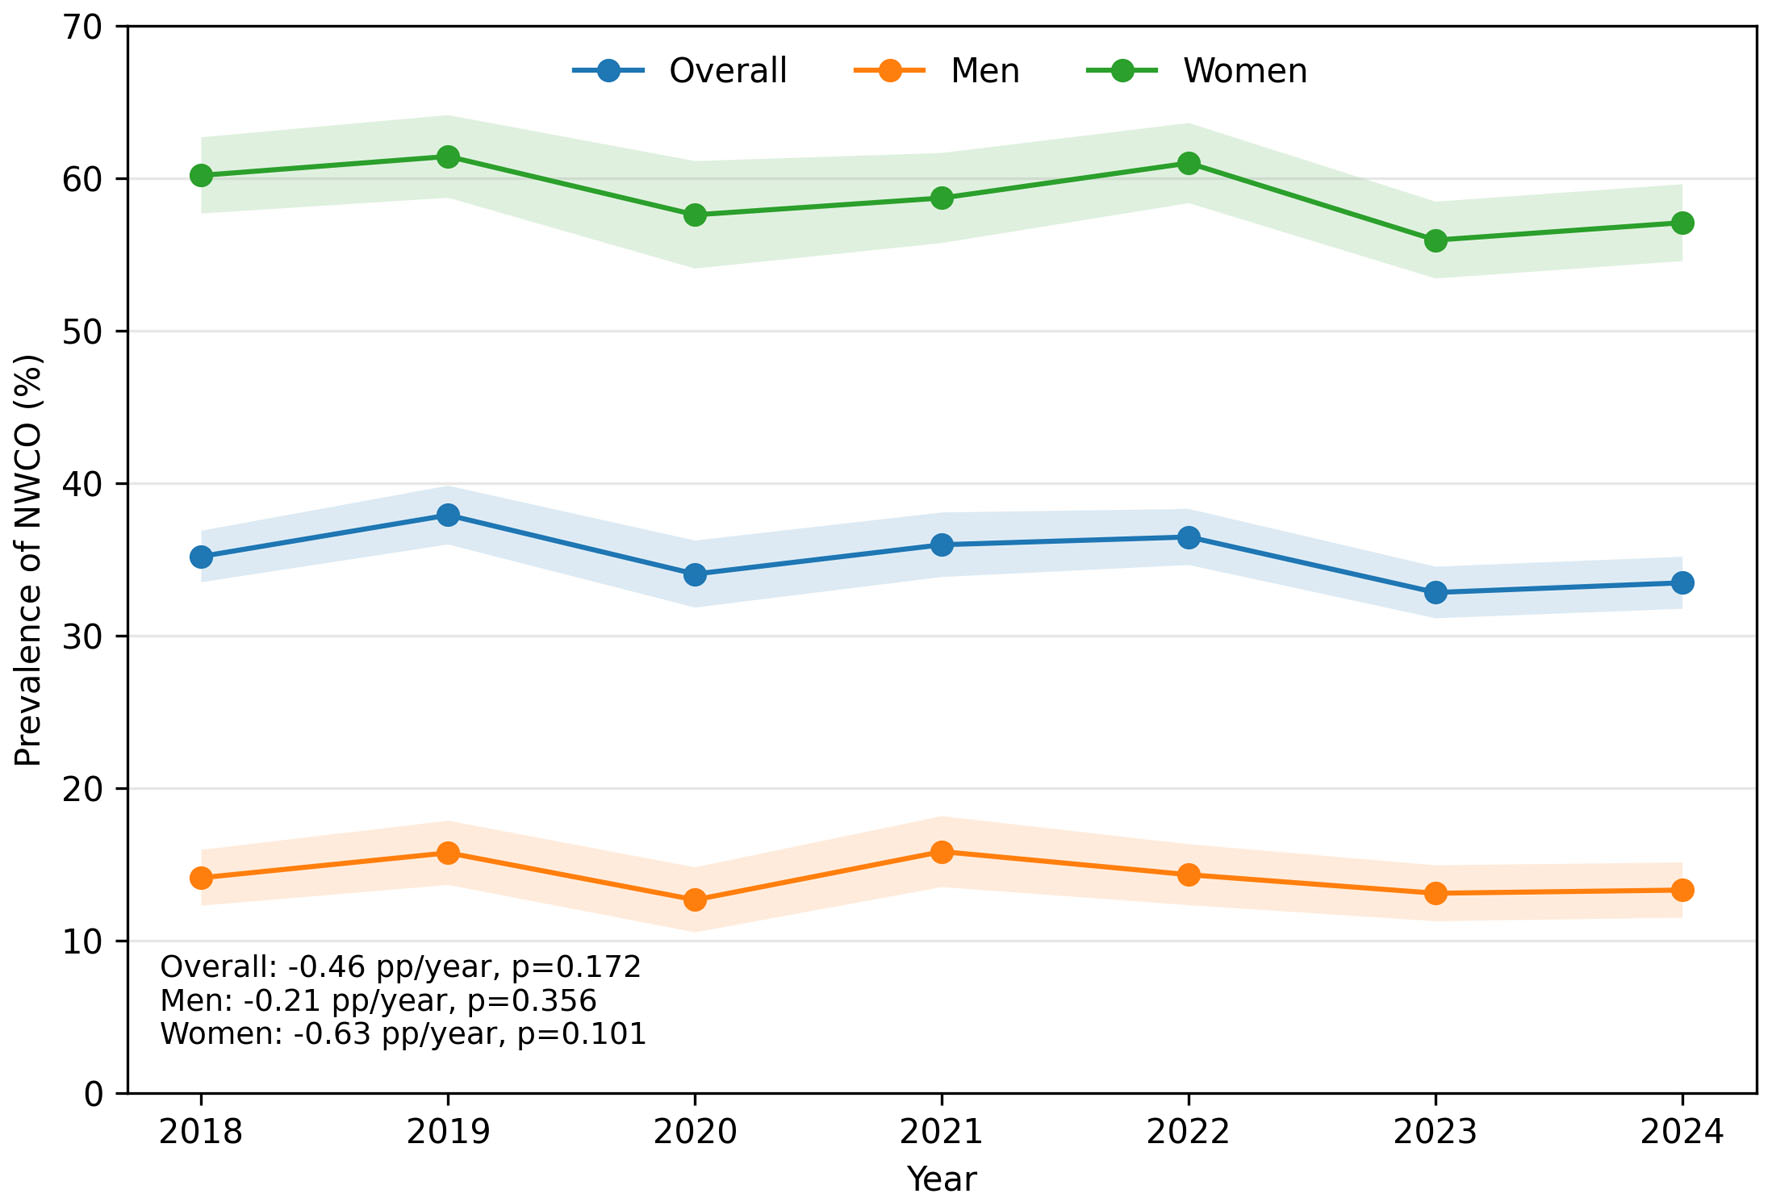
Figure 3.

Tables

↓  Table 1. Characteristics of Peruvian Adults According to Body Weight Phenotype and Central Obesity, ENDES 2018–2024
 
CharacteristicNW without CO (n = 30,586)NWCO (n = 15,907)OW/OB without CO (n = 8,173)OW/OB with CO (n = 84,568)Total (N = 139,234)
Values are weighted percentages or weighted means. Percentages are column percentages within each phenotype. NW: normal weight; NWCO: normal-weight central obesity; OW/OB: overweight/obesity; CO: central obesity; WC: waist circumference; BMI: body mass index; SD: standard deviation.
Sex
  Female29.778.622.354.351.8
  Male70.321.477.745.748.2
Age, years, mean (SD)36.9 (18.2)44.8 (19.7)34.8 (12.3)44.9 (16.2)42.6 (17.1)
Age group
  18–2948.529.839.519.826.2
  30–4423.225.141.333.130.8
  45–5913.418.914.927.023.1
  ≥ 6014.826.24.220.119.0
Wealth index
  Lowest wealth quintile (Q1)28.719.319.612.016.0
  Low wealth quintile (Q2)21.219.024.219.119.6
  Middle (Q3)19.319.421.422.321.3
  High wealth quintile (Q4)16.619.519.423.121.4
  Highest wealth quintile (Q5)14.222.715.523.621.7
Area of residence
  Urban72.680.980.887.583.8
  Rural27.419.119.212.516.2
WC, cm, mean (SD)79.4 (5.5)87.9 (5.9)84.1 (6.0)99.5 (9.2)93.8 (11.5)
BMI, kg/m2, mean (SD)22.3 (1.6)23.5 (1.3)26.9 (2.4)30.2 (4.0)28.1 (4.6)


↓  Table 2. Prevalence of NWCO Among Peruvian Adults With Normal Weight by Sociodemographic Characteristics, ENDES 2018–2024
 
CharacteristicPrevalence (%)95% CI
Values are weighted percentages. Prevalences are estimated among adults with normal BMI. NWCO: normal-weight central obesity; CI: confidence interval.
Overall35.134.4–35.9
Sex
  Female58.957.9–60.0
  Male14.213.4–14.9
Age group
  18–2925.024.0–25.9
  30–4436.935.6–38.2
  45–5943.341.3–45.3
  ≥ 6048.947.1–50.8
Wealth index
  Lowest wealth quintile (Q1)26.725.9–27.6
  Low wealth quintile (Q2)32.731.4–34.1
  Middle (Q3)35.233.6–36.9
  High wealth quintile (Q4)39.037.0–41.0
  Highest wealth quintile (Q5)46.443.2–49.7
Area of residence
  Urban37.636.7–38.6
  Rural27.526.6–28.3
Natural region
  Metropolitan Lima38.536.7–40.2
  Rest of the Coast38.437.1–39.6
  Highlands30.829.9–31.7
  Jungle30.829.6–31.9


↓  Table 3. Socioeconomic Inequalities in NWCO Prevalence, ENDES 2018–2024
 
IndicatorEstimate95% CIInterpretation
The SII is reported on the proportion scale and interpreted as percentage points after multiplying by 100. A positive concentration index indicates concentration among higher wealth groups. CI: confidence interval; NWCO: normal-weight central obesity; pp: percentage points.
Slope Index of Inequality (SII)0.2270.201–0.25322.7 pp higher at the highest vs. lowest wealth rank
Relative Index of Inequality (RII)1.911.79–2.05Nearly double the prevalence
Concentration index0.100-Concentration among higher wealth groups