Figures
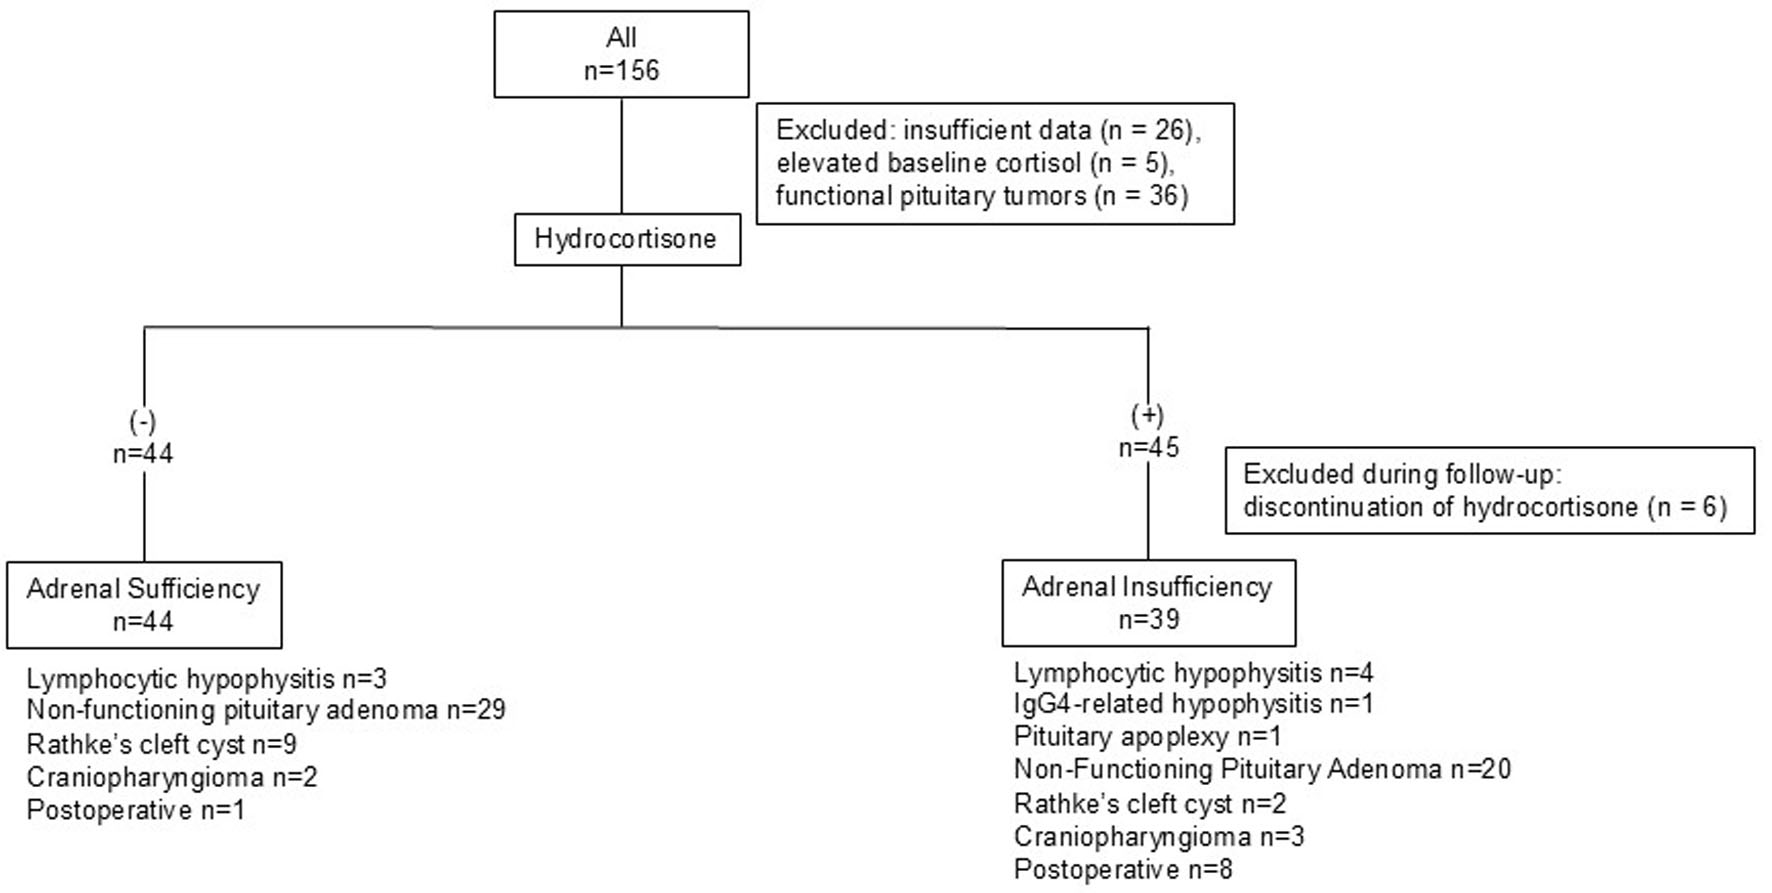
↓ Figure 1. Study design. Flow diagram of patient selection and etiological classification. Among 156 patients, those with insufficient data, elevated baseline cortisol, or functional pituitary tumors were excluded. Then, patients were stratified according to hydrocortisone use (−, n = 44; +, n = 45), with additional exclusions for discontinuation during follow-up. The final cohorts comprised the adrenal sufficiency group (hydrocortisone −, n = 44) and the adrenal insufficiency group (hydrocortisone +, n = 39), along with their underlying etiologies.
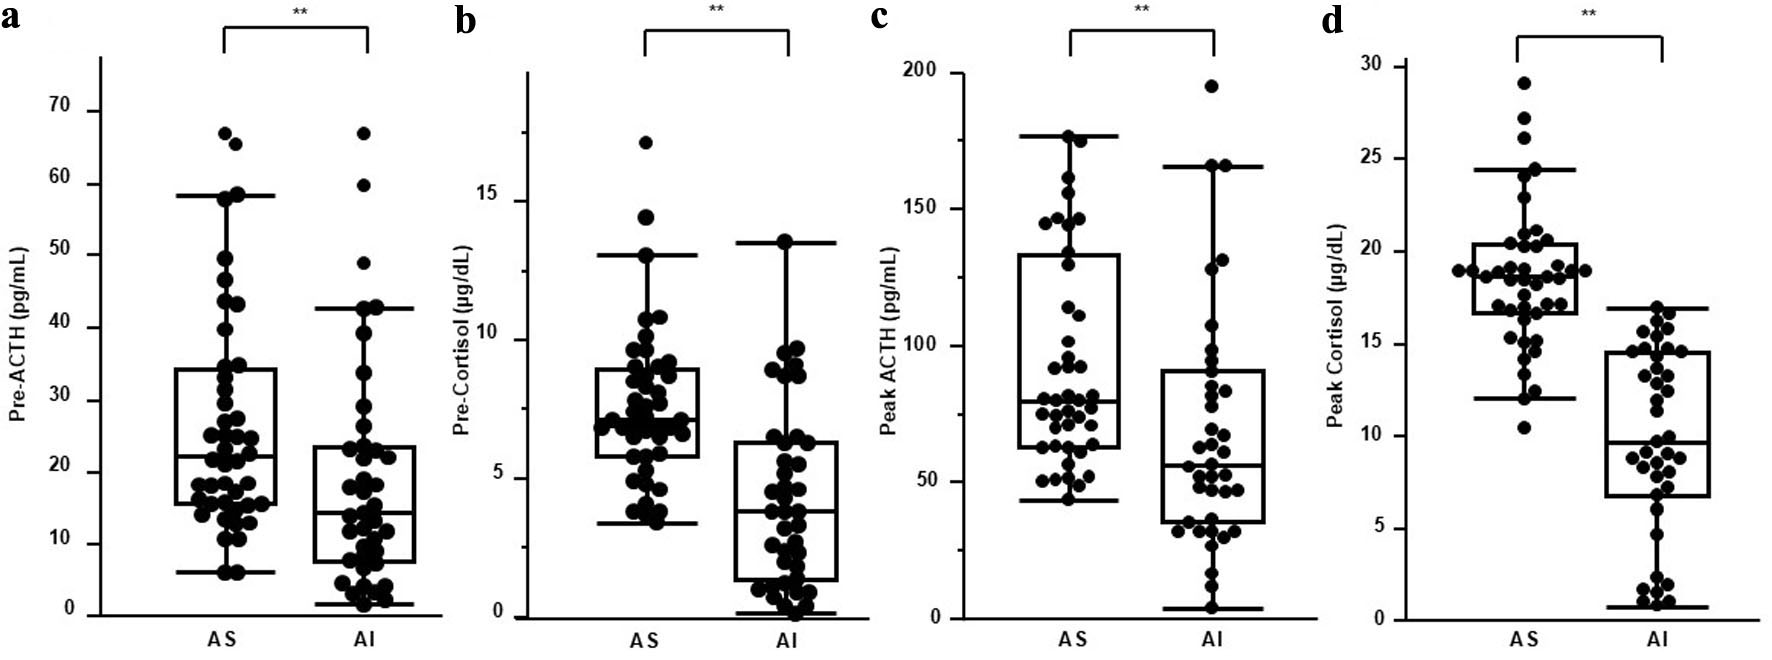
↓ Figure 2. Baseline and peak CRH-stimulated ACTH and cortisol levels. Comparison of basal and CRH-stimulated hormone levels between patients with AS and those with AI. (a) Baseline plasma ACTH levels (pre-ACTH), (b) baseline serum cortisol levels (pre-cortisol), (c) peak ACTH levels (peak ACTH), and (d) peak serum cortisol levels (peak cortisol) during the CRH stimulation test are shown for the AS and AI groups. Box plots show the median (horizontal line), interquartile range (box), whiskers, and individual data points. Baseline and peak hormone levels are significantly lower in the AI group than in the AS group (P < 0.01). For optimal visualization of the primary data distributions, extreme outliers exceeding 200 pg/mL for peak ACTH in panel (c) and 30 µg/dL for peak cortisol in panel (d) were omitted from the plots; however, all data points were fully included in the statistical analyses. ACTH: adrenocorticotropic hormone; AI: adrenal insufficiency; AS: adrenal sufficiency; CRH: corticotropin-releasing hormone.
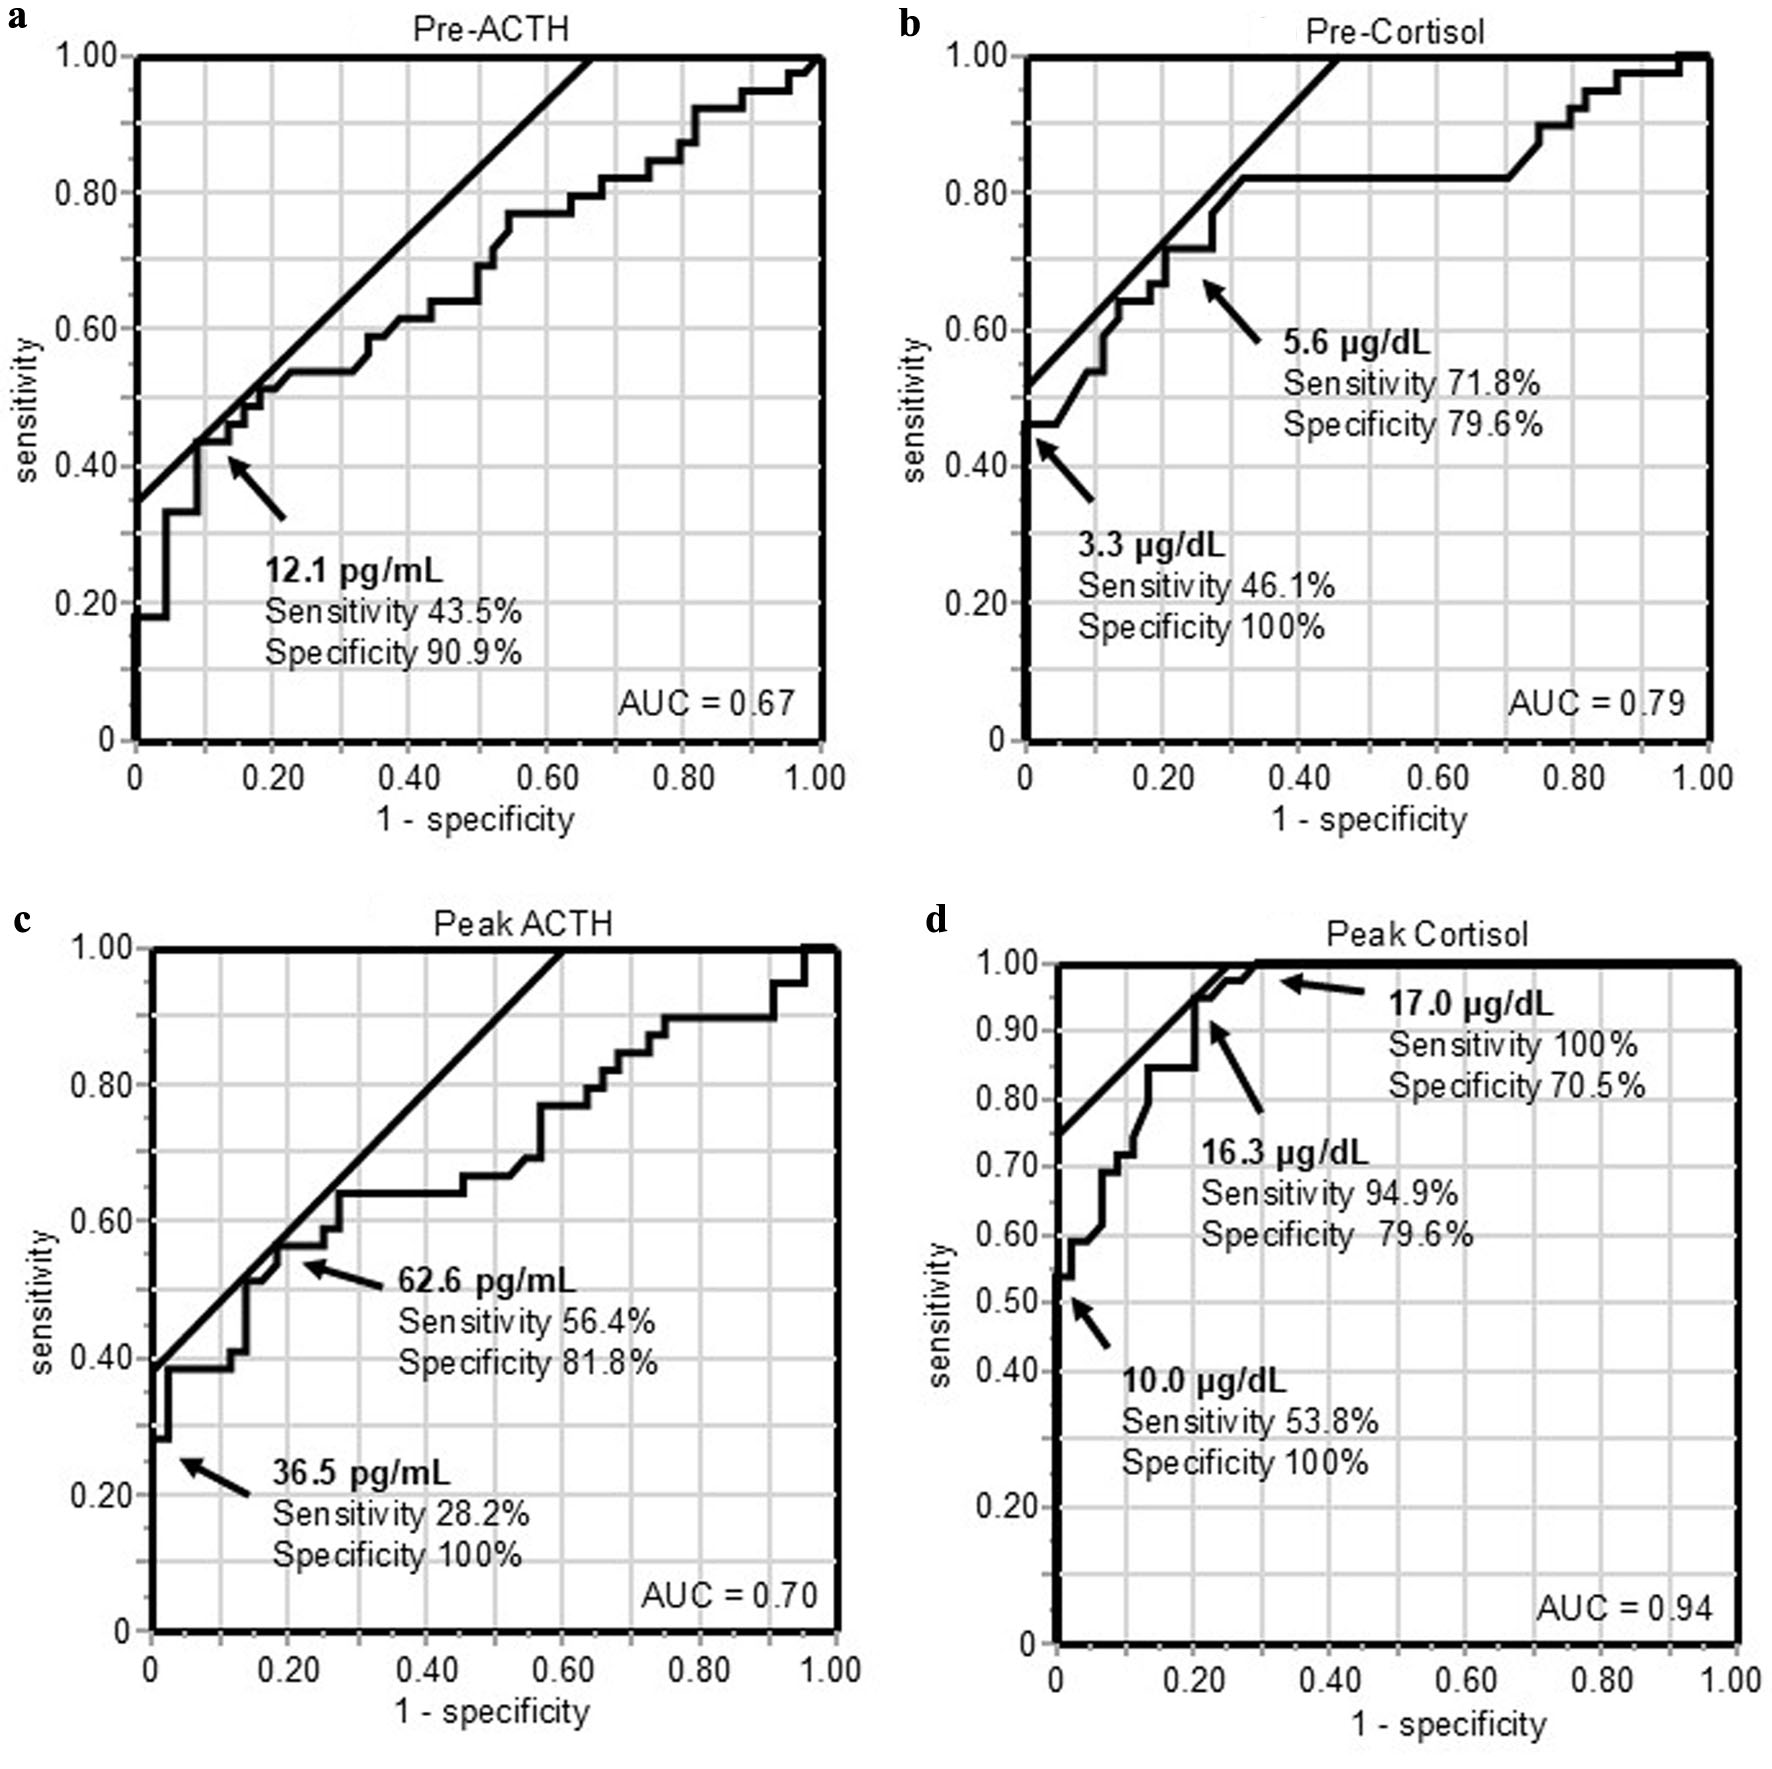
↓ Figure 3. ROC curves for baseline and CRH-stimulated peak ACTH and cortisol levels in diagnosing central adrenal insufficiency. ROC curves for CRH test parameters in the diagnosis of adrenal insufficiency. (a) Pre-ACTH, (b) pre-cortisol, (c) peak ACTH, and (d) peak cortisol levels. The AUC is shown in each panel. Arrows indicate optimal cutoff values determined by the Youden index; alternative cutoff values providing 100% sensitivity or specificity are also indicated where applicable. ACTH: adrenocorticotropic hormone; AUC: area under the curve; CRH: corticotropin-releasing hormone; ROC: receiver operating characteristic.
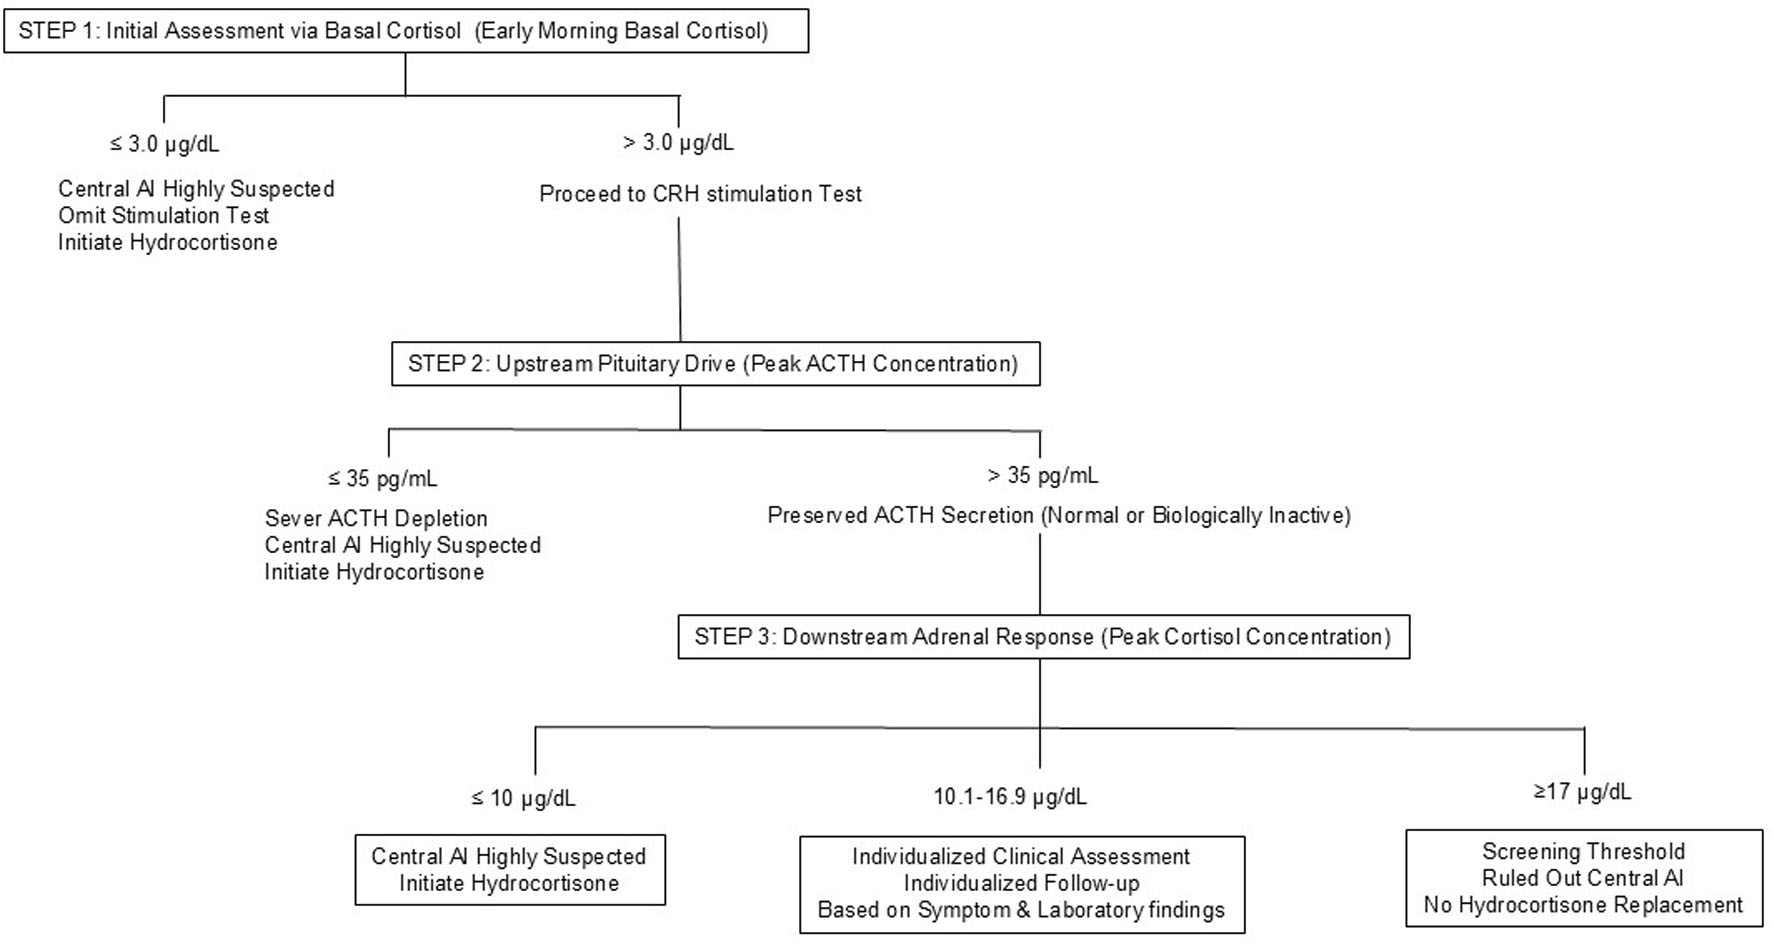
↓ Figure 4. Proposed sequential clinical approach for the evaluation and management of central AI. Step 1 uses early morning basal cortisol to identify patients highly suggestive of central AI (≤ 3.0 µg/dL), for whom omission of further stimulation testing and initiation of hydrocortisone replacement may be considered. Step 2 assesses the upstream pituitary response, where a peak ACTH concentration ≤ 35 pg/mL was consistently associated with central AI in our cohort. For patients with peak ACTH concentrations > 35 pg/mL, in whom biologically inactive ACTH or exaggerated ACTH responses may be present, Step 3 evaluates the downstream adrenal response using peak cortisol concentrations. Patients are categorized into three practical groups: values ≥ 17.0 µg/dL (screening threshold), values ≤ 10.0 µg/dL (highly suggestive of central AI), and intermediate values of 10.1–16.9 µg/dL requiring individualized clinical assessment based on symptoms and laboratory findings. ACTH: adrenocorticotropic hormone; AI: adrenal insufficiency; CRH: corticotropin-releasing hormone.
Tables
↓ Table 1. Eligibility Criteria for the Study Population
| CRH: corticotropin-releasing hormone. |
| Inclusion criteria |
| Patients who underwent the CRH stimulation test at Gunma University Hospital between 2016 and 2020. |
| Presence of structural abnormalities in the pituitary or hypothalamus confirmed by neuroimaging. |
| Exclusion criteria |
| Insufficient clinical or laboratory data. |
| Marked elevation of baseline serum cortisol levels. |
| Presence of functional pituitary adenomas. |
| Prior treatment with corticosteroid treatment at pharmacological doses. |
↓ Table 2. Baseline Characteristics of the AS and AI Groups
| AS | AI | P |
|---|
| ACTH: adrenocorticotropic hormone; AI: adrenal insufficiency group; AS: adrenal sufficiency group; BW: body weight; IQR: interquartile range. |
| No. of patients | 44 | 39 | - |
| Age (years), median (IQR) | 49 (40–63) | 55 (44–66) | 0.2062 |
| Sex (% male) | 45.50% | 58.90% | - |
| Body weight (kg), median (IQR) | 60.5 (54.6–71.8) | 62.2 (57.8–74.0) | 0.6058 |
| Etiology | | | |
| Inflammatory disorders | 3 | 5 | - |
| Pituitary apoplexy | 0 | 1 | - |
| Pituitary tumors without prior surgery | 40 | 25 | - |
| Postoperative pituitary tumors | 1 | 8 | - |
| Severe adult growth hormone deficiency | 18 | 29 | - |
| Hypogonadotropic hypogonadism | 17 | 30 | - |
| Central hypothyroidism | 0 | 22 | - |
| Number of impaired hormonal axes | | | |
| 0 | 18 | 0 | - |
| 1 | 16 | 8 | - |
| 2 | 10 | 2 | - |
| 3 or more | 0 | 29 | - |
| Pre-ACTH (pg/mL), median (IQR) | 22.1 (15.6–34.3) | 14.2 (7.7–23.5) | 0.0067 |
| Pre-cortisol (µg/dL), median (IQR) | 7.1 (5.8–8.9) | 3.8 (1.4–6.3) | < 0.0001 |
| Peak ACTH (pg/mL), median (IQR) | 80.3 (63.6–133.1) | 56.6 (35.5–90.5) | 0.002 |
| Peak cortisol (µg/dL), median (IQR) | 18.7 (16.8–20.5) | 9.8 (6.9–14.6) | < 0.0001 |
↓ Table 3. Delayed Response of ACTH in the CRH Test
| Delayed peak | Non-delayed peak | Total |
|---|
| ACTH: adrenocorticotropic hormone; AI: adrenal insufficiency group; AS: adrenal sufficiency group; CRH: corticotropin-releasing hormone. |
| AS | 14 (32%) | 30 (68%) | 44 |
| AI | 23 (59%) | 16 (41%) | 39 |
| Total | 37 | 46 | 83 |