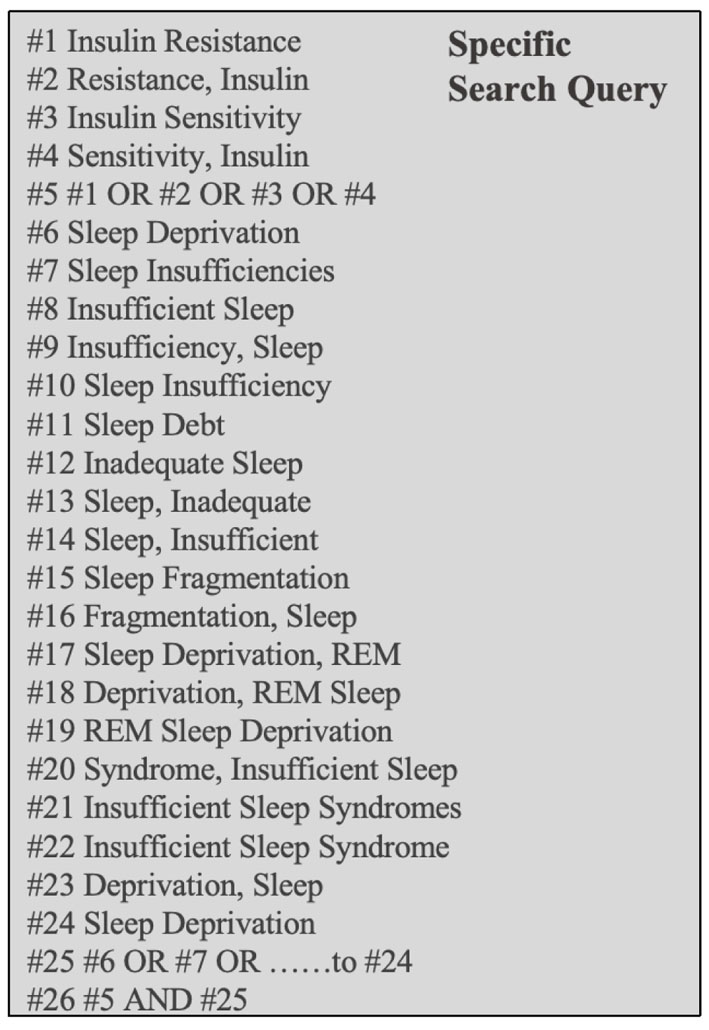
↓ Figure 1. Search strategy illustrating the specific Medical Subject Headings (MeSH) terms included in the query. Logical operators OR and AND were used to refine the search. REM: rapid eye movement.
| Journal of Endocrinology and Metabolism, ISSN 1923-2861 print, 1923-287X online, Open Access |
| Article copyright, the authors; Journal compilation copyright, J Endocrinol Metab and Elmer Press Inc |
| Journal website https://jem.elmerpub.com |
Original Article
Volume 16, Number 5, October 2026, pages 201-216
Sleep Duration and Insulin Resistance: Meta-Analysis Reveals Sleep Restriction Linked to Higher Insulin Resistance, and Mendelian Randomization Suggests Glucagon-Like Peptide-1 Receptor Agonist May Contribute to Sleep Modulation
Figures
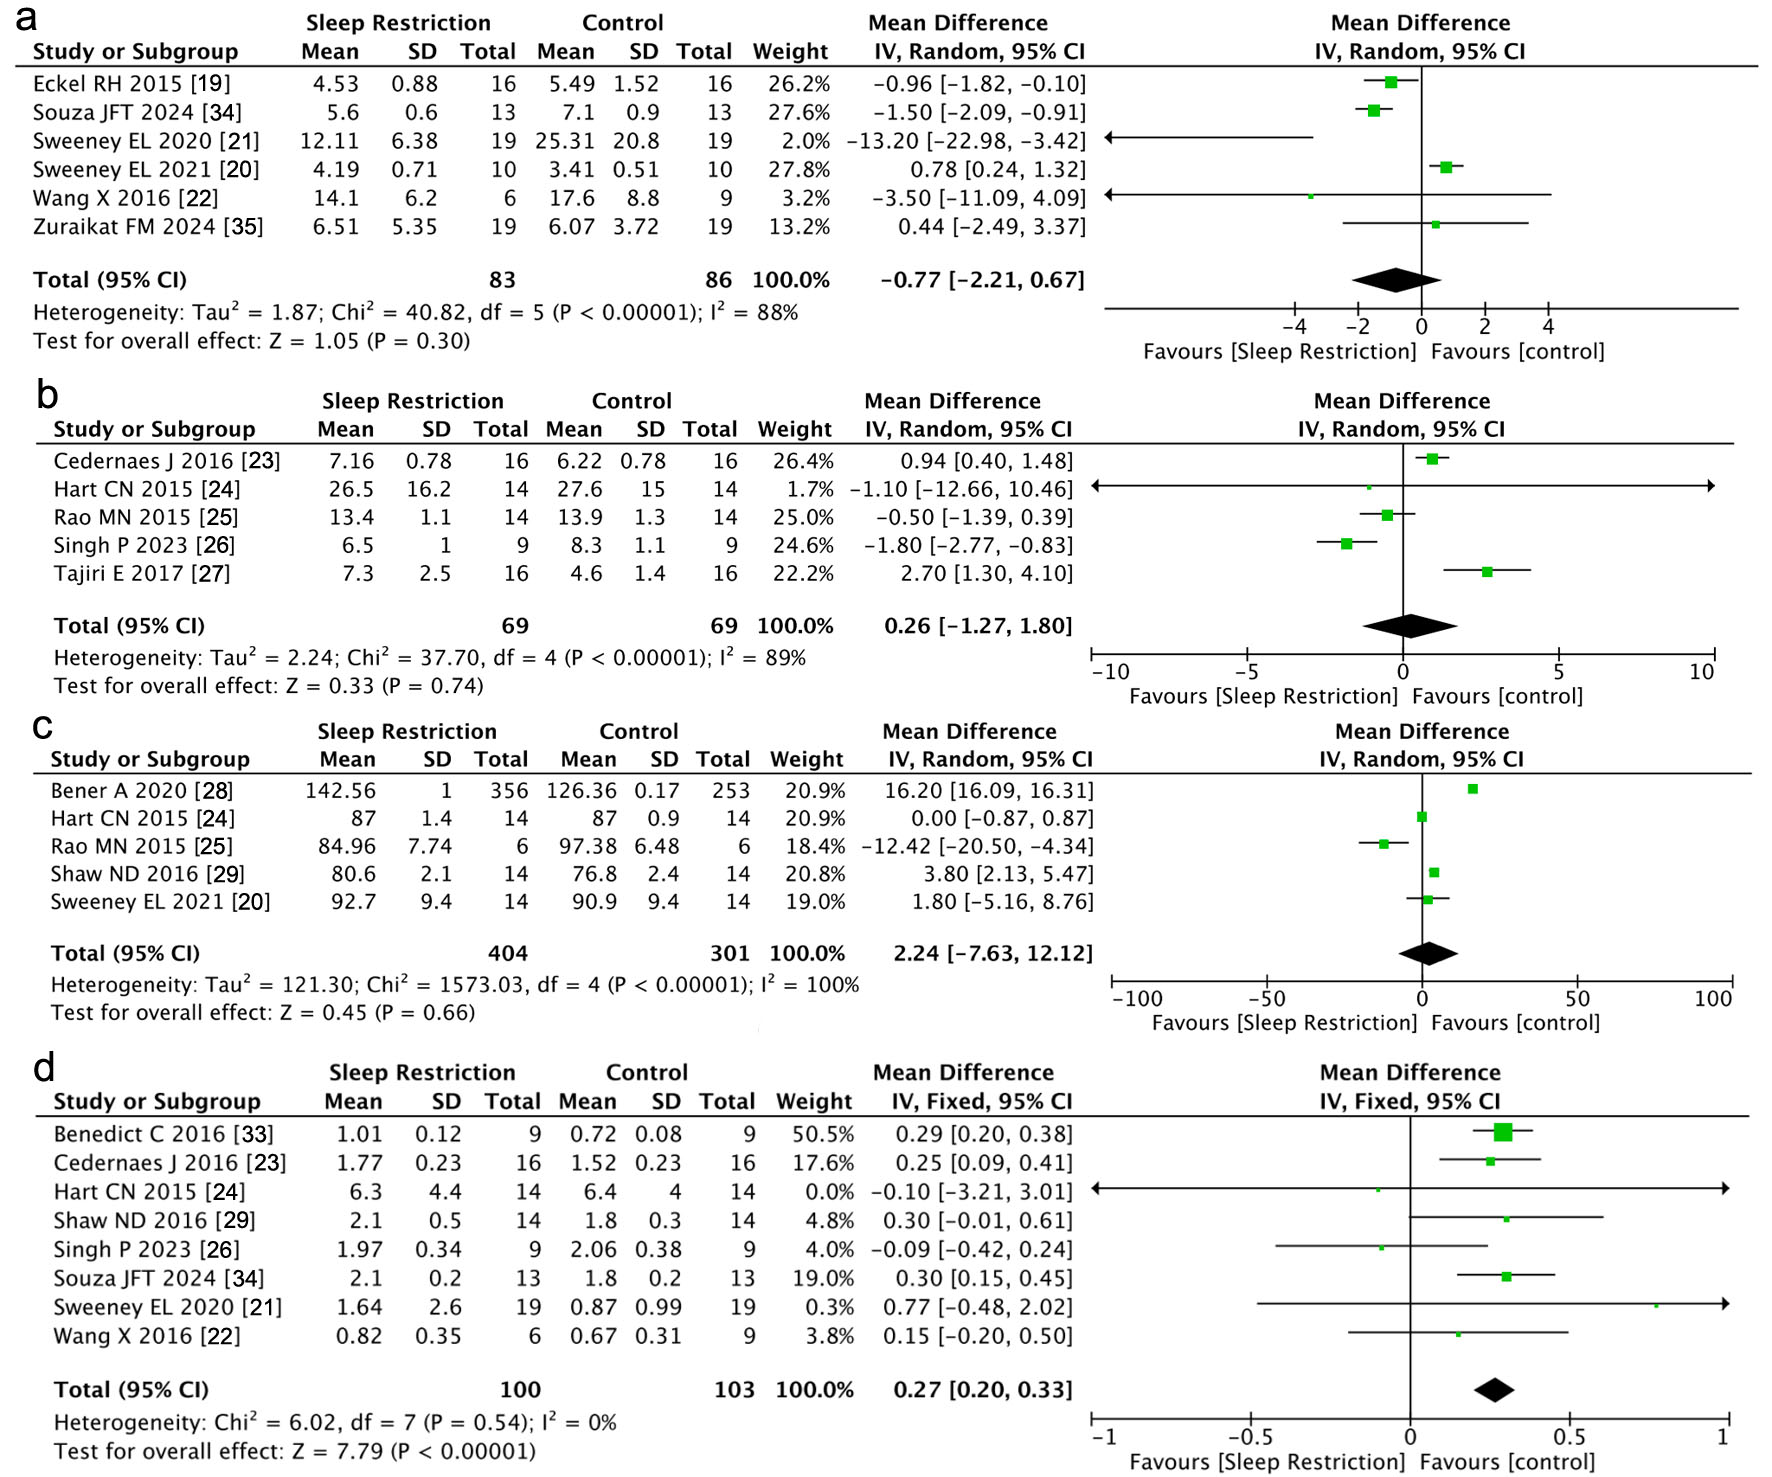

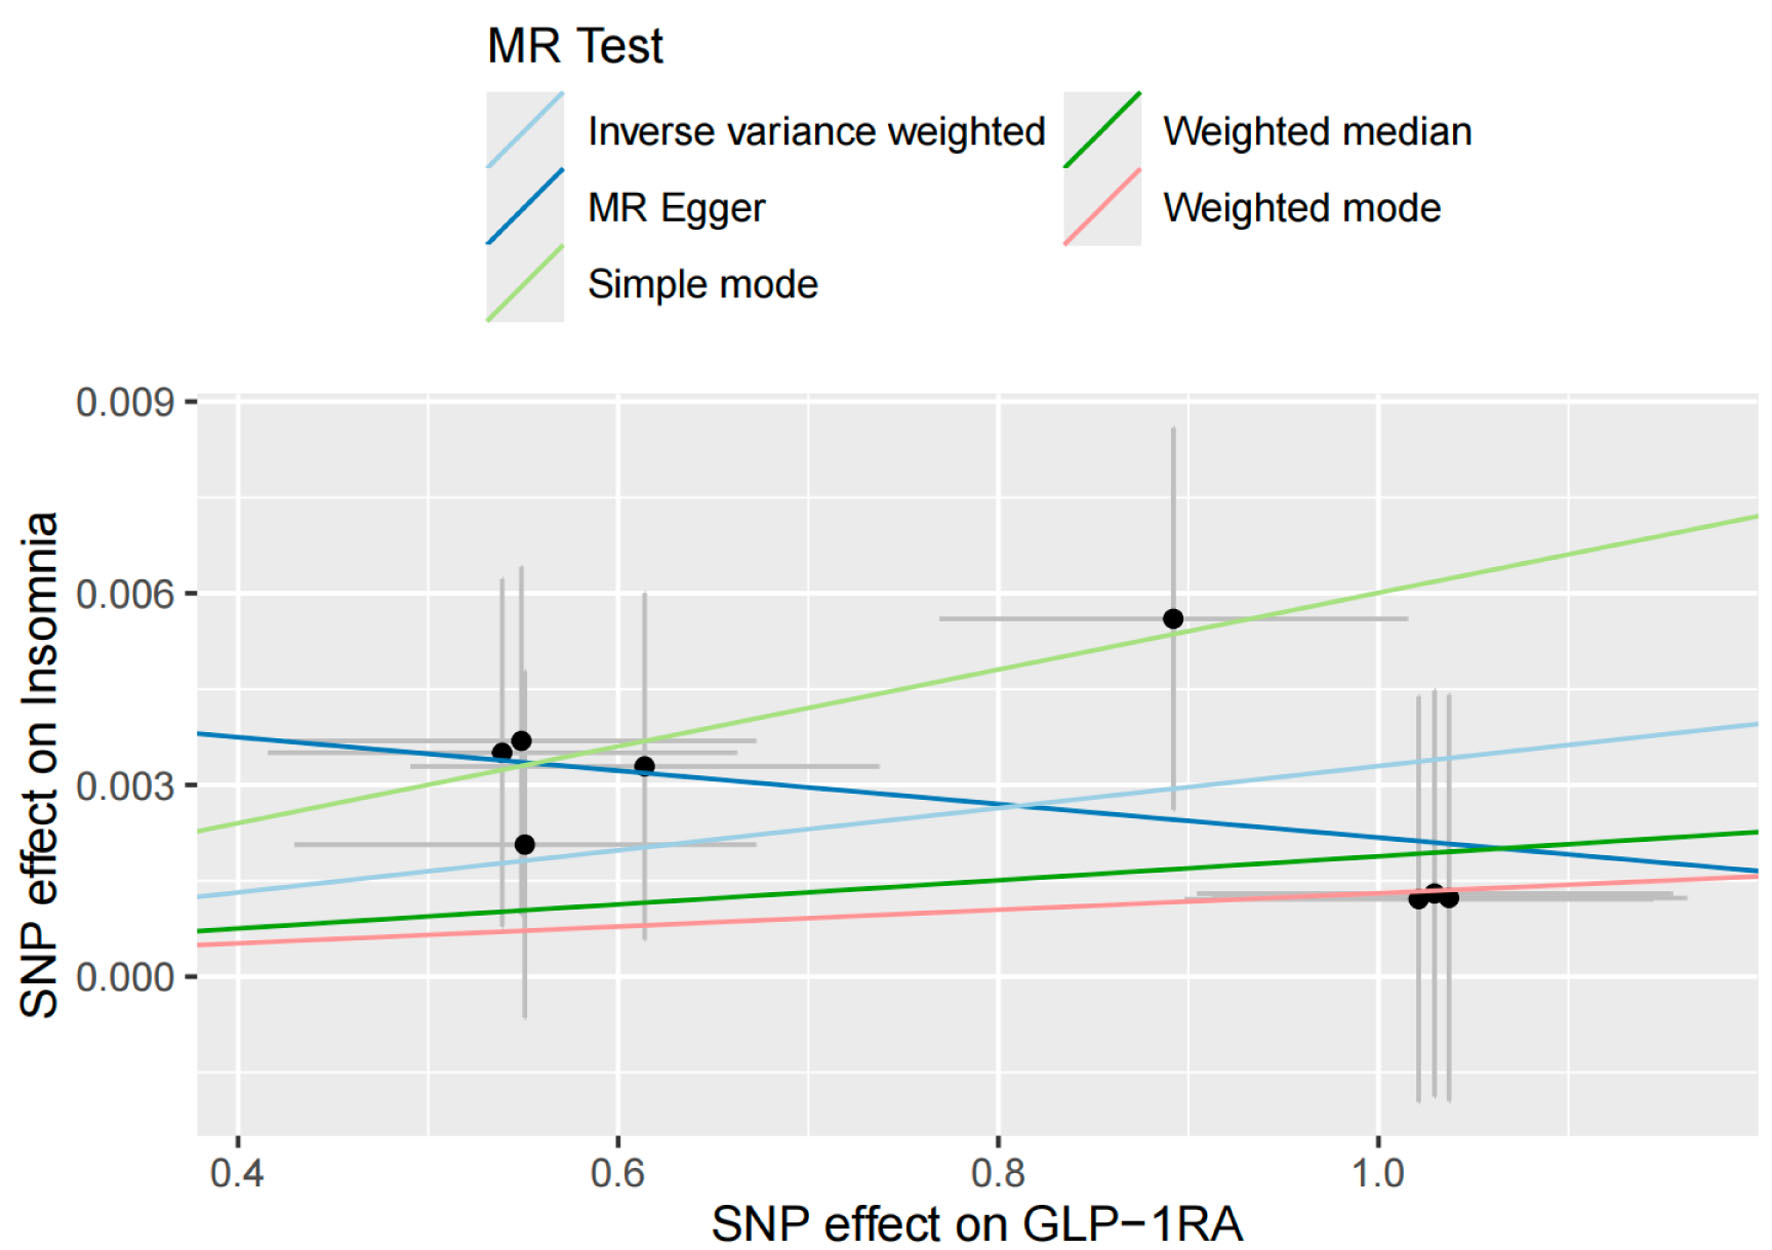
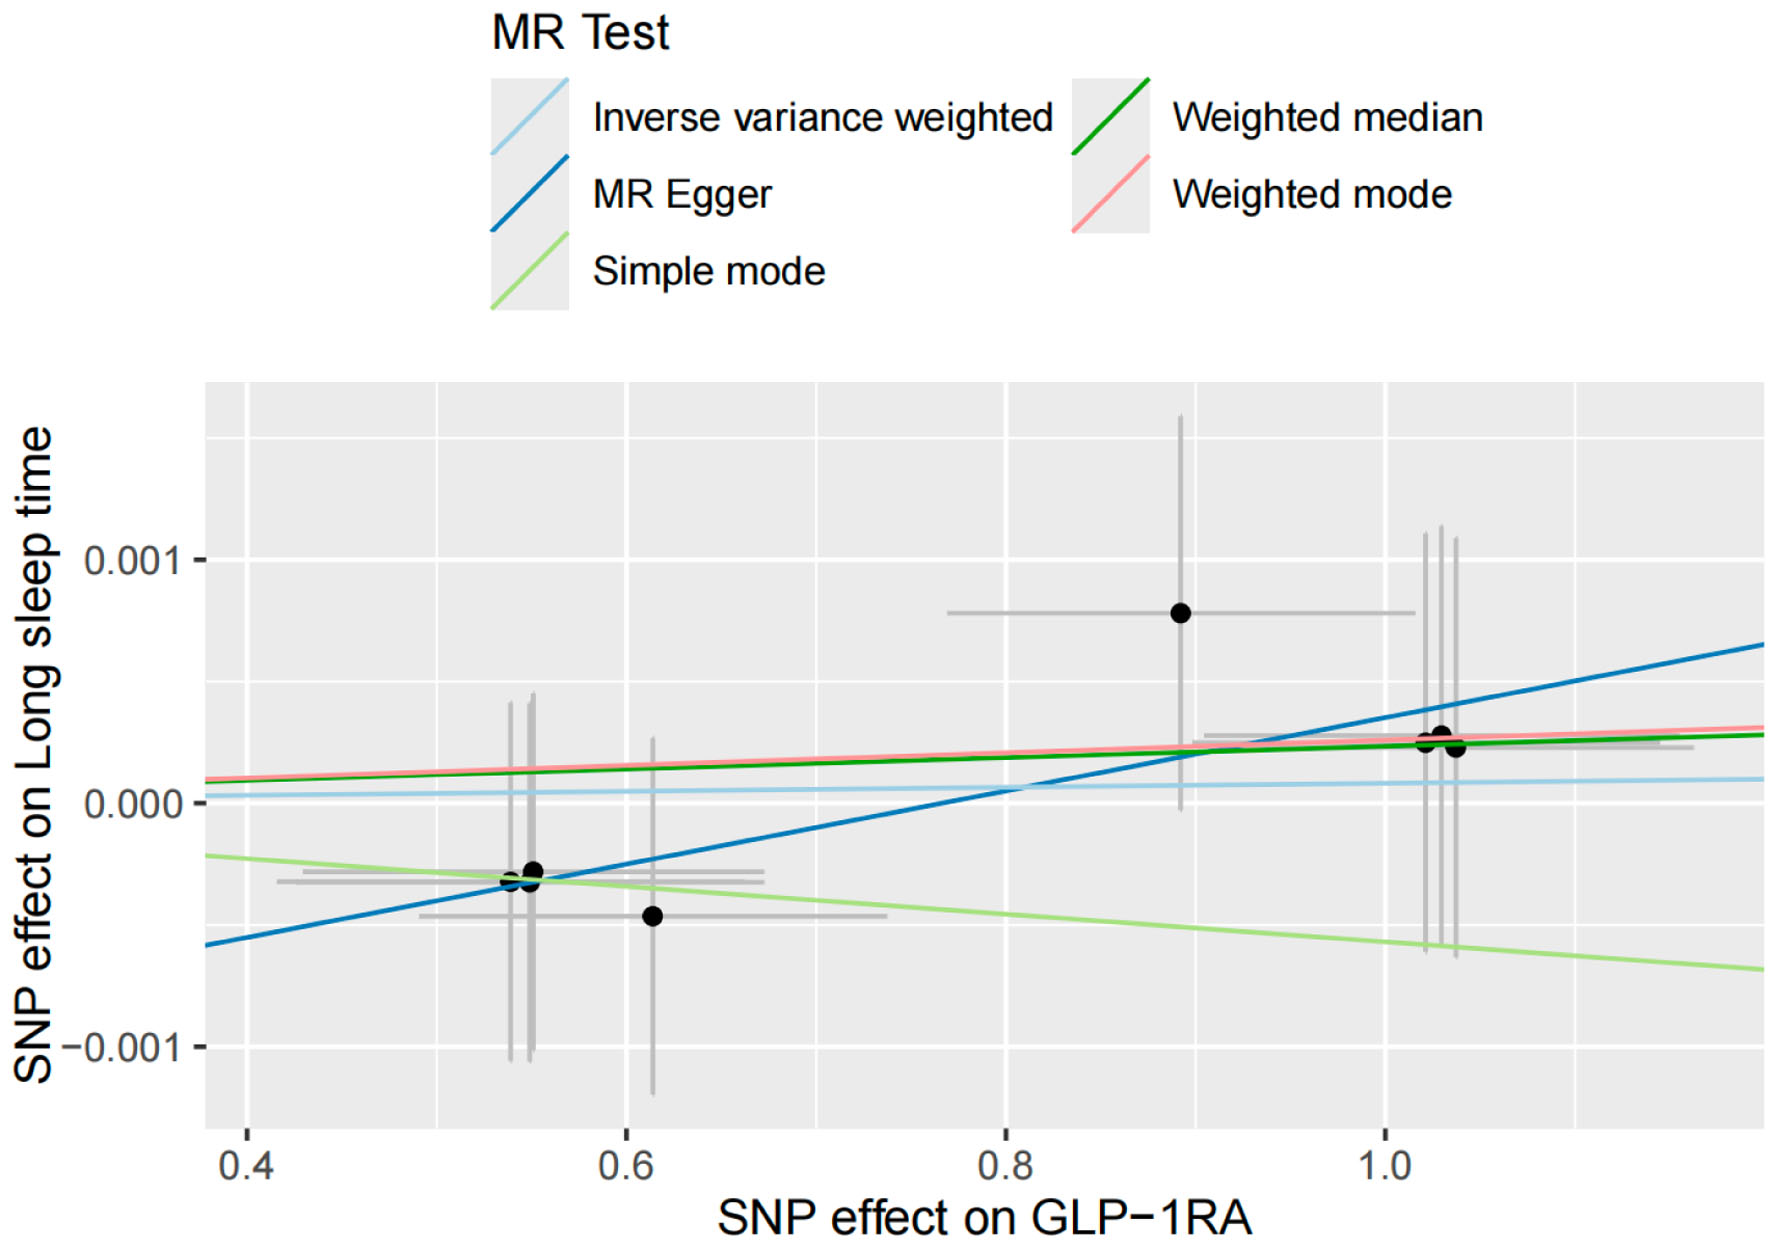
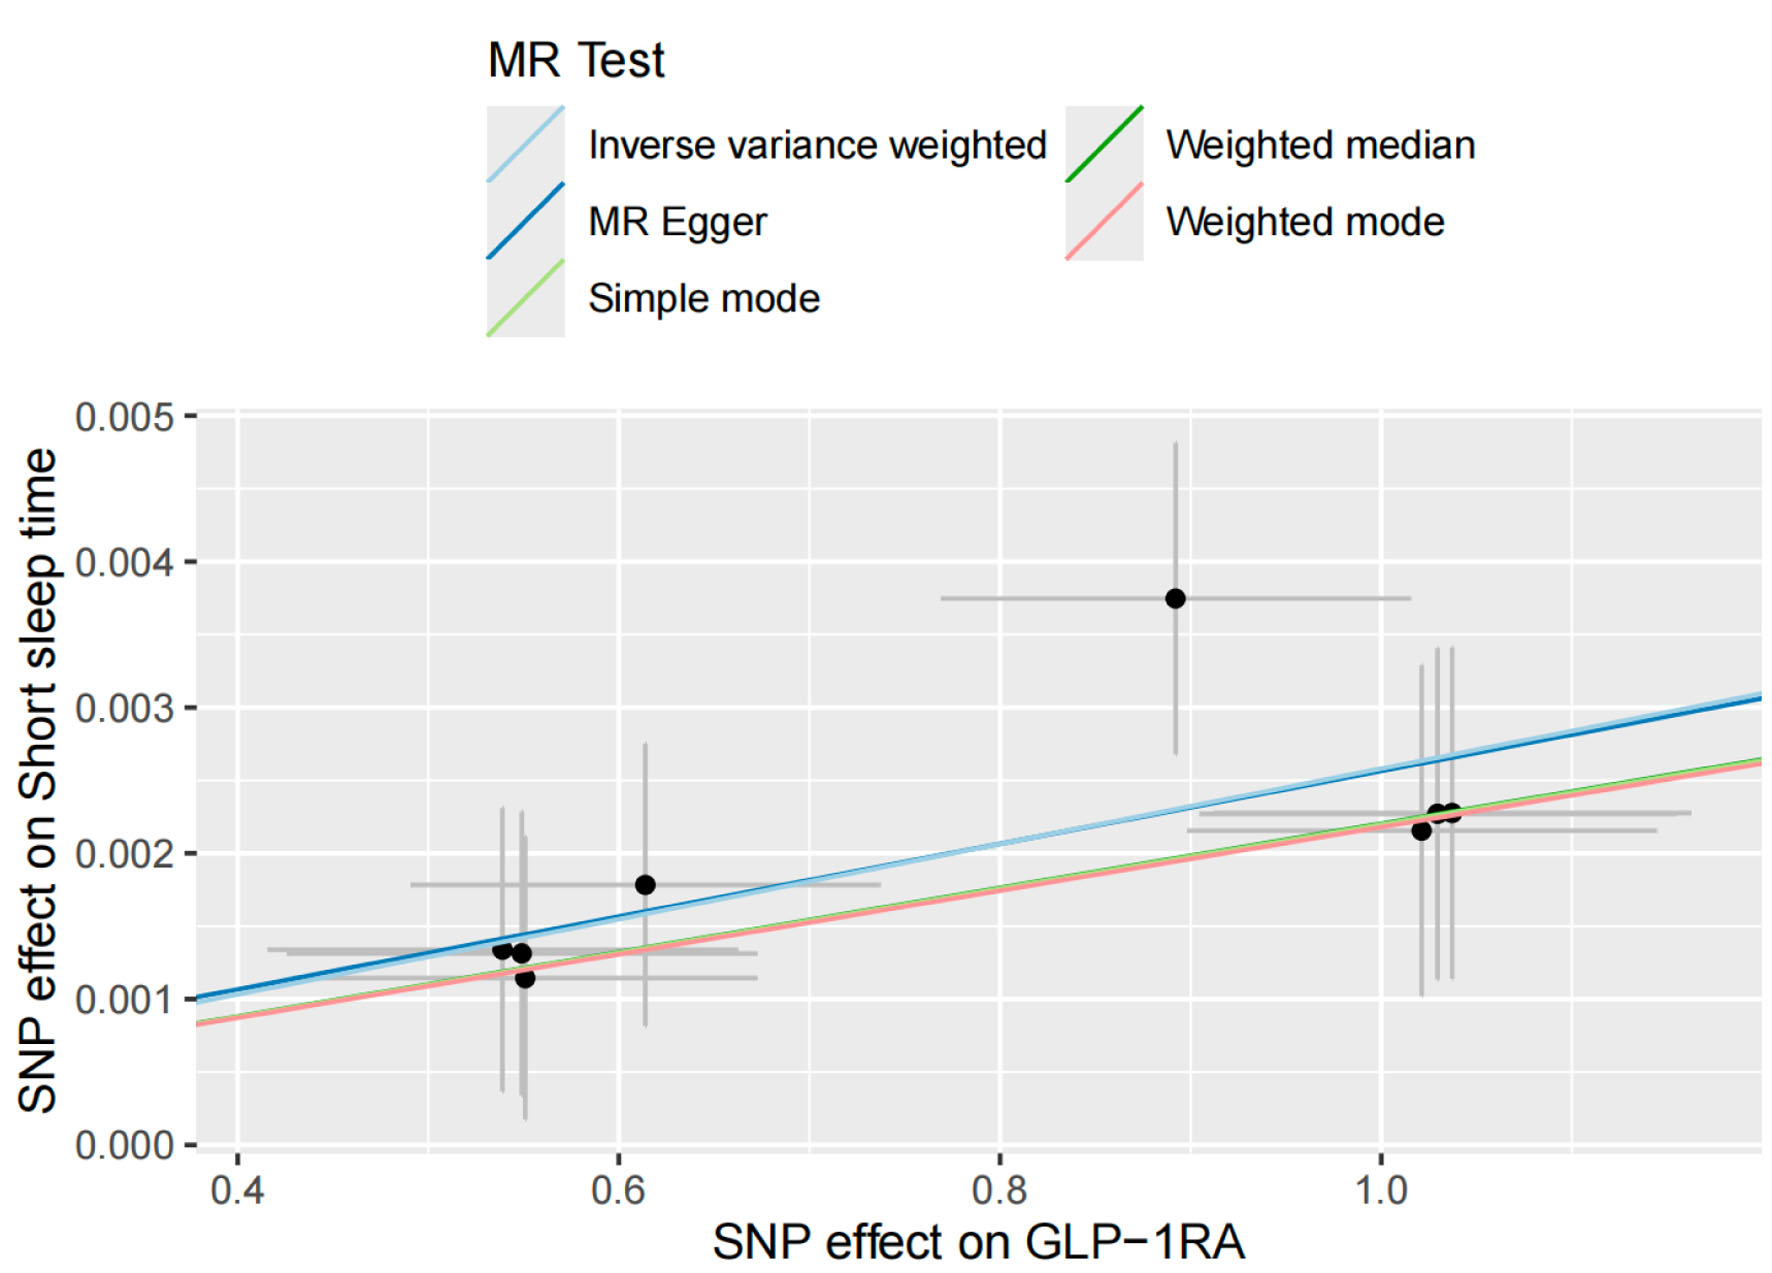
Table
| Reference | Study design | Country | Participants age | Participants BMI | Participants sex | Habitual sleep | Sample size | Main intervention | Exposure of variable of interest | Insulin sensitivity |
|---|---|---|---|---|---|---|---|---|---|---|
| Participants sex shows the ratio of female to male. CPIR: cephalic phase insulin response; FBG: fasting blood glucose; FBI: fasting blood insulin; HOMA-IR: homeostatic model assessment for insulin resistance; IVGTT: intravenous glucose tolerance test; OGTT: oral glucose tolerance test; QUICKI: Quantitative Insulin Sensitivity Check Index; RCT: randomized controlled trial. | ||||||||||
| Eckel RH 2015 [19] | RCT | UK | 18 to 35 (22.4 ± 4.8) | 18.5–24.9 | 5:5 | 7–9.25 h | 16 | Sleep restriction | OGTT, IVGTT | Worse |
| Sweeney EL 2021 [20] | RCT | UK | 18 to 40 (26 ± 5) | 24 ± 2.2 | 5:5 | 7–9 h | 12 | Sleep restriction | OGTT | Worse |
| Sweeney EL 2020 [21] | RCT | UK | 25 ± 8 | 25.12 | 0:1 | Bedtime before 22:00 or after 1:00 Wake time before 6:00 or after 9:00 | 19 | Sleep restriction | OGTT | Worse |
| Wang X 2016 [22] | RCT | USA | 20.6 ± 1.3 | 24.5 ± 3.4 | 8:7 | 7.43 ± 0.64 h | 15 | Sleep restriction | OGTT, HOMA-IR, Matsuda Index, QUICKI | Worse |
| Cedernaes J 2016 [23] | RCT | UK | 22.88 ± 0.66 | 22.88 ± 0.45 | 0:1 | 7–9 h | 16 | Sleep restriction | OGTT, HOMA-IR, CPIR | Worse |
| Hart CN 2015 [24] | RCT | USA | 41.7 ± 10.3 | 31.0 ± 4.2 | 1:0 | Not available | 21 | Sleep restriction | HOMA-IR | Worse |
| Rao MN 2014 [25] | RCT | USA | 27 ± 5 | 24.1 ± 4.1 | 3:4 | 7.7 h | 14 | Sleep restriction | OGTT, CPIR | Worse |
| Singh P 2023 [26] | RCT | USA | 54 to 65 (59 ± 4) | 28.0 ± 2.6 | 1:0 | 497 ± 11 min | 14 | Sleep restriction | FBI, FBG, HOMA-IR | Worse |
| Tajiri E 2017 [27] | RCT | Japan | 21.6 ± 0.5 | 20.4 ± 2.0 | 1:0 | 6:16 ± 0:45 h | 16 | Sleep restriction | FBI | Worse |
| Bener A 2020 [28] | Cross-sectional Study | Turkey | 25 to 65 | Not available | 541:330 | Not available | 871 | Sleep restriction | HbA1c, FBG | Worse |
| Shaw ND 2016 [29] | RCT | USA | 11.3 to 14.1 | Not available | 1:1 | Habitual bedtime (21:00–22:30) Morning (05:00–07:30) | 14 | Sleep extension | FBI, FBG | Improved |
| Chennaoui M 2016 [30] | RCT | UK | 31.4 ± 3.9 | 24.0 ± 2.0 | 0:1 | 6–9 h | 14 | Sleep extension | FBI, FBG | Improved |
| Reutrakul, S 2022 [31] | Pilot randomized trial | USA | 18 to 45 (42.0 ± 2.9) | Not available | 1:0 | ≤ 8 h | 14 | Sleep restriction | OGTT, HOMA-IR | Worse |
| So-Ngern A 2019 [32] | RCT | Thailand | 20 to 55 (33.6 ± 6.1) | 22.6 ± 3.2 | 19:3 | Not available | 21 | Sleep extension | FBI, FBG, HOMA-IR, Matsuda Index | Improved |
| Benedict C 2016 [33] | Clinical Trail | USA | 23.3 ± 0.6 | 23.1 ± 0.6 | 0:1 | Not available | 16 | Sleep restriction | FBI, FBG, HOMA-IR, Matsuda Index | Worse |
| Souza JFT 2024 [34] | RCT | Brazil | 18 to 40 (26.2 ± 4.1) | 24.9 ± 3.1 | 0:1 | 7.4 ± 0.8 h | 28 | Sleep restriction | OGTT, HOMA-IR | Worse |
| Zuraikat FM 2024 [35] | RCT | USA | 20 to 75 (37.6 ± 13.9) | 25.5 ± 3.3 | 1:0 | 457.7 ± 21.6 min | 38 | Sleep restriction | FBI, FBG, HOMA-IR | Worse |
| Li X 2016 [36] | Prospective Cohort Study | China | 30 to 65 (51.0 ± 6.9) | 24.8 ± 3.2 | 2,736:3,109 | Not available | 5,845 | Sleep extension | HOMA-IR, FBG | Worse |
| Widjaja NA 2023 [37] | Observational Study | Indonesia | 13 to 18 (15.31 ± 1.39) | 33.68 ± 4.74 | 81:39 | 7.07 ± 1.51 h | 120 | Sleep extension | HOMA-IR, FBG, FBI | Improved |