Journal of Endocrinology and Metabolism, ISSN 1923-2861 print, 1923-287X online, Open Access
Article copyright, the authors; Journal compilation copyright, J Endocrinol Metab and Elmer Press Inc
Journal website https://jem.elmerpub.com

Original Article

Volume 16, Number 4, August 2026, pages 167-171


Nonlinear Relationship Between Serum 25-Hydroxyvitamin D and Glycemic Control Among US Adults: A Survey-Weighted Analysis of NHANES 2017–2018

Figure

↓  Figure 1. Restricted cubic spline regression demonstrating the nonlinear association between serum 25(OH)D concentrations and predicted HbA1c levels. Shaded regions represent 95% confidence intervals. HbA1c: glycated hemoglobin; 25(OH)D: serum 25-hydroxyvitamin D.
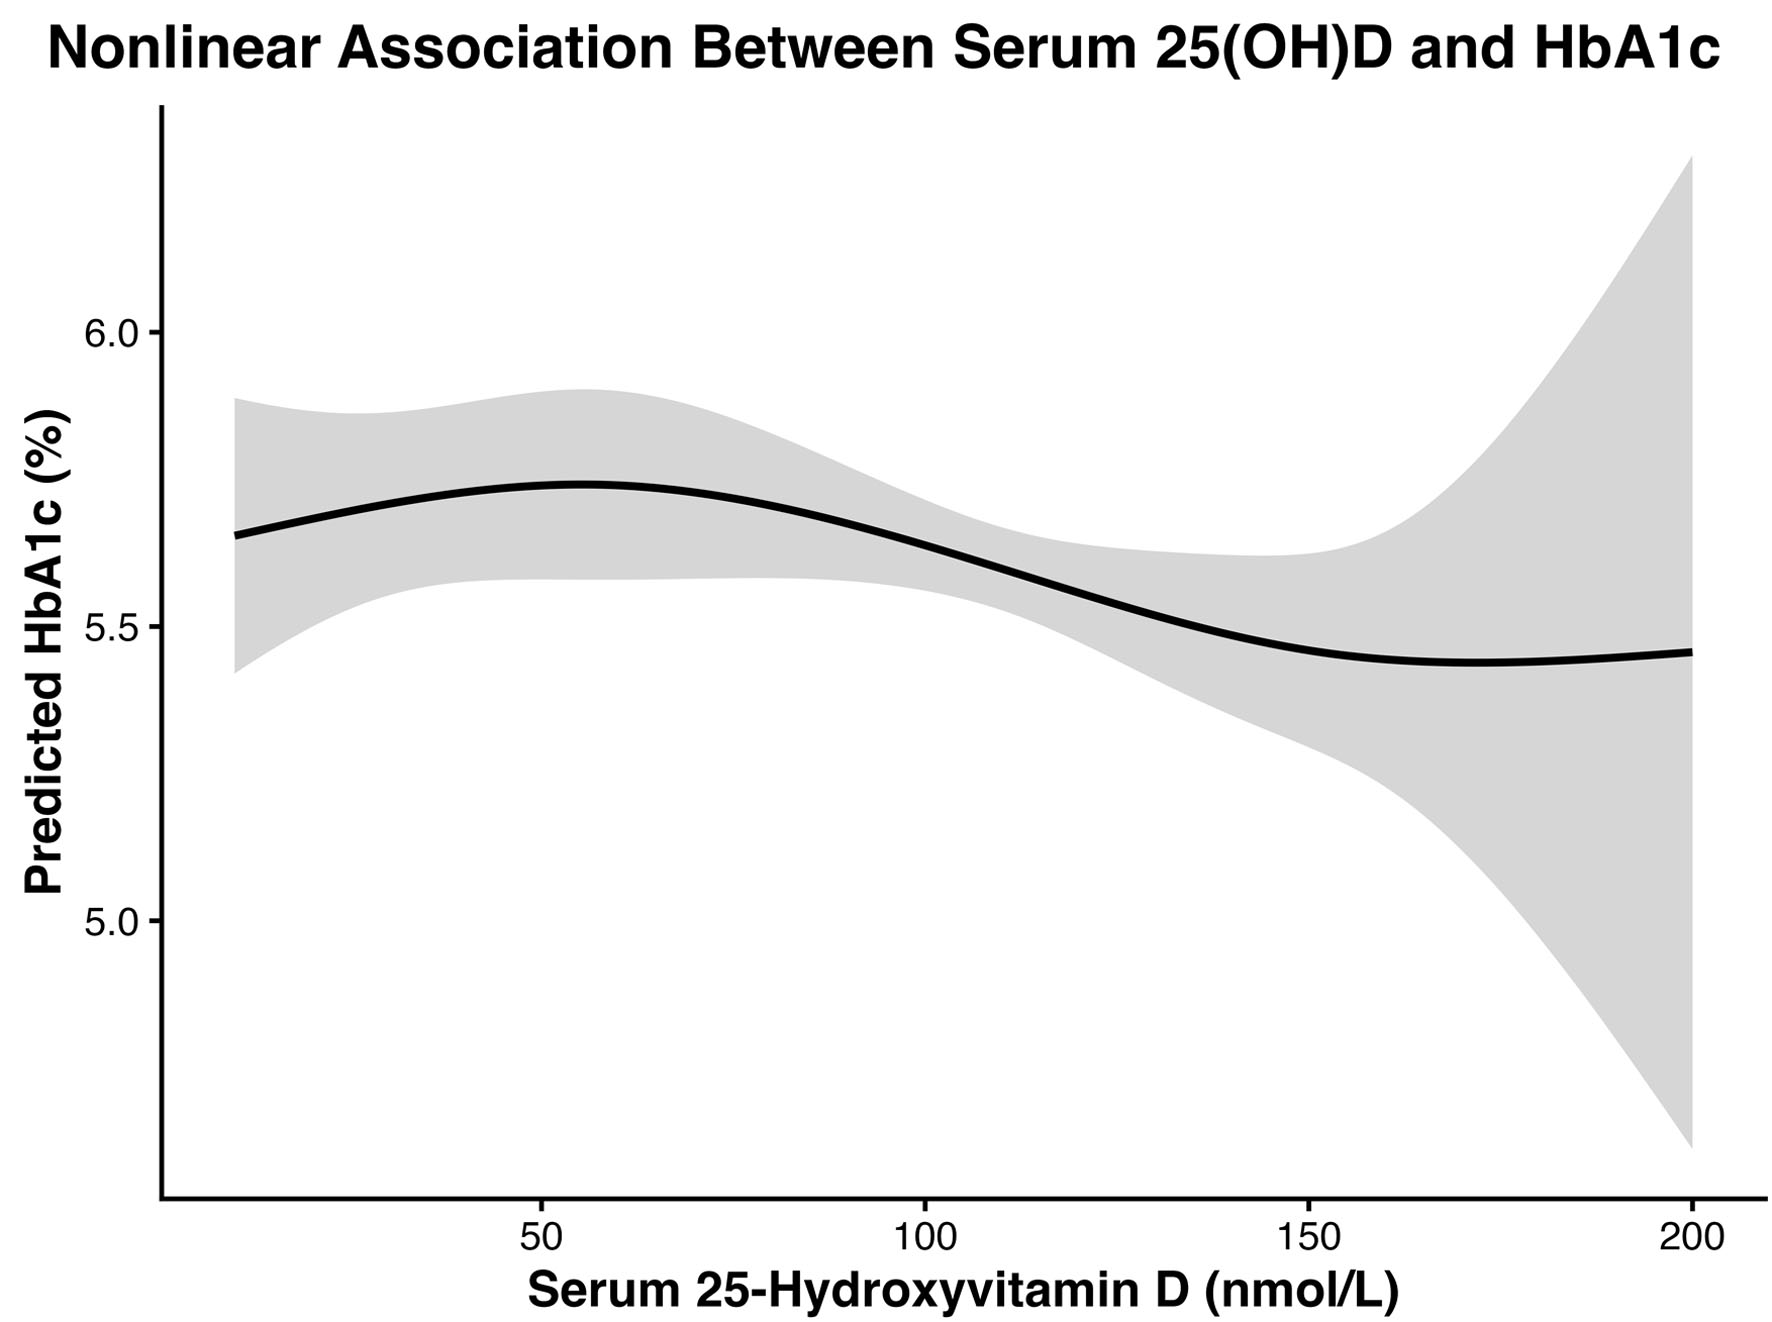
Figure 1.

Tables

↓  Table 1. Baseline Characteristics of Study Participants (NHANES 2017–2018)
 
CharacteristicN = 5,136
Data are presented as mean ± standard deviation (SD) or number (percentage). BMI: body mass index; HbA1c: glycated hemoglobin; 25(OH)D: serum 25-hydroxyvitamin D.
Age, years50 ± 19
Male sex2,474 (48%)
Female sex2,662 (52%)
Mexican American718 (14%)
Other Hispanic486 (9.5%)
Non-Hispanic White1,792 (35%)
Non-Hispanic Black1,153 (22%)
Other race987 (19%)
BMI, kg/m230 ± 7
HbA1c, %5.84 ± 1.09
25(OH)D, nmol/L68 ± 32
Vitamin D deficient1,518 (30%)
Vitamin D insufficient1,790 (35%)
Vitamin D sufficient1,828 (36%)
Physically inactive2,691 (52%)
Physically active2,445 (48%)


↓  Table 2. Multivariable Association Between Serum 25(OH)D and HbA1c
 
VariableβSE95% CIP-value
BMI: body mass index; CI: confidence interval; SE: standard error.
Vitamin D insufficient−0.0510.036−0.120 to 0.0190.156
Vitamin D sufficient−0.1890.038−0.263 to −0.115< 0.001
Age (per year)0.0200.0010.018 to 0.021< 0.001
Sex (female vs. male)−0.0760.029−0.132 to −0.0200.008
BMI (kg/m2)0.0240.0020.020 to 0.028< 0.001
Physical activity (active vs. inactive)−0.0630.029−0.121 to −0.0060.030