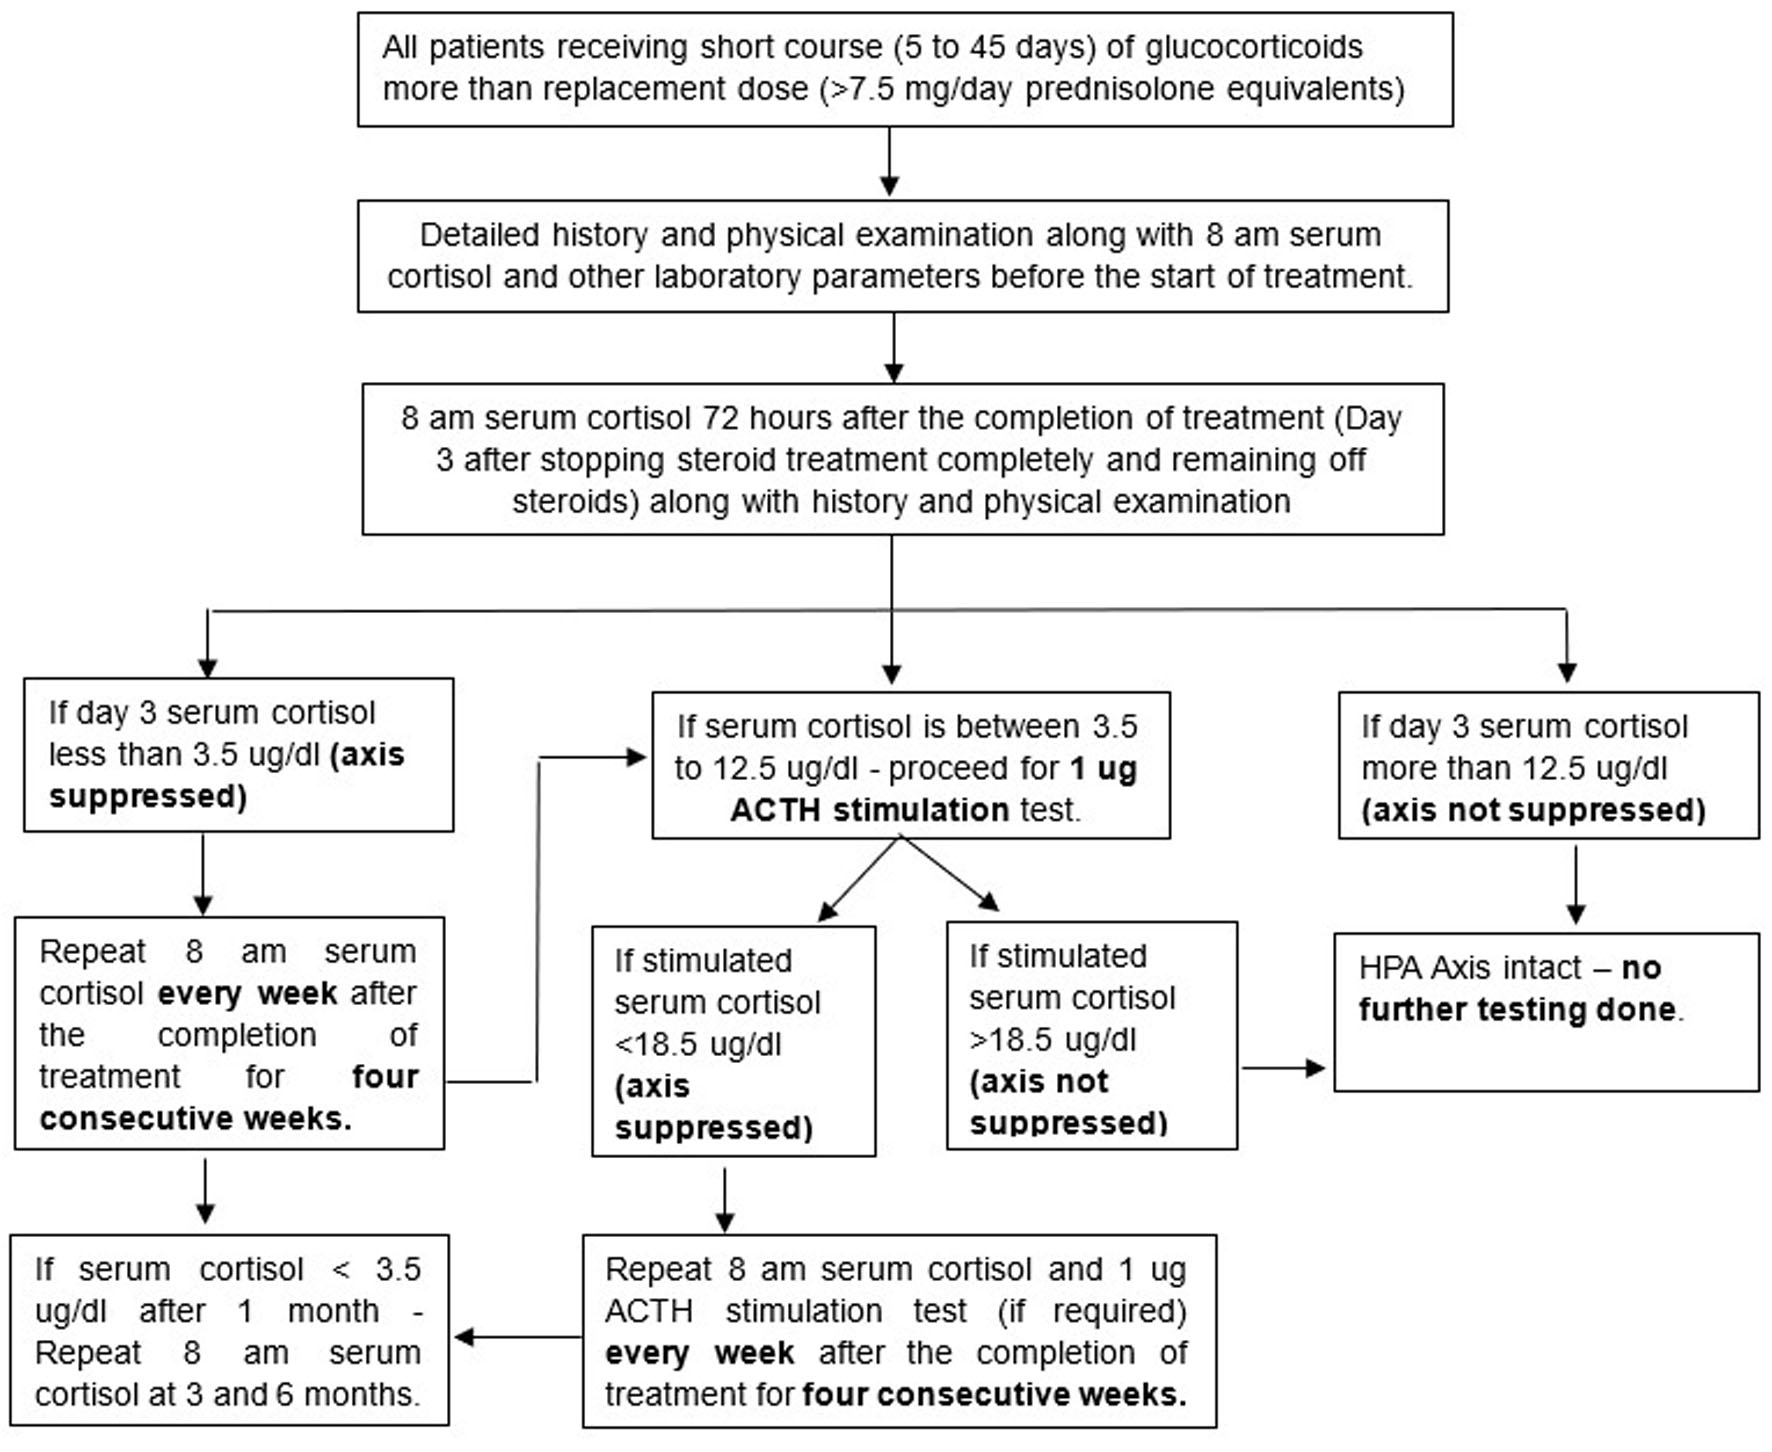
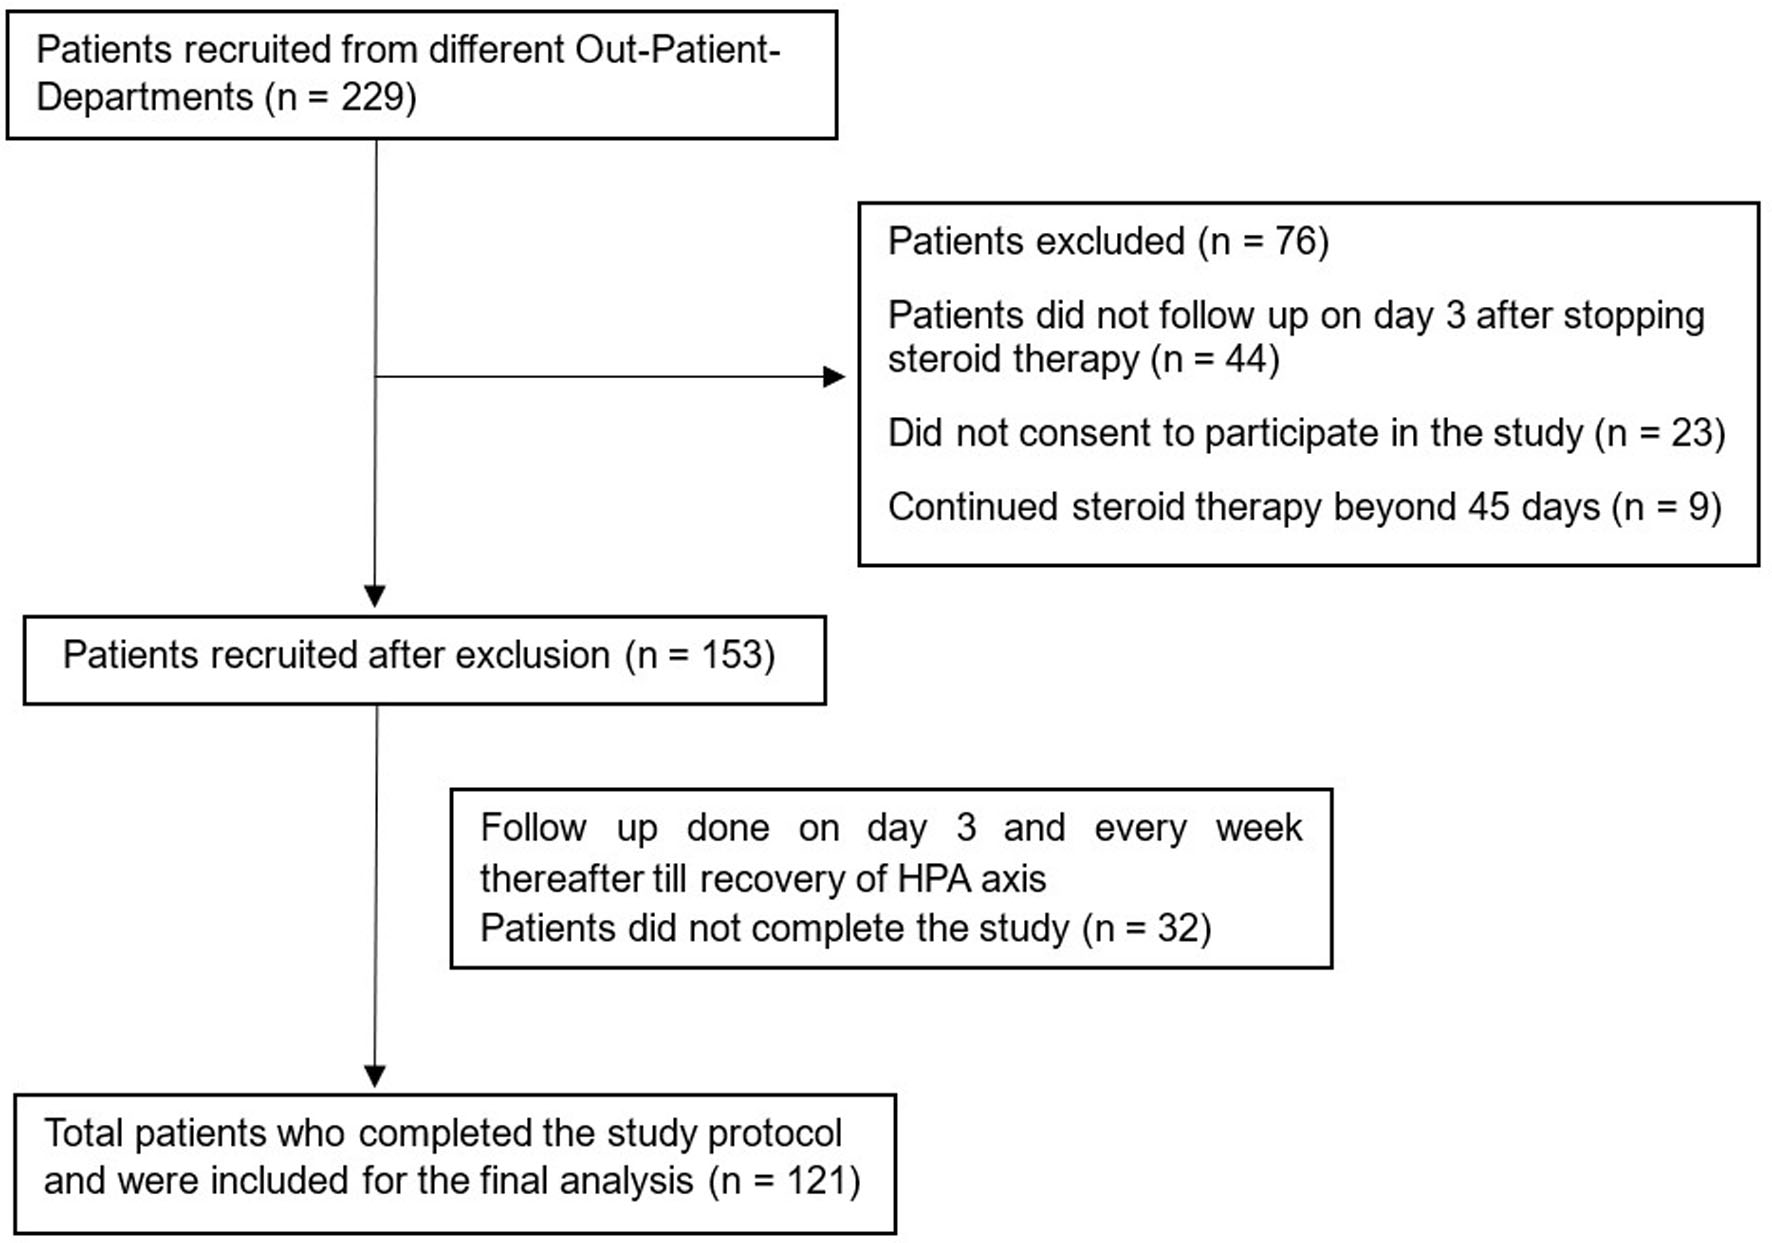
↓ Figure 1. Flow chart of the study plan.
| Journal of Endocrinology and Metabolism, ISSN 1923-2861 print, 1923-287X online, Open Access |
| Article copyright, the authors; Journal compilation copyright, J Endocrinol Metab and Elmer Press Inc |
| Journal website https://jem.elmerpub.com |
Original Article
Volume 16, Number 5, October 2026, pages 228-237
Evaluation of Hypothalamic–Pituitary–Adrenal Axis After Short Course of Systemic Steroids
Figures
Tables
| Time after steroid discontinuation | Number tested | HPA axis suppression | HPA axis recovery |
|---|---|---|---|
| HPA: hypothalamic–pituitary–adrenal. | |||
| Day 3 | 121 | 57 (47.1%) | 64 (52.9%) |
| Day 10 | 57 | 18 (31.6%) | 39 (68.4%) |
| Day 17 | 18 | 4 (22.2%) | 14 (77.8%) |
| Day 24 | 4 | 1 (25.0%) | 3 (75.0%) |
| Day 31 | 1 | 0 | 1 (100%) |
| Parameter | Patients with HPA axis suppression (N = 57) (mean ± SD) | Patients with no HPA axis suppression (N = 64) (mean ± SD) | P value |
|---|---|---|---|
| *Significant P value. HPA: hypothalamic–pituitary–adrenal; BMI: body mass index; SD: standard deviation. | |||
| Age (years) | 41.3 ± 14.72 | 48.42 ± 13.78 | 0.007* |
| Height (cm) | 161.35 ± 6.93 | 159.06 ± 7.28 | 0.090 |
| Weight (kg) | 65.46 ± 10.22 | 62.81 ± 10.2 | 0.145 |
| BMI (kg/m2) | 25.09 ± 3.15 | 24.83 ± 3.71 | 0.583 |
| Sodium (mEq/L) | 138.02 ± 3.92 | 137.45 ± 4.14 | 0.554 |
| Potassium (mEq/L) | 4.08 ± 0.38 | 4.08 ± 0.38 | 0.958 |
| Urea (mg/dL) | 22.32 ± 6.16 | 24.28 ± 12.05 | 0.975 |
| Creatinine (mg/dL) | 0.86 ± 0.23 | 0.91 ± 0.32 | 0.451 |
| Fasting glucose (mg/dL) | 118.88 ± 36.75 | 128.27 ± 58.98 | 0.502 |
| Baseline cortisol (µg/dL) | 10.43 ± 2.74 | 11.74 ± 2.93 | 0.014* |
| Cumulative steroid dose (mg) | 550.18 ± 896.47 | 1,133.28 ± 1,586.12 | 0.005* |
| Total steroid duration (days) | 14.23 ± 7.86 | 17.53 ± 10.58 | 0.101 |
| Tapering of steroid done | 21 (36.84) | 40 (62.5) | 0.006* |
| Parameters | Adjusted OR | P value | 95% CI (lower–upper) |
|---|---|---|---|
| *Significant P value. HPA: hypothalamic–pituitary–adrenal; OR: odds ratio; CI: confidence interval. | |||
| Age (years) | 0.963 | 0.015* | 0.934–0.993 |
| Baseline cortisol (µg/dL) | 0.832 | 0.013* | 0.719–0.962 |
| Tapering done | 0.448 | 0.072 | 0.187–1.075 |
| Treatment duration (days) | 0.982 | 0.441 | 0.937–1.029 |
| Cumulative glucocorticoid dose (mg) | 0.806 | 0.029 | 0.664–0.978 |
| Parameter | Patients with HPA axis suppression (N = 18) (mean ± SD) | Patients with HPA axis recovery (N = 39) (mean ± SD) | P value |
|---|---|---|---|
| *Significant P value. HPA: hypothalamic–pituitary–adrenal; SD: standard deviation; BMI: body mass index. | |||
| Age (years) | 39.83 ± 14.79 | 41.97 ± 14.83 | 0.525 |
| Height (cm) | 161.33 ± 6.71 | 161.36 ± 7.11 | 0.973 |
| Weight (kg) | 66.11 ± 10.47 | 65.15 ± 10.22 | 0.718 |
| BMI (kg/m2) | 25.35 ± 3.32 | 24.96 ± 3.11 | 0.565 |
| Sodium (mEq/L) | 138.33 ± 3.38 | 137.87 ± 4.18 | 0.563 |
| Potassium (mEq/L) | 4.11 ± 0.39 | 4.07 ± 0.38 | 0.763 |
| Urea (mg/dL) | 22.11 ± 6.13 | 22.41 ± 6.25 | 0.770 |
| Creatinine (mg/dL) | 0.86 ± 0.24 | 0.86 ± 0.23 | 0.770 |
| Fasting glucose (mg/dL) | 124.61 ± 28.07 | 116.23 ± 40.19 | 0.097 |
| Baseline cortisol (µg/dL) | 11.52 ± 2.62 | 9.93 ± 2.68 | 0.045* |
| Cumulative dose (mg) | 523.89 ± 435.59 | 562.31 ± 1,048.33 | 0.240 |
| Total steroid duration (days) | 21 ± 7.71 | 11.1 ± 5.73 | < 0.001* |