| Journal of Endocrinology and Metabolism, ISSN 1923-2861 print, 1923-287X online, Open Access |
| Article copyright, the authors; Journal compilation copyright, J Endocrinol Metab and Elmer Press Inc |
| Journal website https://jem.elmerpub.com |
Original Article
Volume 15, Number 4, October 2025, pages 144-152

Role of Adiponectin in Modulating Insulin Resistance in Visceral Obesity-Associated Type 2 Diabetes Mellitus
Abid Shaheera, d ![]() , Shahid Akhtarb
, Shahid Akhtarb ![]() , Mahir
Jalloc
, Mahir
Jalloc ![]()
aDepartment of Biomedical Sciences, College of Medicine, Gulf Medical University,
Ajman, United Arab Emirates
bThumbay Labs, Gulf Medical University, Ajman,
United Arab Emirates
cDepartment of Internal Medicine, Thumbay University
Hospital, Ajman, United Arab Emirates
dCorresponding Author: Abid Shaheer,
Department of Biomedical Sciences, College of Medicine, Gulf Medical University, Ajman, United
Arab Emirates
Manuscript submitted July 8, 2025, accepted September 6, 2025, published online October 6,
2025
Short title: Adiponectin Modulates Insulin Resistance
doi:
https://doi.org/10.14740/jem1546
| Abstract | ▴Top |
Background: Visceral obesity is a key determinant of insulin resistance and pathogenesis of type 2 diabetes mellitus (T2DM). Adiponectin is an adipokine predominantly secreted by visceral adipose tissue, characterized by potent anti-inflammatory and insulin-sensitizing properties. The reduction of adiponectin in obesity may contribute to metabolic dysfunction. A comprehensive understanding of its regulatory functions offers valuable insights into the underlying pathophysiology. The aim of the study was to evaluate the role of serum adiponectin in modulating insulin resistance among patients with visceral obesity-associated T2DM and to examine its association with anthropometric and metabolic parameters.
Methods: This cross-sectional study included 140 adults (aged 30 - 65) with T2DM and confirmed visceral obesity (waist circumference (WC) ≥ 90 cm in men, ≥ 80 cm in women). Serum adiponectin, fasting glucose and insulin levels were measured using enzyme-linked immunosorbent assay and chemiluminescent immunoassay. Insulin resistance was assessed via the homeostatic model assessment for insulin resistance (HOMA-IR) index. Spearman correlations and multivariate regression analyses were performed.
Results: Serum adiponectin levels were significantly lower in individuals with elevated HOMA-IR (P < 0.01). Adiponectin showed a strong inverse correlation with HOMA-IR (ρ = -0.45, P < 0.001), body mass index (BMI, ρ = -0.17, P = 0.041), WC (ρ = -0.23, P = 0.006) and fasting glucose (ρ = -0.79, P < 0.001). Multivariate regression confirmed adiponectin as an independent predictor of insulin resistance after adjusting for age, gender, WC and BMI.
Conclusion: Adiponectin is a key modulator of insulin resistance in visceral obesity-associated T2DM. Its inverse relationship with HOMA-IR, central adiposity and dyslipidemia underscores its role as a sensitive biomarker and potential therapeutic target for improving metabolic health.
Keywords: Adiponectin; Insulin resistance; Visceral obesity; Type 2 diabetes mellitus; HOMA-IR; Adipokines
| Introduction | ▴Top |
Type 2 diabetes mellitus (T2DM) is a metabolic disorder characterized by hyperglycemia, insulin resistance and progressive pancreatic β-cell dysfunction [1, 2]. The worldwide escalation of T2DM strongly indicates the growing burden of obesity, with visceral adiposity emerging as a critical driver of this association [2, 3]. Visceral adiposity occurs due to the increased intra-abdominal fat accumulation, which is recognized as a more accurate predictor of metabolic risk than general obesity due to its unique endocrine and inflammatory profile [4-6].
Visceral adipose tissue functions as a highly active endocrine organ, secreting a range of bioactive molecules, including adipokines, chemokines and cytokines. These secretions contribute to low-grade chronic inflammation, oxidative stress, endothelial dysfunction and disruption of insulin signaling pathways [7, 8]. The resulting pro-inflammatory environment fosters insulin resistance, which not only promotes hyperglycemia but also increases the risk of cardiovascular disease and non-alcoholic fatty liver disease [9-11].
Adiponectin is one of the adipocyte-derived hormones that exhibit anti-inflammatory, anti-atherogenic and insulin-sensitizing properties. The adiponectin level declines with increasing adiposity, particularly in individuals with visceral obesity [12-14]. Low adiponectin is linked to higher insulin resistance, metabolic syndrome, dyslipidemia and a heightened risk of T2DM and atherosclerosis [15-17].
Adiponectin acts primarily through its receptors adiponectin receptor 1 (AdipoR1) and adiponectin receptor 2 (AdipoR2), which are expressed in liver, skeletal muscle and vascular endothelium. It activates key signaling cascades such as AMP-activated protein kinase (AMPK) and peroxisome proliferator-activated receptor-alpha (PPAR-α), leading to enhanced fatty acid oxidation, increased glucose uptake, suppression of hepatic gluconeogenesis and improved mitochondrial function [18-21]. These mechanisms are pivotal in restoring metabolic homeostasis, especially in the insulin-resistant state.
Adiponectin also plays a role in modulating vascular inflammation, inhibiting endothelial cell apoptosis and improving nitric oxide availability. These effects confer protection against atherosclerosis, which is particularly relevant in patients with T2DM and central obesity [22-24]. Genetic studies have shown that polymorphisms in the ADIPOQ gene affect both serum adiponectin concentrations and receptor functionality. Variants such as rs2241766 and rs1501299 have been linked to increased T2DM susceptibility, insulin resistance and metabolic syndrome with central obesity [25-27]. Moreover, studies have revealed that epigenetic modifications (e.g., promoter methylation) can suppress adiponectin gene expression in response to environmental triggers such as chronic inflammation or oxidative stress [28].
Clinical studies have demonstrated that serum adiponectin levels are inversely correlated with central obesity and directly associated with insulin sensitivity, high-density lipoprotein (HDL) cholesterol and adipose tissue insulin responsiveness [29, 30]. Waist-to-height ratio and waist circumference (WC) have outperformed body mass index (BMI) as predictors of low adiponectin and insulin resistance in various ethnic cohorts [31, 32].
Pharmacological agents such as thiazolidinediones (PPAR-γ agonists), glucagon-like peptide-1 (GLP-1) receptor agonists and sodium-glucose cotransporter-2 (SGLT2) inhibitors have been shown to increase circulating adiponectin levels, concomitantly improving insulin sensitivity and glycemic control in patients with visceral adiposity and T2DM [33-35]. Similarly, lifestyle interventions including calorie restriction, aerobic exercise and omega-3 supplementation elevate adiponectin concentrations and improve metabolic outcomes [36, 37]. This suggests a potential therapeutic role for adiponectin restoration in obesity-associated insulin resistance.
Improved insulin sensitivity has been observed without changes in adiponectin levels, while paradoxically elevated adiponectin has been described in patients with advanced cardiovascular disease and chronic kidney disease by a phenomenon termed the “adiponectin paradox” [38, 39]. These findings underscore the complexity of adiponectin biology and the need for population-specific studies. Despite extensive research, the modulatory role of adiponectin in insulin resistance within the context of visceral obesity remains incompletely understood in high-risk populations. Understanding this interaction may aid in identifying patients at early risk of metabolic deterioration and guide targeted interventions.
The present study aims to explore the role of adiponectin in modulating insulin resistance in individuals with visceral obesity-associated T2DM. It further seeks to assess the potential of adiponectin as a mechanistic biomarker and therapeutic target in managing metabolic complications in central obesity.
| Materials and Methods | ▴Top |
Study design and ethical approval
This cross-sectional observational study was conducted from October 2024 to May 2025 at Gulf Medical University in collaboration with Thumbay University Hospital, Thumbay Clinics and Thumbay Labs, Ajman, United Arab Emirates. The study protocol was approved by the Institutional Review Board (IRB-COM-FAC-58-Oct-2024) and the study was conducted in accordance with the ethical standards of our institutional review board and adhered to the principles outlined in the Declaration of Helsinki for research involving human subjects. Written informed consent was obtained from all participants before data collection.
Study population
A total of 140 adult patients aged 30 to 65 years with a confirmed diagnosis of T2DM were recruited using purposive sampling. The diagnosis of T2DM was based on the American Diabetes Association (ADA) 2023 guidelines. All participants had visceral obesity, defined as a WC of ≥ 90 cm for men and ≥ 80 cm for women, according to International Diabetes Federation (IDF) criteria for South Asian populations.
Inclusion and exclusion criteria
The study included patients aged 30 - 65 years, diagnosed with T2DM and visceral obesity. Patients were excluded if they had type 1 diabetes, gestational diabetes, insulin therapy, chronic kidney disease (estimated glomerular filtration rate < 60 mL/min/1.73 m2), hepatic dysfunction, malignancy, acute infection or inflammatory conditions. Additionally, patients on medications known to affect adiponectin levels, such as corticosteroids or thiazolidinediones, were excluded.
Anthropometric and clinical assessments
Anthropometric data included height, weight, BMI and WC. Height and weight were measured using a stadiometer and a calibrated digital weighing scale, respectively and BMI was calculated as weight in kilograms divided by height in meters squared (kg/m2). WC was measured at the midpoint between the lower rib margin and the iliac crest using a non-stretchable tape. Blood pressure was recorded in a seated position after 5 min of rest using an automated sphygmomanometer and the mean of two readings was used for analysis.
Laboratory investigations
All participants underwent venous blood sampling following a 10 - 12 h overnight fast. Adiponectin levels were quantified using a validated enzyme-linked immunosorbent assay (ELISA) kit from Invitrogen (Thermo Fisher Scientific), with a sensitivity of 0.2 ng/mL and an intra-assay coefficient of variation below 5%. Fasting plasma glucose (FPG), 2-h postprandial blood glucose (PPBG), triglycerides (TG), total cholesterol (TC), low-density lipoprotein cholesterol (LDLC) and high-density lipoprotein cholesterol (HDLC) were analyzed using the Beckman Coulter Clinical Chemistry Analyzer. Glycated hemoglobin (HbA1c) was assessed through high-performance liquid chromatography (HPLC). Serum insulin concentrations were determined via chemiluminescent immunoassay (CLIA). All laboratory investigations were carried out in the central laboratory by standard quality control protocols.
Assessment of insulin resistance
Insulin resistance was estimated using the homeostatic model assessment for insulin resistance (HOMA-IR), calculated using the formula: HOMA-IR = (Fasting Insulin (µU/mL) × Fasting Glucose (mmol/L))/22.5. Higher HOMA-IR values were interpreted as indicative of greater insulin resistance. A cut-off value of > 2.5 was considered to indicate insulin resistance based on established guidelines.
Sample size estimation
The required sample size was calculated based on an expected moderate inverse correlation (r = -0.4) between serum adiponectin and HOMA-IR, with an α of 0.05 and 80% power. The minimum estimated sample size was 84 participants. To enhance power and allow for subgroup analyses, a total of 140 participants were ultimately enrolled in the study.
Statistical analysis
All data were analyzed using IBM SPSS Statistics (version 29.0). Continuous variables were tested for normality using the Shapiro-Wilk test. Normally distributed data were expressed as mean ± standard deviation (SD), while non-normally distributed data were presented as median and interquartile range (IQR). For group comparisons between overweight and obese participants, an independent samples t-test was applied to normally distributed variables, while the Mann-Whitney U test was used for non-normally distributed variables. Spearman’s rank correlation coefficient (ρ) was employed to assess the strength and direction of associations between serum adiponectin and various anthropometric and metabolic variables, conducted separately within overweight and obese subgroups. A multivariate linear regression analysis was performed to determine whether serum adiponectin was an independent predictor of insulin resistance. A P-value of < 0.05 was considered statistically significant throughout all analyses.
| Results | ▴Top |
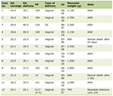
A total of 140 participants with T2DM and confirmed visceral obesity were included in the study and stratified into overweight (n = 77) and obese (n = 63) groups based on WC criteria. Table 1 indicates the normality assessment of metabolic and anthropometric variables in overweight and obese groups. In the overweight group, the variables that followed a normal distribution (P > 0.05) included height (p = 0.190), PPBG (P = 0.385) and HbA1c (P = 0.532). All other variables, age (P = 0.010), weight (P = 0.016), WC (P < 0.001), BMI (P = 0.040), FPG (P = 0.046), insulin (P = 0.019), HOMA-IR (P < 0.001), adiponectin (P < 0.001), TC (P < 0.001), TG (P = 0.005), HDL (P < 0.001) and LDL (P < 0.001), showed significant deviation from normality.
 Click to view |
Table 1. Normality Assessment of Variables in
Overweight and Obese Groups |
In the obese group, height (P = 0.153), weight (P = 0.372), FPG (P = 0.395) and insulin (P = 0.096) were normally distributed. In contrast, age (P < 0.001), WC (P < 0.001), BMI (P = 0.028), PPBG (P = 0.027), HbA1c (P = 0.019), HOMA-IR (P < 0.001), adiponectin (P < 0.001), TC (P < 0.001), TG (P = 0.261), HDL (P < 0.001) and LDL (P < 0.001) demonstrated non-normal distributions.
Overall, the normality assessment indicates that non-parametric statistical tests should be employed for most variables when comparing between overweight and obese groups, except for those with normal distribution in both groups (notably height). These results guided the selection of appropriate analytical methods in subsequent comparisons.
Table 2 shows a comparative analysis between overweight and obese individuals with T2DM, revealing several statistically significant differences in metabolic and anthropometric parameters. Obese participants exhibited significantly higher weight (90.0 (83.0 - 96.4) kg vs. 77.1 (71.2 - 81.6) kg, U = 780.5, P < 0.001), WC (101.3 (97.5 - 105.6) cm vs. 97.0 (94.0 - 97.0) cm, U = 1343.5, P < 0.001) and BMI (32.4 (31.2 - 33.0) vs. 27.3 (26.1 - 28.2), U = 0.0, P < 0.001) compared to the overweight group.
Click to view |
Table 2. Anthropometric and Biochemical
Parameters in Overweight and Obese Participants |
While no statistically significant differences were observed in FPG (13.9 (13.1 - 14.4) vs. 13.6 (12.7 - 15.1)), PPBG (17.7 (16.4 - 20.1) vs. 17.1 (15.9 - 19.5)), or HbA1c (9.3 (8.6 - 9.9) vs. 9.0 (8.3 - 10.2)) levels (P > 0.05), obese individuals had significantly lower serum adiponectin levels (11.3 (10.5 - 11.6) µg/mL vs. 11.3 (10.7 - 12.0) µg/mL, U = 1891.5, P = 0.016). This aligns with the hypothesis that low adiponectin is associated with increased insulin resistance in visceral obesity. Despite a trend toward higher fasting insulin levels in the overweight group (6.6 (6.2 - 7.0) vs. 6.5 (6.2 - 6.9) µU/mL), the difference was modest yet statistically significant (U = 1,922.5, P = 0.035). However, HOMA-IR values were nearly identical between groups (4.0 (4.0 - 4.0) vs. 4.0 (4.0 - 4.0)), showing no statistically significant difference (U = 2,415.0, P = 0.958).
In terms of lipid profiles, only HDLC was significantly lower in the obese group (1.1 (1.0 - 1.1) mmol/L vs. 1.1 (1.0 - 1.1) mmol/L, U = 1,922.5, P = 0.015). No significant differences were found in TC, TG, or LDLC between the two groups (P > 0.05). Finally, no statistically significant difference was observed in height, a normally distributed variable, between overweight and obese participants (168.42 ± 8.24 cm vs. 166.86 ± 8.82 cm, t = 1.079, P = 0.283). These findings suggest that visceral obesity is strongly associated with adverse adipokine profiles and specific anthropometric traits, while glycemic and insulin resistance indices remain relatively comparable in early-stage or moderately controlled T2DM patients.
Table 3 shows the correlation of serum adiponectin with anthropometric and metabolic parameters in the full study cohort, overweight and obese T2DM patients. A moderate negative correlation was observed between adiponectin and HOMA-IR (ρ = -0.45, P < 0.001) in the full cohort, indicating that lower adiponectin levels are associated with greater insulin resistance. Additionally, adiponectin showed weak negative correlations with both WC (ρ = -0.230, P = 0.006) and BMI (ρ = -0.173, P = 0.041), suggesting a mild inverse relationship with central and overall adiposity. A strong positive correlation was observed between adiponectin and fasting insulin (ρ = 0.750, P < 0.001), while strong negative correlations were found with FPG (ρ = -0.785, P < 0.001), TG (ρ = -0.792, P < 0.001) and TC (ρ = -0.738, P < 0.001). Adiponectin also demonstrated a strong positive correlation with HDLC (ρ = 0.918, P < 0.001) and a moderate negative correlation with LDLC (ρ = -0.552, P < 0.001).
Click to view |
Table 3. Correlation of Adiponectin With
Anthropometric and Biochemical Parameters |
These findings reinforce the metabolic significance of adiponectin, particularly its inverse association with insulin resistance, dyslipidemia and glycemic markers and support its potential utility as a biomarker in evaluating cardiometabolic risk in T2DM patients.
Adiponectin showed a moderate negative correlation with HOMA-IR (ρ = -0.45, P = 0.010), WC (ρ = -0.35, P = 0.025) and BMI (ρ = -0.28, p = 0.041) in the overweight group, indicating that lower adiponectin levels are moderately associated with greater insulin resistance and central adiposity. Additionally, adiponectin demonstrated a strong negative correlation with FPG (ρ = -0.796, P < 0.001), TG (ρ = -0.807, P < 0.001) and TC (ρ = -0.795, P < 0.001), as well as a strong positive correlation with HDLC (ρ = 0.923, P < 0.001) and insulin levels (ρ = 0.749, P < 0.001). Adiponectin maintained a strong inverse correlation with HOMA-IR (ρ = -0.61, P < 0.001) in the obese group, reinforcing its role in modulating insulin sensitivity. It was also negatively correlated with WC (ρ = -0.45, P = 0.008) and BMI (ρ = -0.38, P = 0.015). Strong negative associations were observed with FPG (ρ = -0.772, P < 0.001), TG (ρ = -0.777, p < 0.001) and TC (ρ = -0.666, P < 0.001), while a strong positive correlation was seen with HDL (ρ = 0.915, P < 0.001) and insulin (ρ = 0.763, P < 0.001). Among the predictors, serum adiponectin was the strongest negative predictor of HOMA-IR (β = -0.45, P < 0.001), followed by BMI, which showed a positive association (β = 0.28, P = 0.007). WC, age and gender were not significant predictors in the adjusted model.
These findings align with existing literature and underscore adiponectin’s potential as a biomarker of metabolic health. Its consistent inverse relationship with insulin resistance, central obesity and dyslipidemia in both groups highlights its mechanistic relevance in the metabolic regulation of T2DM patients.
| Discussion | ▴Top |
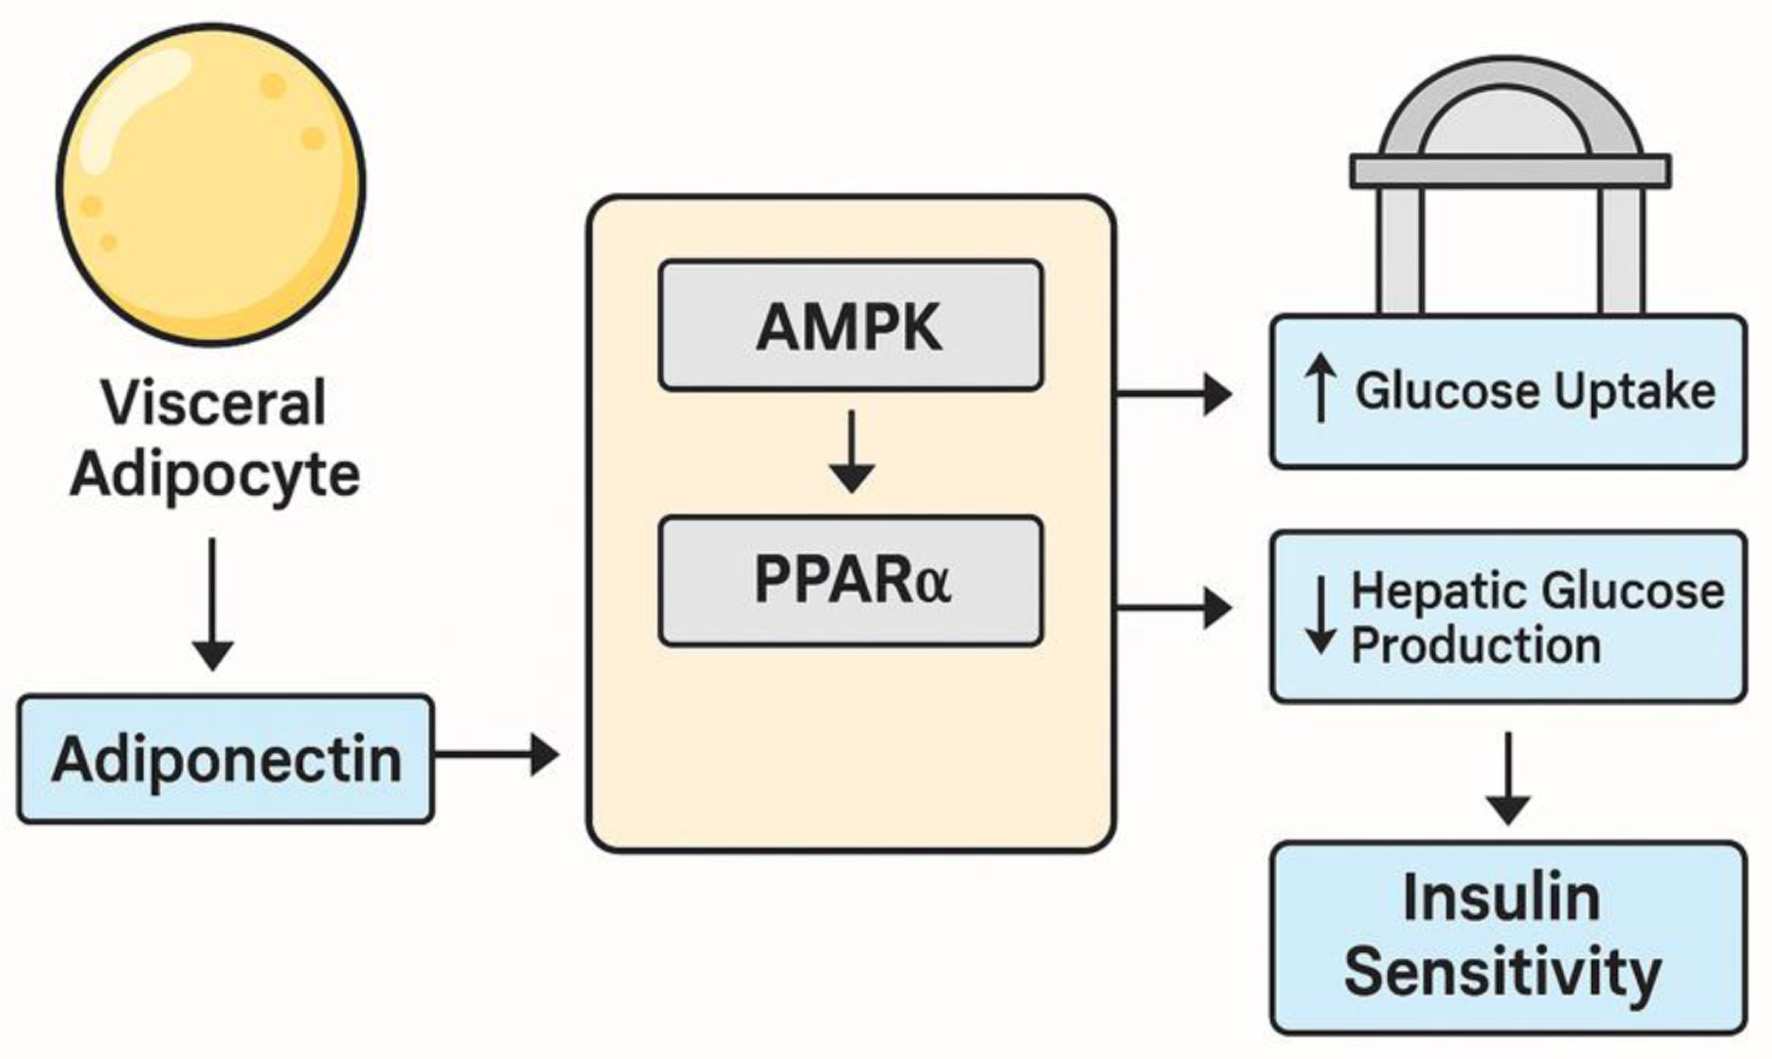
The present study affirms the central role of adiponectin in modulating insulin resistance among individuals with visceral obesity-associated T2DM. Our findings demonstrated a statistically significant inverse correlation between serum adiponectin levels and insulin resistance. This supports well-documented function of adiponectin as an insulin-sensitizing adipokine with anti-inflammatory, anti-atherogenic and metabolic regulatory properties [15, 40, 41]. These results align with recent experimental studies showing that adiponectin exerts its beneficial effects through the activation of AMPK and PPAR-α, which promote glucose uptake in muscle tissue, inhibit hepatic gluconeogenesis and enhance lipid oxidation [19, 42, 43]. Figure 1 illustrates the regulatory influence of adiponectin via AMPK and PPAR-α pathways. Adiponectin binds to its receptors AdipoR1 in skeletal muscle and AdipoR2 in the liver, activating AMPK and PPAR-α signaling pathways that together enhance insulin sensitivity. AMPK stimulation in muscle promotes glucose transporter 4 (GLUT4) translocation for increased glucose uptake and activates fatty acid oxidation by inhibiting acetyl-CoA carboxylase, reducing lipid accumulation. In the liver, PPAR-α upregulates genes for fatty acid transport and oxidation while suppressing gluconeogenic enzymes, thereby decreasing hepatic glucose output. These effects improve systemic glucose utilization, reduce hepatic glucose production and alleviate metabolic stress, contributing to better glycemic control in insulin resistance and T2DM [20, 42, 43].
 Click for large image |
Figure 1. Pathway illustrating the regulatory role of adiponectin via AMPK and PPAR-α signaling. Adiponectin binding to AdipoR1/AdipoR2 activates AMPK and PPAR-α, promoting glucose uptake in skeletal muscle, enhancing fatty acid oxidation and suppressing hepatic gluconeogenesis, thereby improving insulin sensitivity. AdipoR1: adiponectin receptor 1; AdipoR2: adiponectin receptor 2; AMPK: AMP-activated protein kinase; PPAR-α: peroxisome proliferator-activated receptor-alpha. |
A particularly noteworthy observation in our study was the consistently lower adiponectin levels among obese participants compared to the overweight group, despite similar glycemic control metrics. This finding reinforces the concept that visceral adiposity more accurately predicts adiponectin suppression and metabolic risk [31, 44]. Recent research underscores that visceral fat secretes lower adiponectin while simultaneously increasing pro-inflammatory cytokines like tumor necrosis factor-alpha (TNF-α) and interleukin-6 (IL-6), fostering insulin resistance via paracrine and systemic pathways [6, 45]. This has been confirmed by imaging-based studies and wearable sensor data that correlate visceral fat mass with metabolic dysfunction more strongly than overall adiposity [42, 46].
Adiponectin showed moderate-to-strong negative relationships with multiple markers of metabolic dysfunction, including FPG, TG, TC, LDL and a strong positive relationship with HDLC. These associations support a multifaceted regulatory role of adiponectin in lipid metabolism and its potential to mitigate atherogenic risk [47-49]. Several studies have corroborated these results, describing adiponectin as a key regulator of cholesterol efflux, lipoprotein metabolism and endothelial function, thereby linking it directly to cardiovascular protection in patients with T2DM and central obesity [48, 50].
Although obese individuals showed a trend toward lower insulin and adiponectin levels, HOMA-IR values did not differ significantly between the overweight and obese groups. The lack of significant difference in HOMA-IR despite lower adiponectin in obese participants may reflect a ceiling effect in insulin resistance progression among patients with moderately controlled T2DM. Alternatively, this observation could be influenced by ethnic-specific insulin dynamics, hepatic insulin clearance, or β-cell compensatory mechanisms not captured in our analysis. Similar patterns have been described in Asian cohorts where metabolic impairment occurs at relatively lower BMI thresholds [51, 52].
The regulatory mechanisms governing adiponectin expression are complex and involve both genetic and environmental factors [53-55]. Several single-nucleotide polymorphisms in the ADIPOQ gene, particularly rs2241766 and rs1501299, have been shown to affect circulating adiponectin levels and confer increased risk for insulin resistance, T2DM and metabolic syndrome in various populations [56, 57]. In addition, emerging evidence indicates that epigenetic modifications, such as DNA methylation of the ADIPOQ promoter, can suppress gene expression in response to obesity-induced oxidative stress or inflammation [53, 58]. These insights highlight the need for future genetic stratification in adiponectin-related research and interventions.
The therapeutic implications of our findings are substantial. Current pharmacologic agents that increase adiponectin, such as thiazolidinediones, GLP-1 receptor agonists and SGLT2 inhibitors, have shown efficacy in improving insulin sensitivity and lipid profiles in patients with visceral obesity [59, 60]. Moreover, lifestyle interventions like aerobic exercise, caloric restriction and omega-3 fatty acid supplementation have also demonstrated the ability to elevate adiponectin levels, leading to improved glycemic and lipid outcomes [61-64]. These findings advocate for a multipronged approach to treatment in obese T2DM patients, where restoring adiponectin could become a valuable therapeutic target.
Emerging therapeutic molecules like AdipoRon, a synthetic agonist of AdipoR1 and AdipoR2, have gained considerable attention. Preclinical studies show that AdipoRon mimics adiponectin action, enhances insulin sensitivity and reduces glucose levels [45, 48]. Despite being in the early stages of development, these compounds hold significant potential as adiponectin-targeted pharmacotherapies, offering a novel therapeutic approach particularly relevant for individuals with genetic or epigenetic deficiencies in endogenous adiponectin production. The current study supports the use of adiponectin as a biomarker for early metabolic risk detection in centrally obese individuals. Several prospective studies have reported that low baseline adiponectin levels are predictive of future T2DM onset and cardiovascular events, even in individuals with normal BMI or HbA1c [54, 65]. This underscores adiponectin’s value as a mechanistic biomarker, not merely a reflection of adiposity but a functional indicator of metabolic and cardiovascular homeostasis.
Despite the strong correlations observed, the so-called “adiponectin paradox” should be acknowledged. This phenomenon refers to paradoxically elevated adiponectin levels in patients with advanced chronic conditions, such as chronic kidney disease, congestive heart failure, or cachexia, where higher adiponectin is associated with worse outcomes [39, 64]. While such cases were excluded from our study, this complexity highlights the need for context-specific interpretation of adiponectin data, especially in elderly or comorbid populations.
There are some limitations to our study. The cross-sectional design does not allow us to establish a temporal or causal relationship between adiponectin and insulin resistance. However, our findings are consistent with extensive experimental and clinical evidence demonstrating the role of adiponectin in modulating insulin sensitivity through AMPK and PPAR-α pathways. In this context, our study supports the biological plausibility of adiponectin as a modulator while acknowledging that our design can only confirm association. Future longitudinal and interventional studies are needed to demonstrate causality directly. Although we excluded patients using agents that directly influence adiponectin, residual confounding from unmeasured factors such as diet, physical activity, socioeconomic status and genetic predisposition cannot be entirely ruled out. Also, the generalizability of our findings may be limited to South Asian populations with similar metabolic characteristics; validation in larger, multiethnic cohorts is warranted.
Conclusion
Adiponectin is a key modulator of insulin sensitivity in individuals with visceral obesity-associated T2DM. Its strong inverse association with HOMA-IR, central adiposity and dyslipidemia highlights its value as a sensitive biomarker of metabolic dysfunction. Unlike general obesity measures, adiponectin more precisely reflects the pathophysiological impact of visceral fat and offers a meaningful target for improving insulin resistance and cardiometabolic health. The novelty of this study lies in its focus on a South Asian cohort, a high-risk population that develops metabolic complications at lower BMI thresholds and in its subgroup analysis of overweight versus obese patients. These findings emphasize adiponectin as a promising therapeutic target and a mechanistic biomarker for early risk detection in populations with central obesity.
Acknowledgments
The authors sincerely thank the laboratory staff at Thumbay Lab, Gulf Medical University, for their invaluable support and dedicated assistance throughout the research process.
Financial Disclosure
The authors declare no financial conflict of interest.
Conflict of Interest
The authors do not have any conflict of interest.
Informed Consent
A structured questionnaire, administered alongside written informed consent, was used to collect data on participants’ clinical history and family history.
Authors Contributions
AS led and coordinated all phases of the research, ensuring its effective execution. SA was responsible for quality assurance, verifying the accuracy and reliability of the findings. MJ contributed key medical expertise and guidance throughout the study.
Data Availability
The data supporting the findings of this study are available from the corresponding author upon reasonable request.
Abbreviations
ADA: American Diabetes Association; ADIPOQ: Adiponectin, C1Q And Collagen Domain Containing Gene; AdipoR1: adiponectin receptor 1; AdipoR2: adiponectin receptor 2; AMPK: AMP-activated protein kinase; BMI: body mass index; CLIA: chemiluminescent immunoassay; ELISA: enzyme-linked immunosorbent assay; FPG: fasting plasma glucose; HbA1c: glycated hemoglobin; HDL: high-density lipoprotein; HOMA-IR: homeostatic model assessment for insulin resistance; HPLC: high-performance liquid chromatography; IDF: International Diabetes Federation; IQR: interquartile range; LDL: low-density lipoprotein; PPAR-α: peroxisome proliferator-activated receptor-alpha; PPBG: postprandial blood glucose; SD: standard deviation; SGLT2: sodium-glucose cotransporter-2; SPSS: Statistical Package for the Social Sciences; TC: total cholesterol; TG: triglycerides; T2DM: type 2 diabetes mellitus; TNF-α: tumor necrosis factor-alpha; WC: waist circumference
| References | ▴Top |
- Sun S, Cao M, Li H, Du J, Wang J, Ge X, Zhang H, et al. Obesity and
type 2 diabetes mellitus: connections in epidemiology, pathophysiology and treatment. Front
Endocrinol. 2023;14:1140490.
doi - Stefan N. Metabolically healthy and unhealthy normal weight and
obesity. Endocrinol Metab (Seoul). 2020;35(3):487-493.
doi pubmed - Shin HI, Jung SH. Body fat distribution and associated risk of
cardiovascular disease in adults with cerebral palsy. Front Neurol. 2021;12:733294.
doi pubmed - Korac A, Srdic-Galic B, Kalezic A, Stancic A, Otasevic V, Korac B,
Jankovic A. Adipokine signatures of subcutaneous and visceral abdominal fat in normal-weight and
obese women with different metabolic profiles. Arch Med Sci. 2021;17(2):323-336.
doi pubmed - Cai Y, Liu P, Xu Y, Xia Y, Peng X, Zhao H, Chen Q. Biomarkers of
obesity-mediated insulin resistance: focus on microRNAs. Diabetol Metab Syndr.
2023;15(1):167.
doi pubmed - Kawai T, Autieri MV, Scalia R. Adipose tissue inflammation and
metabolic dysfunction in obesity. Am J Physiol Cell Physiol.
2021;320(3):C375-C391.
doi pubmed - Lovfors W, Magnusson R, Jonsson C, Gustafsson M, Olofsson CS,
Cedersund G, Nyman E. A comprehensive mechanistic model of adipocyte signaling with layers of
confidence. NPJ Syst Biol Appl. 2023;9(1):24.
doi pubmed - Zhao S, Kusminski CM, Scherer PE. Adiponectin, leptin and
cardiovascular disorders. Circ Res. 2021;128(1):136-149.
doi pubmed - Achari AE, Jain SK. Adiponectin, a therapeutic target for obesity,
diabetes, and endothelial dysfunction. Int J Mol Sci. 2017;18(6):1321.
doi pubmed - Aparecida Silveira E, Vaseghi G, de Carvalho Santos AS, Kliemann N,
Masoudkabir F, Noll M, Mohammadifard N, et al. Visceral obesity and its shared role in cancer
and cardiovascular disease: a scoping review of the pathophysiology and pharmacological
treatments. Int J Mol Sci. 2020;21(23):9042.
doi pubmed - Un Nisa K, Reza MI. Key relevance of epigenetic programming of
adiponectin gene in pathogenesis of metabolic disorders. Endocr Metab Immune Disord Drug
Targets. 2020;20(4):506-517.
doi pubmed - Choi HM, Doss HM, Kim KS. Multifaceted physiological roles of
adiponectin in inflammation and diseases. Int J Mol Sci. 2020;21(4):1219.
doi pubmed - Gastaldelli A, Sabatini S, Carli F, Gaggini M, Bril F,
Belfort-DeAguiar R, Positano V, et al. PPAR-gamma-induced changes in visceral fat and
adiponectin levels are associated with improvement of steatohepatitis in patients with NASH.
Liver Int. 2021;41(11):2659-2670.
doi pubmed - Li X, Zhang D, Vatner DF, Goedeke L, Hirabara SM, Zhang Y, Perry RJ,
et al. Mechanisms by which adiponectin reverses high fat diet-induced insulin resistance in
mice. Proc Natl Acad Sci U S A. 2020;117(51):32584-32593.
doi pubmed - Sun C, Mao S, Chen S, Zhang W, Liu C. PPARs-orchestrated metabolic
homeostasis in the adipose tissue. Int J Mol Sci. 2021;22(16):8974.
doi pubmed - Xu N, Li X, Weng J, Wei C, He Z, Doycheva DM, Lenahan C, et al.
Adiponectin ameliorates GMH-induced brain injury by regulating microglia M1/M2 polarization via
AdipoR1/APPL1/AMPK/PPARgamma signaling pathway in neonatal rats. Front Immunol.
2022;13:873382.
doi pubmed - Roy B, Palaniyandi SS. Tissue-specific role and associated downstream
signaling pathways of adiponectin. Cell Biosci. 2021;11(1):77.
doi pubmed - Al-Nbaheen MS. Effect of genetic variations in the ADIPOQ Gene on
susceptibility to type 2 diabetes mellitus. Diabetes Metab Syndr Obes.
2022;15:2753-2761.
doi pubmed - Blazejewska W, Dabrowska J, Michalowska J, Bogdanski P. The role of
adiponectin and ADIPOQ variation in metabolic syndrome: a narrative review. Genes (Basel).
2025;16(6):699.
doi pubmed - Abdalla MMI. Therapeutic potential of adiponectin in prediabetes:
strategies, challenges, and future directions. Ther Adv Endocrinol Metab.
2024;15:20420188231222371.
doi pubmed - Becic T, Studenik C, Hoffmann G. Exercise increases adiponectin and
reduces leptin levels in prediabetic and diabetic individuals: systematic review and
meta-analysis of randomized controlled trials. Med Sci (Basel). 2018;6(4):97.
doi pubmed - Yoo EG. Waist-to-height ratio as a screening tool for obesity and
cardiometabolic risk. Korean J Pediatr. 2016;59(11):425-431.
doi pubmed - Liu S, Yu J, Wang L, Zhang X, Wang F, Zhu Y. Weight-adjusted waist
index as a practical predictor for diabetes, cardiovascular disease, and non-accidental
mortality risk. Nutr Metab Cardiovasc Dis. 2024;34(11):2498-2510.
doi pubmed - Baldelli S, Aiello G, Mansilla Di Martino E, Campaci D, Muthanna FMS,
Lombardo M. The role of adipose tissue and nutrition in the regulation of adiponectin.
Nutrients. 2024;16(15):2436.
doi pubmed - Kanwal A, Kanwar N, Bharati S, Srivastava P, Singh SP, Amar S.
Exploring new drug targets for type 2 diabetes: success, challenges and opportunities.
Biomedicines. 2022;10(2):331.
doi pubmed - Lu X, Xie Q, Pan X, Zhang R, Zhang X, Peng G, Zhang Y, et al. Type 2
diabetes mellitus in adults: pathogenesis, prevention and therapy. Signal Transduct Target Ther.
2024;9(1):262.
doi pubmed - Kim JE, Kim JS, Jo MJ, Cho E, Ahn SY, Kwon YJ, Ko GJ. The roles and
associated mechanisms of adipokines in development of metabolic syndrome. Molecules.
2022;27(2):334.
doi pubmed - Shaheer A, Kumar A, Menon P, Jallo M, Basha S. Effect of Add-On
Therapy of Sodium-Glucose Cotransporter 2 Inhibitors and Dipeptidyl Peptidase 4 Inhibitors on
Adipokines in Type 2 Diabetes Mellitus. J Clin Med Res. 2021;13(6):355-362.
doi pubmed - Supriya R, Tam BT, Yu AP, Lee PH, Lai CW, Cheng KK, Yau SY, et al.
Adipokines demonstrate the interacting influence of central obesity with other cardiometabolic
risk factors of metabolic syndrome in Hong Kong Chinese adults. PLoS One.
2018;13(8):e0201585.
doi pubmed - Luo L, Liu M. Adiponectin: friend or foe in obesity and inflammation.
Med Rev (2021). 2022;2(4):349-362.
doi pubmed - Alimi M, Goodarzi MT, Nekoei M. Association of ADIPOQ rs266729 and
rs1501299 gene polymorphisms and circulating adiponectin level with the risk of type 2 diabetes
in a population of Iran: a case-control study. J Diabetes Metab Disord.
2021;20(1):87-93.
doi pubmed - Wilbon SS, Kolonin MG. GLP1 receptor agonists-effects beyond obesity
and diabetes. Cells. 2023;13(1):65.
doi pubmed - Hong X, Zhang X, You L, Li F, Lian H, Wang J, Mao N, et al.
Association between adiponectin and newly diagnosed type 2 diabetes in population with the
clustering of obesity, dyslipidaemia and hypertension: a cross-sectional study. BMJ Open.
2023;13(2):e060377.
doi pubmed - Huang F, Del-Rio-Navarro BE, Leija-Martinez J, Torres-Alcantara S,
Ruiz-Bedolla E, Hernandez-Cadena L, Barraza-Villarreal A, et al. Effect of omega-3 fatty acids
supplementation combined with lifestyle intervention on adipokines and biomarkers of endothelial
dysfunction in obese adolescents with hypertriglyceridemia. J Nutr Biochem.
2019;64:162-169.
doi pubmed - Sharma M, Mohapatra J, Malik U, Nagar J, Chatterjee A, Ramachandran
B, Jain MR. Effect of pioglitazone on metabolic features in endotoxemia model in obese diabetic
db/db mice. J Diabetes. 2017;9(6):613-621.
doi pubmed - Mohammad Rahimi GR, Niyazi A, Alaee S. The effect of exercise
training on osteocalcin, adipocytokines, and insulin resistance: a systematic review and
meta-analysis of randomized controlled trials. Osteoporos Int. 2021;32(2):213-224.
doi pubmed - Sirico F, Bianco A, D'Alicandro G, Castaldo C, Montagnani S, Spera R,
Di Meglio F, et al. Effects of physical exercise on adiponectin, leptin, and inflammatory
markers in childhood obesity: systematic review and meta-analysis. Child Obes.
2018;14(4):207-217.
doi pubmed - Przybycinski J, Dziedziejko V, Puchalowicz K, Domanski L, Pawlik A.
Adiponectin in chronic kidney disease. Int J Mol Sci. 2020;21(24):9375.
doi pubmed - Nielsen MB, Colak Y, Benn M, Mason A, Burgess S, Nordestgaard BG.
Plasma adiponectin levels and risk of heart failure, atrial fibrillation, aortic valve stenosis,
and myocardial infarction: large-scale observational and Mendelian randomization evidence.
Cardiovasc Res. 2024;120(1):95-107.
doi pubmed - Khoramipour K, Chamari K, Hekmatikar AA, Ziyaiyan A, Taherkhani S,
Elguindy NM, Bragazzi NL. Adiponectin: structure, physiological functions, role in diseases, and
effects of nutrition. Nutrients. 2021;13(4):1180.
doi pubmed - Chandrasekaran P, Weiskirchen R. The role of obesity in type 2
diabetes mellitus-an overview. Int J Mol Sci. 2024;25(3):1882.
doi pubmed - Zhang Z, Zhao L, Lu Y, Meng X, Zhou X. Association between Chinese
visceral adiposity index and risk of stroke incidence in middle-aged and elderly Chinese
population: evidence from a large national cohort study. J Transl Med.
2023;21(1):518.
doi pubmed - Longo M, Zatterale F, Naderi J, Parrillo L, Formisano P, Raciti GA,
Beguinot F, et al. Adipose tissue dysfunction as determinant of obesity-associated metabolic
complications. Int J Mol Sci. 2019;20(9):2358.
doi pubmed - Fang H, Judd RL. Adiponectin regulation and function. Compr Physiol.
2018;8(3):1031-1063.
doi pubmed - Kim Y, Lim JH, Kim EN, Hong YA, Park HJ, Chung S, Choi BS, et al.
Adiponectin receptor agonist ameliorates cardiac lipotoxicity via enhancing ceramide metabolism
in type 2 diabetic mice. Cell Death Dis. 2022;13(3):282.
doi pubmed - Jung HN, Jung CH. The role of anti-inflammatory adipokines in
cardiometabolic disorders: moving beyond adiponectin. Int J Mol Sci.
2021;22(24):13529.
doi pubmed - Kaze AD, Musani SK, Bidulescu A, Joseph JJ, Correa A, Ndumele CE,
Bertoni AG, et al. Plasma adipokines and glycaemic progression among African Americans: Findings
from the Jackson Heart Study. Diabet Med. 2021;38(5):e14465.
doi pubmed - Abou-Samra M, Selvais CM, Boursereau R, Lecompte S, Noel L, Brichard
SM. AdipoRon, a new therapeutic prospect for Duchenne muscular dystrophy. J Cachexia
Sarcopenia Muscle. 2020;11(2):518-533.
doi pubmed - Wang Y, Li Y, Qiao J, Li N, Qiao S. AMPK alpha1 mediates the
protective effect of adiponectin against insulin resistance in INS-1 pancreatic beta cells. Cell
Biochem Funct. 2019;37(8):625-632.
doi pubmed - Lim SH, Lee HS, Han HK, Choi CI. Saikosaponin A and D Inhibit
Adipogenesis via the AMPK and MAPK Signaling Pathways in 3T3-L1 Adipocytes.
Int J Mol Sci. 2021;22(21):11409.
doi pubmed - Merz KE, Thurmond DC. Role of skeletal muscle in insulin resistance
and glucose uptake. Compr Physiol. 2020;10(3):785-809.
doi pubmed - Li Z, Daniel S, Fujioka K, Umashanker D. Obesity among Asian American
people in the United States: a review. Obesity (Silver Spring). 2023;31(2):316-328.
doi pubmed - Lee MA, Song M, Bessette H, Roberts Davis M, Tyner TE, Reid A. Use of
wearables for monitoring cardiometabolic health: A systematic review. Int J Med
Inform. 2023;179:105218.
doi pubmed - Wei J, Liu X, Xue H, Wang Y, Shi Z. Comparisons of visceral adiposity
index, body shape index, body mass index and waist circumference and their associations with
diabetes mellitus in adults. Nutrients. 2019;11(7):1580.
doi pubmed - He L, Xuan W, Liu D, Zhong J, Luo H, Cui H, Zhang X, et al. The role
of adiponectin in the association between abdominal obesity and type 2 diabetes: a mediation
analysis among 232,438 Chinese participants. Front Endocrinol (Lausanne).
2024;15:1327716.
doi pubmed - Pemmasani SK, Raman R, Acharya A. Prevalence rates of ADIPOQ
polymorphisms in Indian population and a comparison with other populations.
Indian J Endocrinol Metab. 2018;22(1):36-40.
doi pubmed - Alimi M, Goodarzi MT, Nekoei M. Adiponectin gene polymorphisms and
risk of type 2 diabetes: an updated evidence for meta-analysis. Diabetol Metab Syndr.
2021;13(1):133.
doi pubmed - Nikolettos K, Vlahos N, Pagonopoulou O, Nikolettos N, Zikopoulos K,
Tsikouras P, Kontomanolis E, et al. The association between leptin, adiponectin levels and the
ovarian reserve in women of reproductive age. Front Endocrinol (Lausanne).
2024;15:1369248.
doi pubmed - Iwabu M, Okada-Iwabu M, Tanabe H, Ohuchi N, Miyata K, Kobori T,
Odawara S, et al. AdipoR agonist increases insulin sensitivity and exercise endurance in
AdipoR-humanized mice. Commun Biol. 2021;4(1):45.
doi pubmed - Janiszewska J, Ostrowska J, Szostak-Wegierek D. The influence of
nutrition on adiponectin-a narrative review. Nutrients. 2021;13(5):1394.
doi pubmed - Iwabu M, Okada-Iwabu M, Yamauchi T, Kadowaki T. Adiponectin/AdipoR
research and its implications for lifestyle-related diseases. Front Cardiovasc Med.
2019;6:116.
doi pubmed - Satoh K, Nagasawa K, Takebe N, Kinno H, Shozushima M, Onodera K, Oda
T, et al. Adiponectin paradox more evident in non-obese than in obese patients with diabetic
microvascular complications. Diabetes Metab Syndr Obes. 2023;16:201-212.
doi pubmed - Metz S, Huang LO, Kilpelainen TO. Genetic variation, adipokines, and
cardiometabolic disease. Curr Opin Pharmacol. 2020;52:33-39.
doi pubmed - Wang Q, Ren D, Bi Y, Yuan R, Li D, Wang J, Wang R, et al. Association
and functional study between ADIPOQ and metabolic syndrome in elderly Chinese Han population.
Aging (Albany NY). 2020;12(24):25819-25827.
doi pubmed - Murata H, Yagi T, Midorikawa T, Torii S, Takai E, Taguchi M.
Comparison between DXA and MRI for the Visceral Fat Assessment in Athletes.
Int J Sports Med. 2022;43(7):625-631.
doi pubmed
This
article is distributed under the terms of the Creative Commons Attribution Non-Commercial 4.0
International License, which permits unrestricted non-commercial use, distribution, and
reproduction in any medium, provided the original work is properly cited.
Journal
of Endocrinology and Metabolism is published by Elmer Press Inc.