| Journal of Endocrinology and Metabolism, ISSN 1923-2861 print, 1923-287X online, Open Access |
| Article copyright, the authors; Journal compilation copyright, J Endocrinol Metab and Elmer Press Inc |
| Journal website https://jem.elmerpub.com |
Original Article
Volume 15, Number 4, October 2025, pages 161-180

Link Between Immune Dysregulation in COVID-19 and Beta-Cell Dysfunction
Victoria Tsvetanova Tsvetkovaa, b, c, Malvina Svilenova Todorovaa, b, Katya Nikolova Todorovaa, b
aClinic of Endocrinology, University Hospital “Georgi Stranski” -
Pleven, Pleven, Bulgaria
bDepartment of Cardiology, Pulmonology, Endocrinology
and Rheumatology, Medical University - Pleven, Pleven, Bulgaria
cCorresponding
Author: Victoria Tsvetanova Tsvetkova, Department of Cardiology, Pulmonology, Endocrinology and
Rheumatology, Clinic of Endocrinology, University Hospital “Georgi Stranski” -
Pleven, Pleven, Bulgaria
Manuscript submitted July 14, 2025, accepted September 25, 2025, published online October 6,
2025
Short title: Immune Dysregulation in COVID-19 and Beta-Cell Dysfunction
doi:
https://doi.org/10.14740/jem1547
| Abstract | ▴Top |
Background: The increased rates of new-onset hyperglycemia during coronavirus disease 2019 (COVID-19) illness gave reason to assume that the severe acute respiratory syndrome coronavirus 2 (SARS-CoV-2) infection could damage the insulin-producing pancreatic beta cells and also interfere with glucose metabolism. The aim of the current study was to investigate the role of SARS-CoV-2 infection and the related inflammation in pathogenesis of pancreatic beta-cell dysfunction and different types of newly emerging disorders of carbohydrate metabolism following infection.
Methods: In the current study, 100 patients (34 males and 66 women) were included (mean age 53.07 ± 3.27 years). They were divided into three groups: group 1 (unselected patients with active COVID-19 infection; n = 32), group 2 (individuals with newly diagnosed carbohydrate disorders after proven COVID-19 or post-COVID-19 group; n = 35) and group 3 (COVID-19-negative persons with metabolic syndrome; n = 33). Standard biochemical and hormonal and immunological parameters were measured using enzyme-linked immunosorbent assay (ELISA) and electrochemiluminescence immunoassay (ECLIA) methods, as wells as some indices for assessment of insulin secretion, and sensitivity was calculated using the corresponding formula.
Results: Patients with active coronavirus infection had significantly higher levels of hypoxia inducible factor-1 alpha (HIF-1α) compared to the other two groups (P < 0.001) and also demonstrated higher levels of interferon-gamma (INF)-γ (P < 0.001) and human complement factor D (HCFD) (P < 0.001), compared to the post-COVID-19 group, whereas the latter had significantly higher levels of 8-epi-prostaglandyn F2 alpha (8-epi-PGF2α, P < 0.001). Both groups (active and post-COVID-19) demonstrated similar levels of cluster of differentiation (CD)4, CD8, interleukin (IL)-7, IL-17A and IL-10 (P > 0.05). Among the individuals in the post-COVID-19 group, a positive correlation was found between fasting glucose (r = 0.369; P < 0.05) and glycated hemoglobin (HbA1c) levels (r = 0.510; P < 0.05).
Conclusions: The changes in immune homeostasis (during and after recovery from COVID-19) including imbalance between pro- and anti-inflammatory cytokines, along with the cellular immune response and the complement system, are grounds to assume that in some of the cases of newly emerging disorders in glucose homeostasis after COVID-19, immunological disorders are present, as well as an imbalance between pro- and antioxidants.
Keywords: COVID-19; Beta-cells dysfunction; Immune dysregulation; New-onset carbohydrate disorders
| Introduction | ▴Top |
The increased rates of new-onset hyperglycemia during coronavirus disease 2019 (COVID-19) gave reason to assume that the severe acute respiratory syndrome coronavirus 2 (SARS-CoV-2) infection could damage the insulin-producing pancreatic beta cells and also interfere with glucose metabolism. This fact has set a new focus of research interest in studying potential mechanisms leading to hyperglycemia or diabetes mellitus (DM). Literature data indicate that coronaviruses can damage pancreatic beta cells by direct or indirect mechanisms and cause changes in insulin synthesis, secretion and sensitivity.
SARS-CoV-2 has multidirectional effects on pancreatic beta cells, leading to alterations in their function [1, 2]. These include increased levels of cellular stress [3], cell death (apoptosis) [1, 4], beta-cell dedifferentiation and transdifferentiation [3], as well as insulin resistance (IR) and alterations in lipid metabolism [5, 6].
The link between SARS-CoV-2 and type 1 diabetes mellitus (T1DM) [7] has now been proven. COVID-19 may act as a trigger for new-onset T1DM or accelerate its progression, particularly in individuals with pre-existing autoimmune risk, by damaging pancreatic islet cells (direct viral-induced beta-cell injury) and potentially through autoimmune mechanisms (immune-mediated damage) [8].
During the pandemic, an increase in cases of hyperglycemia, diabetic ketoacidosis (DKA), and new diagnosed T1DM has been observed, pointing to a potential link with SARS-CoV-2 [9-13]. Reports from the first wave of COVID-19 in 2020 indicated an increased incidence of new-onset glutamic acid decarboxylase (GAD)-65 positive T1DM among children and adolescents after recovery from the infection [9, 10]. Several studies later confirmed an increase in cases of new-onset T1DM [11, 12], including those of COVID-19-induced T1DM presenting with hyperglycemia, DKA, low C-peptide levels, and negative antibodies [13]. According to data from the Centers for Disease Control and Prevention in USA (2022), COVID-19 is associated with a twofold higher risk of developing T1DM among individuals aged < 18 years (hazard ratio (HR) = 2.66, 95% confidence interval CI = 1.98 - 3.56) [14].
Another mechanism proposed for potential diabetogenic effect of the virus is based on the fact that SARS-CoV-2, exhibiting organotropism, can also attack the islet capillaries due to the increased angiotensin-converting enzyme 2 (ACE2) expression. This leads to the development of acute pancreatitis due to virus-induced micro-occlusion in the capillaries of the islets of Langerhans, with subsequent ischemia, necrosis and insulinopenia [15]. An association between pancreatic thrombofibrosis and new-onset diabetes in patients with COVID-19 has also been reported [16]. Anyway, the reported cases of acute pancreatitis in the course of COVID-19 are not so numerous as to accept this etiological cause as the leading one.
SARS-CoV-2 infection can also act as a trigger of type 2 diabetes mellitus (T2DM). A few meta-analyses [17, 18] confirmed that COVID-19 was associated with an increased risk (relative risk (RR) of 1.70, 95% CI:1.32 - 2.19) of new-onset T2DM [18], both in children and adolescents [19]. Research has indicated that SARS-CoV-2 infection can lead to the development of T2DM within 6 months of the diagnosis, underscoring the potential long-term impacts of the virus, with male gender and infection severity substantially linked to a higher risk of diabetes [20].
The main pathogenetic mechanisms for the emergence of T2DM following COVID-19 include impaired insulin secretion due to beta-cell dysfunction, IR, and prolonged subclinical inflammation, with persistent high levels of inflammatory cytokines contributing to the maintenance of IR and beta-cell dysfunction [5, 6].
Investigations into the association between prediabetes and COVID-19 are almost uncharted [21]. It is plausible that similar COVID-19-induced changes observed in individuals with new-onset T2DM (new-onset or worsened beta-cell dysfunction and IR) may also act as triggers in people with new-onset prediabetes. An increased risk of prediabetes after COVID-19 was reported in a cohort from Nigeria (RR = 7.55, 95% CI: 3.76 - 15.17) [22]. However, the lack of enough standardized studies prevents general conclusions from being drawn.
The specific COVID-19 secretome (specific cytokine profile) may also alter beta-cell function and survival and induce IR and beta-cell dysfunction, which can be transient or permanent [5, 6]. All these data give reason to assume that SARS-CoV-2 induces specific morphological and functional changes in pancreatic beta cells, which in long term, would have an impact on the metabolic homeostasis of the individuals with a potential risk of future development of DM.
Aim of the study
The aim of the current study is to investigate the role of SARS-CoV-2 infection and the related inflammation in pathogenesis of pancreatic beta-cell dysfunction and different types of newly emerging disorders of carbohydrate metabolism following infection.
| Materials and Methods | ▴Top |
Study design
A prospective observational study was conducted in 100 hospitalized participants (34 men and 66 women) at the Clinic of Pulmonology and Phthisiology and the Clinic of Endocrinology and Metabolic Diseases at the University Hospital “Dr. Georgi Stranski” - Pleven, Bulgaria. In order to study the role of basic and other poorly studied pathophysiological mechanisms involved in the genesis of carbohydrate disorders and pancreatic beta-cell dysfunction, individuals were selected according to precisely defined criteria and divided into three groups, and similar diagnostic, metabolic, biochemical and hormonal aspects were studied in each of them.
Study population
The study population included three groups of patients aged between 18 and 90 years: 1) Group 1: unselected patients with active COVID-19 infection (32 individuals). COVID-19 diagnosis was made using a polymerase chain reaction (PCR) test confirming the presence of the viral genetic material; 2) Group 2: individuals with newly diagnosed/emerging carbohydrate disorders after proven COVID-19 (post-COVID-19 group, 35 individuals). All individuals were unvaccinated and had a history of a positive PCR test for COVID-19 at least 6 months before they were newly diagnosed with carbohydrate disorders. They were diagnosed with T1DM, T2DM, and prediabetic conditions (impaired fasting glucose (IFG) and impaired glucose tolerance (IGT)), as well as patients with IR and/or hyperinsulinemia. Diagnosis of DM was made according to the World Health Organization (WHO) criteria [23]. Prediabetic conditions (IFG, IGT) were diagnosed based on the WHO criteria (2015) [24]. In order to study the early stages of disturbances in beta-cell function, individuals with laboratory constellation for IR and/or hyperinsulinemia, as indicators for beta-cell dysfunction, were also included; 3) Group 3: persons who did not suffer from COVID-19 (COVID-19 negative), with the characteristic of metabolic syndrome (MS, 33 individuals). The diagnosis of MS was made using the International Diabetes Federation (IDF) criteria (2009) [25, 26].
To achieve statistical reliability of the obtained results, each group included more than 30 participants.
Methods
All participants received a survey; anthropometric measurements and basic clinical exams were also performed.
A survey is administered to all participants regarding their age, family history of diabetes and carbohydrate disorders/socially significant disorders, presence of diabetes or prediabetes, its duration and treatment, concomitant diseases and therapy for them, allergies, harmful habits, lifestyle and physical activity.
They also underwent clinical exams including basic anthropometric measurements (height, weight, waist circumference, body mass index (BMI)), blood pressure measurement and additional measures according to the case.
Laboratory tests were performed after venipuncture of the cubital vein. Blood was collected into two tubes, and all invasive procedures were performed after informed consent was signed by the patients.
The blood were divided into two samples: 1) Venous plasma was isolated from peripheral venous blood, taken by venipuncture with a vacutainer with added anticoagulant (K-EDTA) and stored at -18 °C until the study of the markers; 2) Another tube for blood serum is centrifuged to separate the serum, which was frozen in a refrigerator at -18 °C until the time of performing the immunological markers.
The hormonal samples were studied by electrochemiluminescence immunoassay (ECLIA), according to the methodology of each test, on an automated analyzer. All immunological samples, as well as the samples for some of the hormonal studies, were investigated by enzyme-linked immunosorbent assay (ELISA), with a multifunctional plate reader “Mithras LB-943”, using the appropriate commercial kits.
Evaluated parameters
Standard biochemical parameters
Standard biochemical parameters included fasting plasma glucose, glycated hemoglobin (HbA1c), lipid profile parameters (total cholesterol, triglycerides, high-density lipoprotein (HDL)-cholesterol, low-density lipoprotein (LDL)-cholesterol), uric acid, and liver function tests (aspartate aminotransferase (AST), alanine aminotransferase (ALT)).
Hormonal parameters
Hormonal parameters measured included fasting insulin, C-peptide, proinsulin, glucagon, golgi protein-73 (GP-73), leptin, and adiponectin.
Immunological parameters
Immunological parameters included cluster of differentiation (CD)4, CD8, interleukin (IL)-7, IL-10, IL-17A, interferon-gamma (IFN-γ), tumor-necrosis factor-alpha (TNF-α); human complement factor D (HCFD), 8-epi-prostaglandyn F2 alpha (8-epi-PGF2α), nuclear factor erythroid 2-related factor 2 (NFE2L2) and hypoxia inducible factor-1 alpha (HIF-1α): 1) CD4 and CD8 were evaluated as markers for T-helper lymphocyte (Th-Ly) and T-cytotoxic lymphocyte (Tc-Ly), respectively, in assessing the cell-mediated immune response; 2) IL-7 and IL-10 were evaluated for their function as anti-inflammatory cytokines along with their function in maintaining immune homeostasis; 3) IL-17A along with TNF-α and INF-γ levels were monitored to study the role of some potent pro-inflammatory cytokines; 4) HCFD levels were monitored as a marker for alternative pathway of complementary system; 5) 8-epi-PGF2α and NFE2L2 were monitored as markers for oxidative stress and antioxidant defense, respectively; 6) Serum HIF-1α levels were followed in order to assess cellular hypoxia.
Additional indices
Additional indices included the assessments of insulin secretion and sensitivity by determining surrogate insulin indices, calculated according to corresponding the formula: 1) homeostasis model assessment of insulin resistance (HOMA-IR) was used to assess IR and was calculated according to the formula: HOMA-IR = fasting plasma glucose (mmol/L) × fasting insulin (µIU/mL)/22 [27]; 2) HOMA%B was used to assess beta-cell function and was calculated according to the formula: HOMA%B = 20 × fasting insulin (µIU/mL)/fasting plasma glucose (mmol/L) - 3.5 [27]; 3) Insulin/proinsulin ratio was used to assess beta-cell function and as a marker for disproportionate hyperproinsulinemia. It was calculated according to the formula: insulin/proinsulin ratio = insulin (pmol/L)/proinsulin (pmol/L). Previously, the values of insulin and proinsulin were converted into the corresponding units of measurement, respectively, according to the formulas: insulin (pmol/L) = insulin (µIU/mL)/6.945; proinsulin (pg/mL) = proinsulin (ng/mL)/6.945; 4) C-peptide/glucose ratio was calculated as additional marker for beta-cell dysfunction according to the formula: C-peptide/glucose ratio = C-peptide (ng/mL)/fasting glucose (mg/dL) (× 100). Previously, glucose values were converted to the corresponding unit of measurement using the formula: glucose (mg/dL) = glucose (mmol/L) × 18.018; 5) Adiponectin/leptin ratio was calculated according to the formula: adiponectin/leptin ratio = adiponectin (µg/mL)/leptin (ng/mL). Previously, adiponectin values were converted to the corresponding unit of measurement using the formula: adiponectin (µg/mL) = adiponectin (ng/mL)/1,000. It was used as an indicator for adipocyte dysfunction as well as for IR.
Statistical analysis
The Statistical Package for Social Sciences version 25 (SPSS-25) was used for data statistical analysis. The data were presented in suitable tables and figures. Tests were used to check the normality of the distribution of quantitative variables and to search for relationships between qualitative variables. Quantitative variables were expressed as mean value, standard deviation (SD), standard error of the mean, and a 95% CI for the mean. The determined mean values and their SDs are denoted as mean ± SD. Kruskal-Wallis and Mann-Whitney tests were used to determine statistically significant differences. Differences at an empirical significance level of P < 0.05 were considered statistically significant. Correlation analysis was performed in order to search for a correlation coefficient (r) showing an association between the variables evaluated. Only statistically significant correlations (P < 0.05) were considered.
Ethical principles
The study is performed after receiving ethical approval from the Ethical Commission of Medical University Pleven (Protocol No. 72/23.06.23). The study adhered to the ethical principles of the Declaration of Helsinki. Each person included in the study declared their voluntary willingness to participate in the study and gave their consent for the publication of their deidentified clinical data by signing and dating the consent form. The researcher also signed the informed consent, declaring his obligation to comply with the ethical principles set out in the Declaration of Helsinki. No psychological pressure was allowed on the volunteers to sign the informed consent.
| Results and Discussion | ▴Top |
Table 1 shows the main demographic features of the population studied. The mean age of the studied cohort is 53.07 ± 3.27 years old. The oldest group is the one with active COVID-19 (66.71 ± 4.87 years), followed by the referent group of COVID-19-negative subjects with MS (48.21 ± 4.51 years); and the youngest group is presented by patients with new-onset carbohydrate disorder following COVID-19 (45.35 ± 4.98 years), with significant difference between the three groups (P < 0.01).
 Click to view |
Table 1. General Clinical Characteristics of
the Study Population |
Female predominance is most pronounced in the referent group (group 3), whereas in the other two groups, the ratio between female and male are almost similar. Table 1 also shows data about the family history of DM, residence smoking and sedentary lifestyle (defined as spending ≥ 6 h per day sitting or lying down and lacking significant physical activity in daily life).
In Table 2, some basal parameters with influence on the metabolic homeostasis of the studied population are presented, including BMI, history of preexisting DM, newly diagnosed DM, as well as type of newly diagnosed carbohydrate disorder (for individuals from group 2). Limitations of the current data are the lack of BMI values in the group with active coronavirus infection (group 1). Given the general clinical condition of the patients at the time of hospitalization and due to the life-threatening nature of the disease, it was not possible to perform basic anthropometric measurements (height and weight).
Click to view |
Table 2. Metabolic Characteristics of the Study
Population |
Metabolic profile of patients from group 1
The group included a total of 32 individuals with proven coronavirus infection confirmed by PCR. In the studied group, 16 individuals (50%) had DM. In seven of them (21.88%), hyperglycemia was registered (three women and four men) during hospitalization, so they were newly diagnosed with T2DM according to WHO diagnostic criteria for DM. The remaining nine individuals (28.12%) had already been diagnosed with T2DM (three women and six men). Of these, only one (3.13%) was on insulin treatment at the time of hospitalization, while the remaining eight (25%) were on non-insulin therapy including sulfonylurea (SU), metformin, sodium-glucose cotransporter 2 (SGLT-2) inhibitors and glucagon-like peptide-1 receptor analogues (GLP-1 RA).
Metabolic profile of patients from group 2
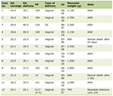
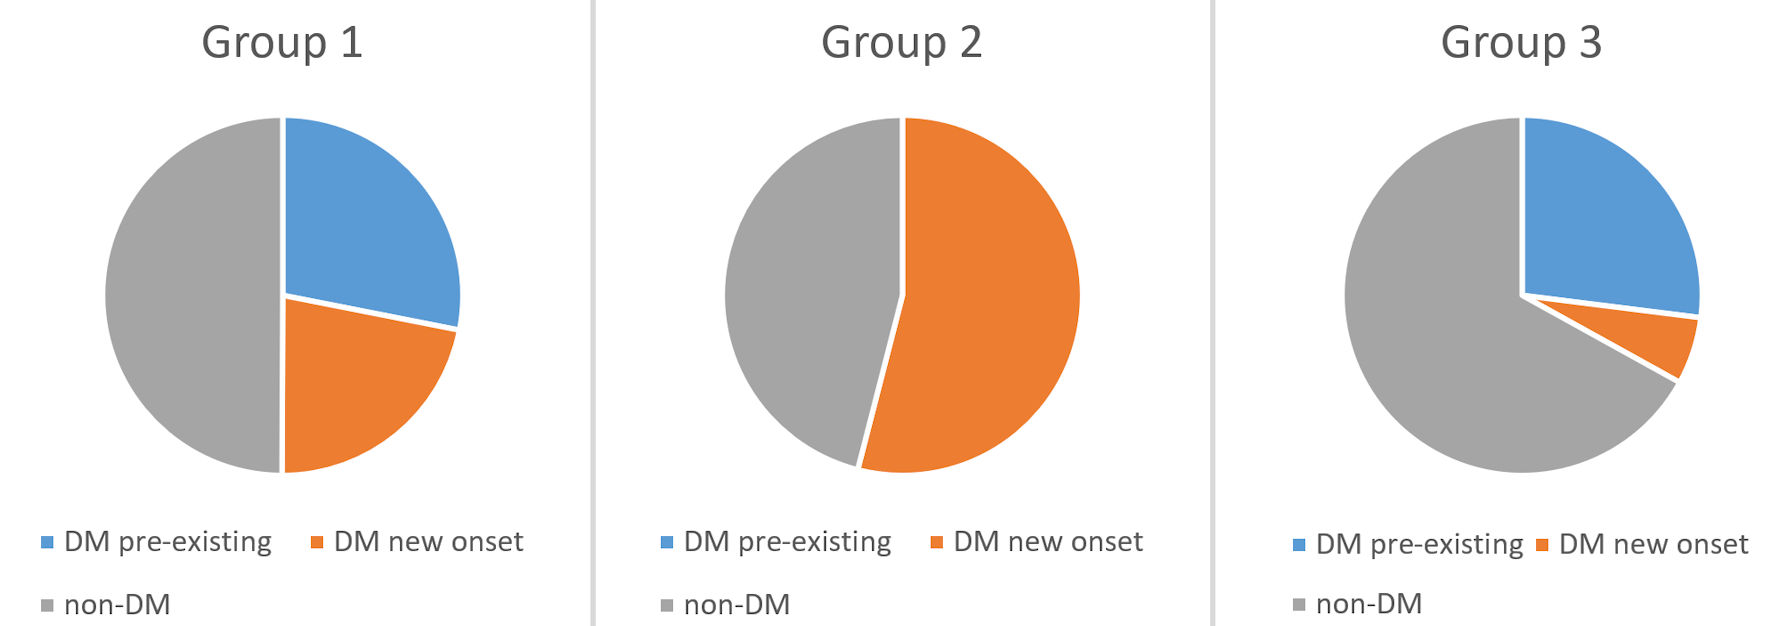
The group included a total of 35 individuals with newly emerging carbohydrate disorders after a coronavirus infection. In the studied group, 19 individuals (54.28%) had newly diagnosed DM. Eight of them were diagnosed with T1DM, including latent autoimmune diabetes in adults (LADA, 22.85%), while the remaining 11 individuals (31.43%) were diagnosed with T2DM. Prediabetes as IGT was found in three individuals (8.57%), and IFG in four subjects (11.43%). The remaining nine individuals, who were normoglycemic (25.72%), had data for basal and/or stimulated hyperinsulinemia and IR (Fig. 1).
 Click for large image |
Figure 1. Distribution of the patients from group 2 (post-COVID-19 group) according to the type of carbohydrate disorder. T1DM: type 1 diabetes mellitus; T2DM: type 2 diabetes mellitus; IFG: impaired fasting glucose; IGT: impaired glucose tolerance; IR: insulin resistance; COVID-19: coronavirus disease 2019. |
All patients, except those with T1DM, had higher BMI values > 30 kg/m2. According to the type of carbohydrate disorder and the mean BMI values in the corresponding subgroup, the distribution of the patient was made and analyzed. As expected, the subgroup of individuals with T1DM reported mean BMI values within the normal body weight range (23.63 kg/m2). The highest mean BMI values were reported in the subgroup of individuals with T2DM (36.64 kg/m2) and those with evidence of IR and/or hyperinsulinemia (36.89 kg/m2). Patients with IFG and IGT demonstrated quite similar values of mean BMI (32.75 kg/m2 and 33.33 kg/m2, respectively) (Table 2).
Metabolic profile of patients from group 3
This group consisted of 33 individuals who had not suffered from COVID-19 and were pre-selected with the characteristic of MS according to IDF criteria. Of these, 11 individuals (33.33%) had the diagnosis of T2DM, and only two of them (6.06%) were newly diagnosed. The remaining individuals had preadiabetes, including two with IFG (6.06%), four with IGT (12.12%) and the remaining normoglycemic 16 (48.48%) had data for basal and/or hyperinsulinemia and IR.
When we evaluated the BMI in the different subgroups (according to the present disorder), it was notable that all individuals had increased BMI values of > 30 kg/m2. The subgroup of individuals with IFG had the highest BMI (41 kg/m2), followed by those with T2DM (BMI: 38.45 kg/m2), which was also higher than the average BMI for the entire group (33.67 kg/m2). Normoglycemic individuals with IR demonstrated the lowest BMI (32.69 kg/m2), compared with those with T2DM and IFG, while those with IGT demonstrated similar levels (33.5 kg/m2) (Table 2).
Lipid profile
Lipid profile parameters were also evaluated and analyzed in all three groups with similar metabolic characteristics (Table 3). Interestingly, the patients with active COVID-19 demonstrated higher levels of serum triglycerides and LDL-cholesterol compared to the post-COVID-19 group and group with MS. Similar in those groups, the lowest levels of HDL-cholesterol were registered.
Click to view |
Table 3. Standard Biochemical Parameters (Lipid
Profile, UA and Liver Function Test) of the Study Population |
In contrast, the group with MS demonstrated higher levels of uric acid, whereas the active COVID-19 group had the lowest levels. Across all groups, individuals with diabetes exhibited higher uric acid levels compared to non-diabetic counterparts from the corresponding group.
As expected, patients with active coronavirus infection demonstrate higher levels of AST and ALT (Table 3). Similar to our findings, many authors have reported elevated levels of liver aminotransferases, and in particular AST and ALT, in patients with COVID-19 [28, 29]. Significantly higher levels were reported in severely and critically ill patients [30].
In the present study, a positive correlation was found between AST levels and one of the pro-inflammatory cytokines IL-17A (r = 0.397; P < 0.05) in individuals with active infection (group 1). Similarly, Effenberger et al reported a correlation between serum levels of AST and another pro-inflammatory cytokine, IL-6 [31]. Another positive correlation (r = 0.514; P < 0.05) was found between the levels of ALT and IL-17A in group 1. Those findings are reasons to assume that IL-17A is one of the main participants in the process of liver involvement and damage during the course of the infection, along with other pro-inflammatory molecules.
Gamma-glutamyl transferase (GGT) levels were also monitored in the study population, particularly in group 1, where the average level was 106.78 IU/L. Elevated levels (GGT > 35 IU/L) were observed in nine individuals (28%).
Immunological parameters
To study the changes in post inflammatory immune response during and following SARS-CoV-2 infection, and the consequence - especially those affecting glucose homeostasis - the levels of some of the pro-inflammatory cytokines, for which there is evidence that they participate in the pathogenesis of the so-called “cytokine storm”, as well as some with a less thoroughly studied role, were evaluated (Table 4).
Click to view |
Table 4. Immunological and Other Parameters
Evaluated Among the Study Population |
Analysis of the cellular-mediated immune response
The mean levels of CD4, a marker for Th-Ly subpopulations and the immune response mediated by them, were evaluated in the studied population. The highest levels were observed in individuals with active COVID-19, which were comparable to those observed in the post-COVID-19 group. There was a significant difference between the levels in subjects with active infection (group 1) and those without disease (group 3) (P = 0.001), where the lowest levels were detected. Thess findings suggest that there is an activation of Th-Ly-mediated immune response in the acute phase, which persists following COVID-19.
CD8 is evaluated as a marker for Tc-Ly subpopulations and the immune reactions with their active participation. The results showed that its levels were the highest in the COVID-19-negative group, followed by the post-COVID-19 group with newly emerging carbohydrate disorders (group 2), and the lowest was found in people with active coronavirus infection (group 1), with no statistically significant differences between the three groups (P = 0.110). The lowest levels of Tc-Ly marker CD8 suggest virus-induced suppression of the Tc-Ly during the active stage of the infection, with subsequent recovery in the convalescent period.
The answer to the question of the extent to which virus-induced changes in the T-cell-mediated immune response can be associated with glycemic disorders is provided by the results of the correlation analysis.
A positive assocciation was found in all three groups between CD4 and CD8 levels, with the strongest found in group 1 (r = 0.899; P < 0.05), followed by group 2 (r = 0.789; P < 0.05). The same was found in group 3 (r = 0.799; P < 0.05). This is not surprising, given the complex intercellular interactions between immune cells that have been observed in the context of SARS-CoV-2 infection, and once again it confirms the observation that immune responses potentiate each other and even persist, maintaining a chronic subclinical inflamatory state, which is main characteristic of the MS.
Analysis of pro- and anti-inflammatory cytokines
Levels of some cytokines are also followed - some with pro- or anti-inflammatory roles, and others well known for their major role in immunomodulation.
TNF-α, as a major cytokine with pleiotropic properties, well known modulator of pro-inflammatory immune reactions, as well as one of the main components of the cytokine storm observed in COVID-19 [32], was evaluated in selected population, and no significant differences were found between the three groups (P = 0.126). Anyway, higher levels were registered among individuals in the post-COVID-19 group (group 2), and they were similar to those in individuals with active infection group (group 1), which is a reason to assume its role in the genesis of both acute and chronic subclinical inflammation. The lowest values of TNF-α were registered in the reference COVID-19-negative group (group 3).
Another potent cytokine, often considered a key effector of immunity, IFN-γ, was also monitored in our study. Known for its major role in activation of cell-mediated immune response (macrophages, natural killer (NK) cells), IFN-γ is also considered one of the major and key components of the cytokine storm [32, 33]. Looking at the levels of INF-γ in the three groups, it is interesting that subjects in group 3 had the highest levels of INF-γ, which were close to those observed in the acute phase (group 1), with no significant difference found between the two groups (P = 0.142). All this suggests that IFN-γ is potentiating and maintaining chronic inflammation in MS, and probably during SARS-CoV-2 infection.
When comparing IFN-γ levels between the two COVID-19-related groups (active COVID-19 (group 1) and post-COVID-19 (group 2)), it turned out that higher levels were found in the acute phase and lower in the post-COVID-19 phase. Interestingly, subjects in group 2 had significantly lower levels of INF-γ, compared to those in group 1 (P < 0.001) and group 3 (P < 0.001).
In contrast to our observations, Montefusco et al found statistically significant (P = 0.0061) higher INF-γ levels in the post-COVID-19 group compared to the active COVID-19 one [5]. A possible reason may be the fact that individuals from our group 2 were strictly selected, according to additional criteria - having previously been infected with SARS-CoV-2, with newly emerging carbohydrate disorders. This is the reason to assume that lower levels of INF-γ, a key modulator of the immune response, may be linked to the pathogenesis of those new-onset disorders in glucose metabolism.
IL-7, a hematopoietic growth factor, is one of the most widely studied cytokines. It plays a central, key role in maintaining immune homeostasis, regulating the development, differentiation, and survival of a number of immune cells. Maintaining optimal IL-7 levels is critical for a normal immune response, as both deficiency and elevated levels can cause some severe immune deficiencies or be associated with the pathogenesis of some autoimmune diseases and leukemias [34, 35]. When comparing its levels in the three groups, it was observed that individuals from groups 1 and 2 demonstrated similar results (P = 0.005). These results give reason to assume that immune homeostasis is disrupted in both active and asymptomatic post-COVID-19 phase. The highest levels were found among individuals with MS, which differed significantly from those observed in group 2 (P < 0.001) and group 1 (P < 0.001). Anyway, all patients demonstrated increased serum IL-7 levels (42.25 ± 5.79 pg/mL), reflecting immune dysregulation associated with both acute and chronic inflammation observed in COVID-19 and MS.
An interesting relationship was found between INF-γ and IL-7 among COVID-19-related groups. In the group with active infection (group 1), along with the post-COVID-19 group (group 2), a positive correlation was observed between INF-γ and IL-7 levels, which was weaker in group 1 (r = 0.462; P < 0.05) and stronger among individuals from group 2 (r = 0.609; P < 0.05). This is another evidence that there is a crosstalk between the immune cells and cytokines during the course and after the disease.
To study the role of anti-inflammatory immune reaction in the course of the disease and after, levels of IL-10, a potent anti-inflammatory cytokine playing an essential and often crucial role in preventing inflammatory and autoimmune reactions [36], were monitored. Our findings were quite similar to those reported in the literature [36, 37]. Patients with active SARS-CoV-2 infection (group 1) demonstrated higher levels, compared to the post-COVID-19 group (group 2). It can be assumed that there is a recovery of its levels. The reference group with MS (group 3) demonstrated the lowest levels, with no statistically significant differences observed between the three groups (P = 0.94).
Levels of IL-17A, another pro-inflammatory cytokine, were followed too. It is known for its important role in initiating and maintaining a potent immune inflammatory response in a number of diseases, including COVID-19 [38, 39]. Similar values were observed in both groups 1 and 2, without significant difference between them (P = 0.023). However, statistically significant differences (P = 0.001) were found between the mean values of IL-17A in groups 2 and 3, with individuals in group 3 having the highest levels. Elevated levels in individuals with MS could be interpreted as a reflection of subclinical inflammation accompanying the condition. Namely, the reduced levels during the active phase of infection (group 1), as well as after recovery (group 2), are grounds to assume that the SARS-CoV-2 virus interferes with immune regulation, causing lasting immune suppression, both in the acute and subsequent convalescent phases of the disease.
Analysis of the complement system
It is assumed that over-activation of the tightly controlled complement system triggers immune and inflammatory pathways that, in addition to exacerbating inflammation, also lead to endothelial damage and hypercoagulation, which in turn leads to a vicious cycle of further complement activation and damage [40-42].
To study the role of the complement system in the pathogenesis of new-onset carbohydrate disorders and beta-cell dysfunction following COVID-19, serum levels of HCFD were monitored. Analysis of the mean levels of HCFD showed that there were statistically significant differences between all the three groups (P < 0.001), with individuals in group 2 demonstrating lower levels compared to those in group 1. It can be assumed that in the active phase of COVID-19, an inflammatory response with the participation of complement occurs, which is not so pronounced in the convalescent period (group 2), where it is most significantly suppressed. The lowest levels observed in the post-COVID-19 group could also be interpreted as a reflection of the exhausted complement activity during the active inflammatory state.
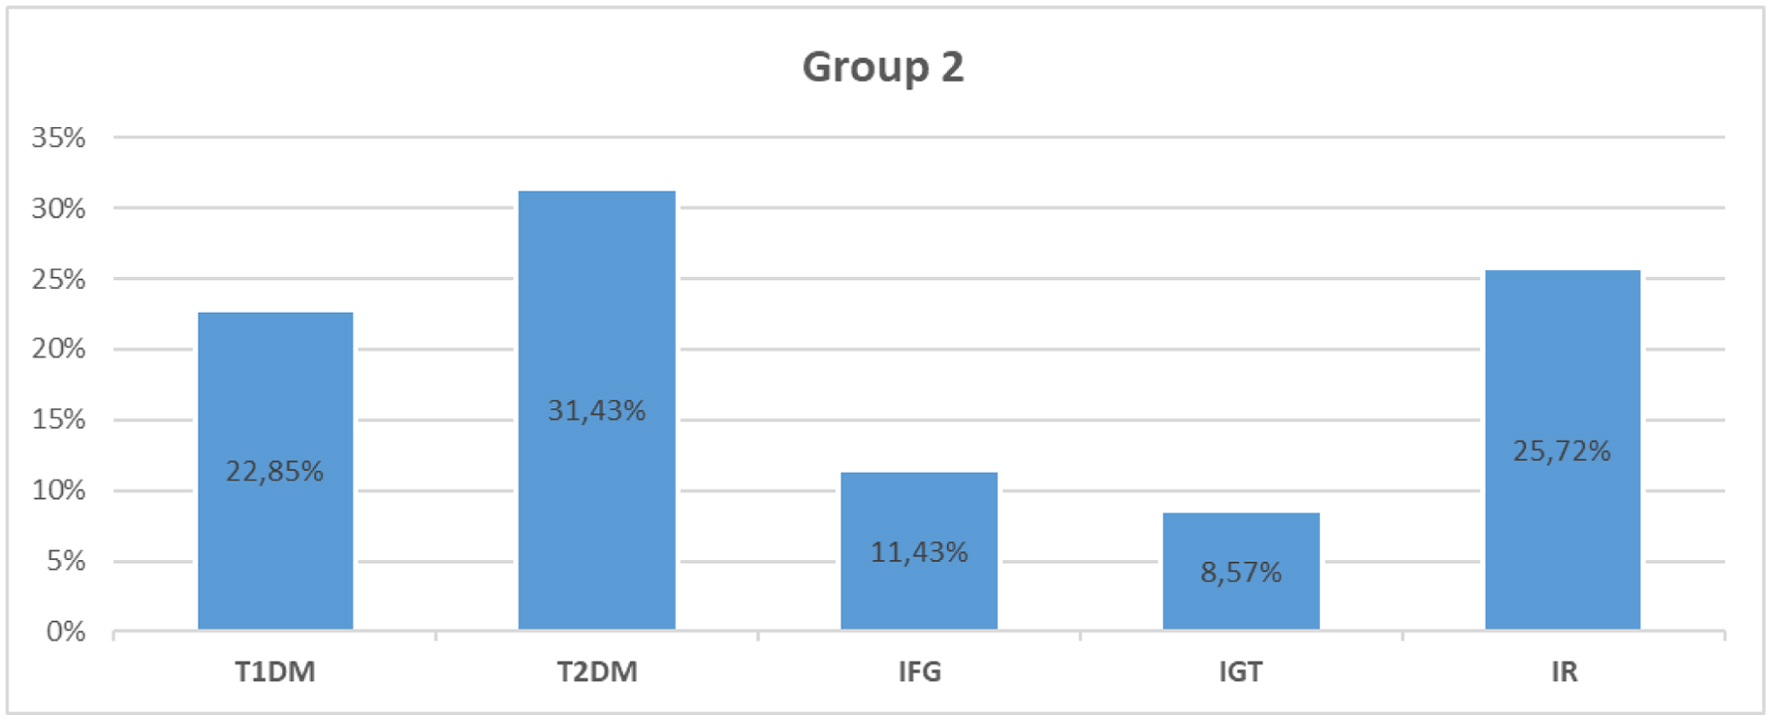
An additional comparison was made between the inflammatory markers in subgroups with or without DM belonging to group 1 (active COVID-19) and group 2 (post-COVID-19) to investigate the role of diabetes and the associated immune dysfunction during and after the SARS-CoV-2 infection (Fig. 2). As shown by the data, patients with DM in both the active COVID-19 and post-COVID-19 groups demonstrated higher mean levels in almost all of the evaluated immunological markers. A statistically significant difference was found between non-diabetic patients for IL-7 (P = 0.029) and IL-17A levels (P = 0.019), whereas both diabetic and non-diabetic patients showed a significant difference in INF-γ levels (P < 0.001). HCFD levels significantly differed between diabetic subgroups (P = 0.014) but not in non-diabetics. This is the reason to conclude that both the virus and diabetes, as the terrain on which the disease occurs, act synergistically towards excessive activation of the immune system and subsequent dysregulation.
 Click for large image |
Figure 2. Immunological parameters (mean values) in patients with DM (DM+) and without DM (DM -) in patients from group 1 (active COVID-19) and group 2 (post-COVID-19 with new-onset carbohydrate disorders). The blue star indicates a statistically significant difference (P < 0.05) between the two subgroups (DM+ and DM-). CD: cluster of differentiation; IL: interleukin; IFN-γ: interferon-gamma; TNF-α: tumor-necrosis factor - alpha; HCFD: human complement factor D; DM: diabetes mellitus; COVID-19: coronavirus disease 2019. |
Monitoring of oxidative stress and antioxidant defense, along with hypoxia
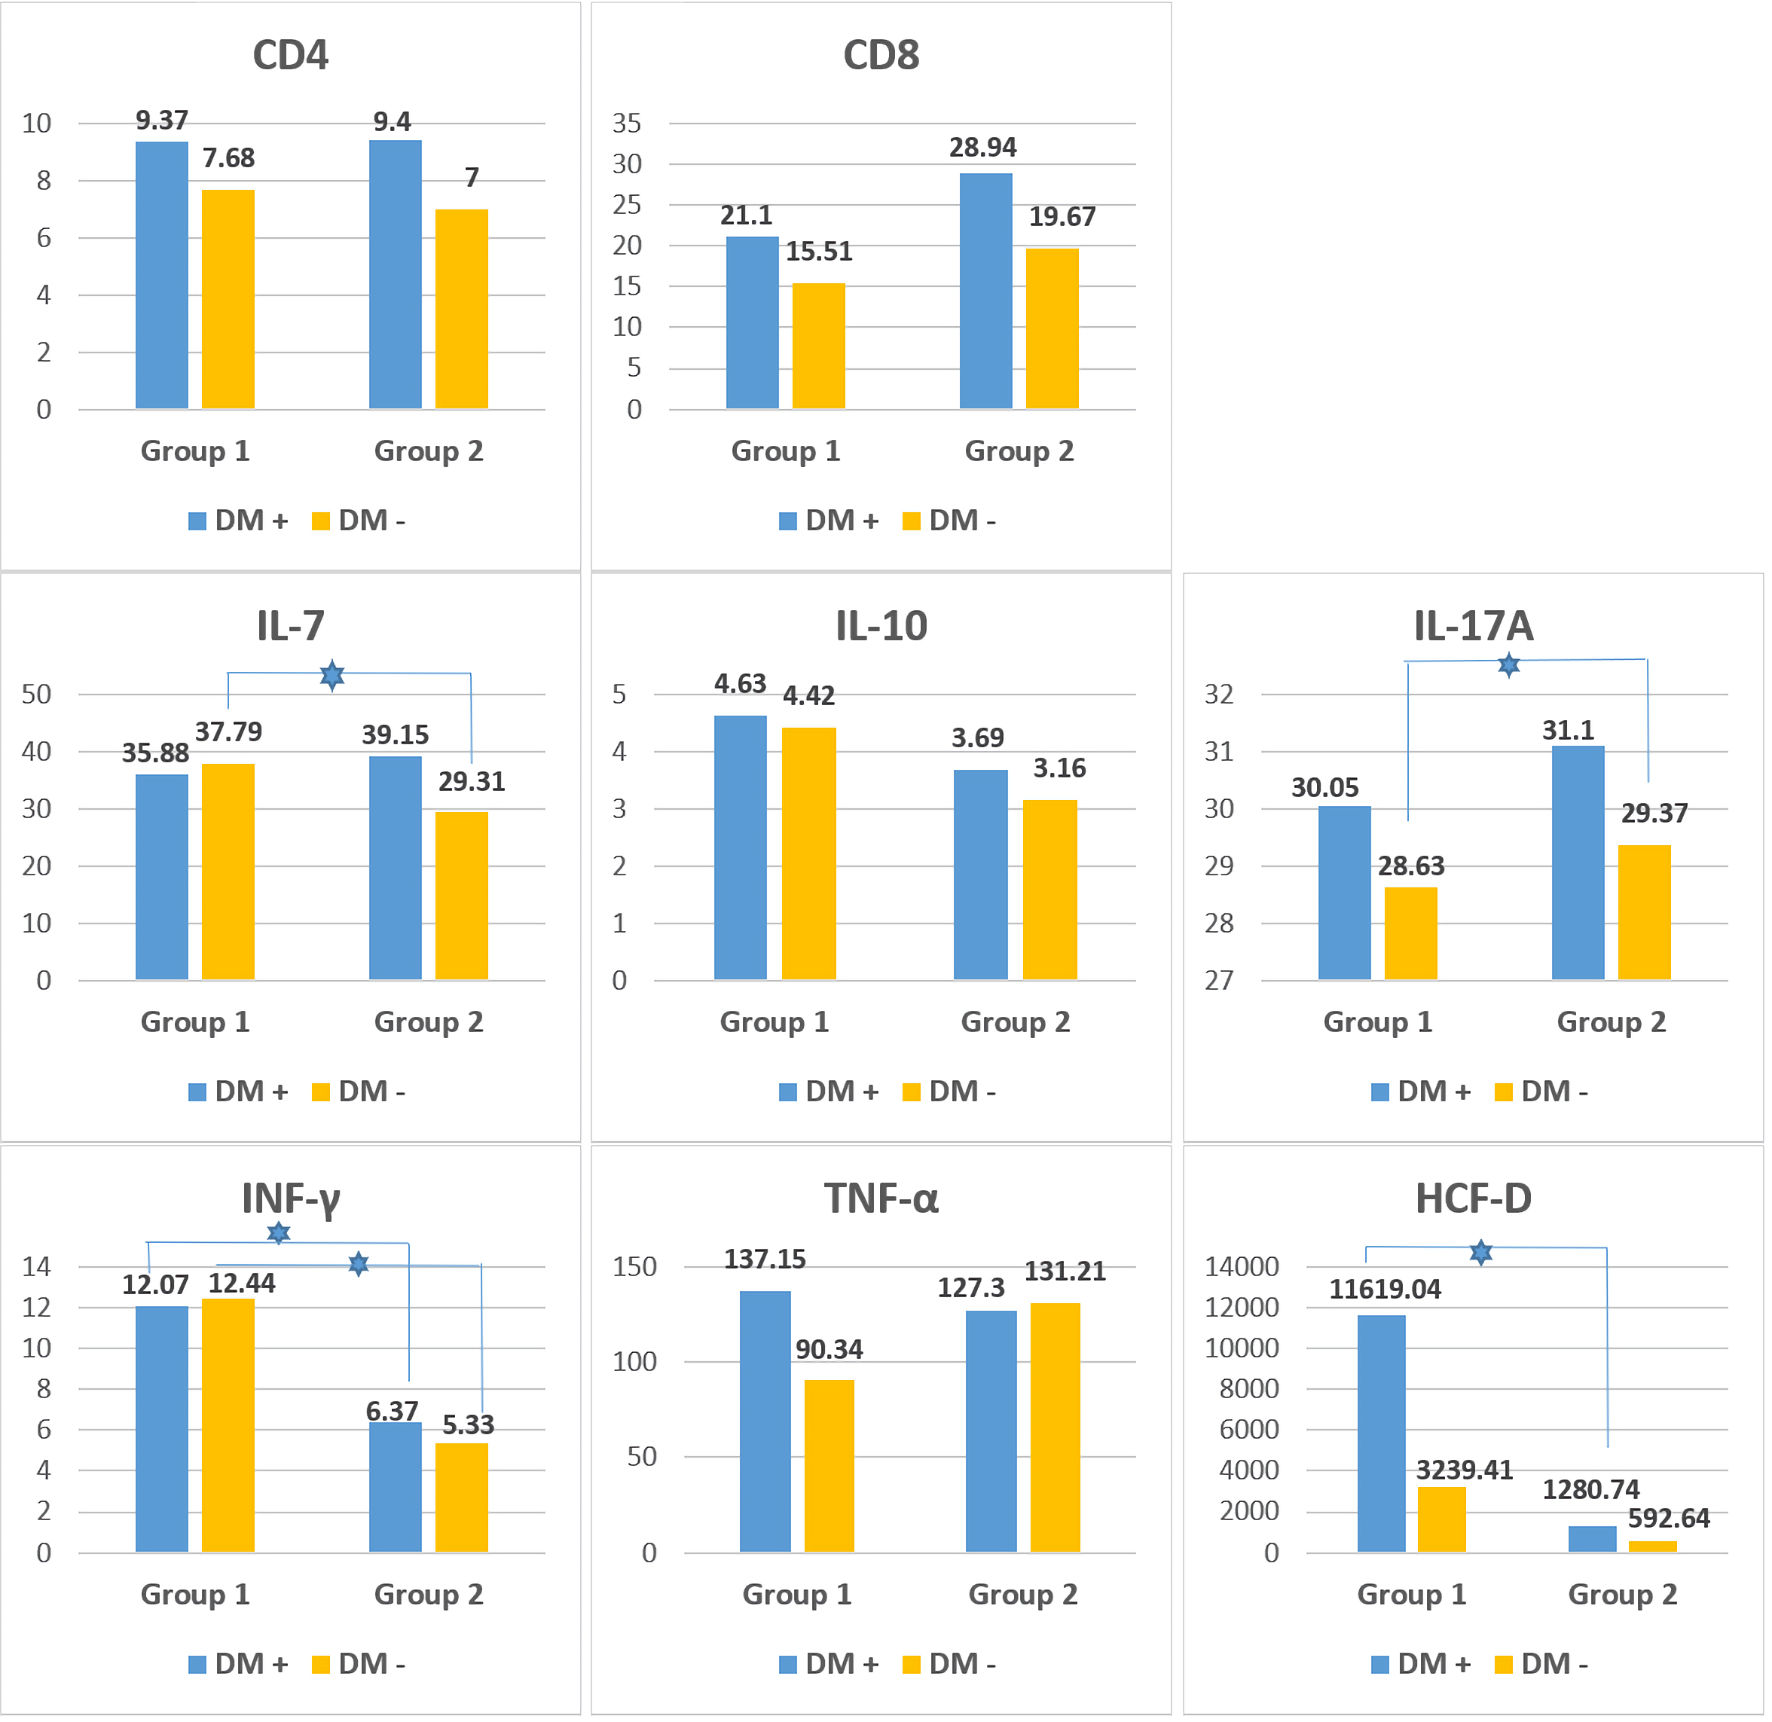
To study the potential role of oxidative stress and hypoxia during and after the disease, some oxidative stress and antioxidant defense indicators were monitored in both the acute phase of the disease and in the asymptomatic phase (Fig. 3).
 Click for large image |
Figure 3. Oxidative stress, antioxidant defense and hypoxia indicators (mean values) in patients with DM (DM+) and without DM (DM-) in patients from group 1 (active COVID-19) and group 2 (post-COVID-19 with new-onset carbohydrate disorders). The blue star indicates a statistically significant difference (P < 0.05) between the two subgroups (DM+ and DM-). 8-epi-PGF2α: 8-epi-prostaglandyn F2 alpha; NFE2L2: nuclear factor erythroid 2-related factor 2; HIF-1α: hypoxia inducible factor-1 alpha; DM: diabetes mellitus; COVID-19: coronavirus disease 2019. |
Analysis of oxidative stress
8-epi-PGF2α, as a marker of oxidative stress and lipid peroxidation [43], was evaluated; and the lowest values were recorded during the acute phase of infection (group 1), with a subsequent significant increase (P < 0.001) observed in the convalescent period (group 2). The highest values were found among individuals with MS (group 3), which differed significantly from the other two groups (P < 0.05). Based on this, it can be concluded that the oxidative stress that arise during the active phase of coronavirus infection not only persists, but also worsens after recovery, especially among individuals with newly emerging disorders in glucose metabolism. Among individuals with MS, however, the levels of oxidative stress are significantly higher (P < 0.05), which can be explained by the underlying subclinical inflammation and its duration. Similar levels were detected among both diabetics and non-diabetics from all the three groups (P > 0.05), but statistically significant difference was found between the separate subgroups (diabetics (P = 0.011) and non-diabetics (P = 0.025)) among individuals from groups 1 and 2 (Fig. 3).
Analysis of antioxidant response
To investigate the antioxidant defense, mean levels of NFЕ2L2 were monitored. Considered one of the main protectors against oxidative stress, NFЕ2L2 plays an essential role in antioxidant protection of cells during COVID-19 [44]. Similar levels were found between the three studied groups, with no statistically significant difference between them (P = 0.167). However, the highest values were recorded among individuals from post-COVID-19 group (group 2), supporting the hypothesis of its protective role during the recovery period. Lower levels were found among individuals with active SARS-CoV-2 infection (group 1). All of this suggests that the massive viral invasion exhausts its protective capacity. The lack of antioxidant protection in patients with pre-existing DM is a manifestation of an exhausted antioxidant response involving NFЕ2L2. Interestingly, diabetic patients from group 2 demonstrated higher levels than non-diabetics from the same group, whereas no such difference was observed in group 1; in any case, no statistically significant difference was found (P > 0.05) (Fig. 3). This suggests that hyperglycemia causes oxidative stress per se, and the increase in NFЕ2L2 levels could be a manifestation of an antioxidant response with still preserved antioxidant capacity, as the hyperglycemia is still of short duration.
A moderately strong positive correlation was found between the levels of NFЕ2L2 and the pro-inflammatory cytokine IL-17A (r = 0.367; P < 0.05) in group 2, giving reason to assume that one of the main mechanisms of antiviral and antioxidant protection of NFЕ2L2 may be its counteraction of the effects mediated by IL-17A (a product of Th17-Ly and Tc-Ly).
Analysis of cellular hypoxia and its consequences
Serum levels of HIF-1α were monitored to follow virus-induced cellular hypoxia and its role in the development of the cell-mediated inflammatory response, as well as in the pathophysiological changes in blood glucose, insulin secretion and sensitivity. HIF-1α is known as a master regulator of the cellular and systemic homeostatic response to hypoxia, activating the transcription of many genes, including those involved in energy metabolism, angiogenesis, apoptosis, and others whose products increase oxygen delivery or facilitate metabolic adaptation to hypoxia [45, 46].
As expected, higher HIF-1α levels were registered in the active SARS-CoV-2 infection group (group 1) with a significant difference (P < 0.001) compared with that from the post-COVID-19 group (group 2). Our data are consistent with the study of Tian et al [47], who also found that HIF-1α levels were significantly elevated during SARS-CoV-2 infection. They concluded that it was the virus that induced an increase in HIF-1α levels, which in turn exacerbated viral infection and inflammatory response. Da Silva et al [48] suggested that prolonged or dysregulated activation of HIF-1α was a key driver of systemic inflammation, silent hypoxia, and pathological tissue remodeling in both the acute and post-acute phases of the disease and may contribute to chronic dysfunctions associated with the post-acute COVID-19 syndrome (PACS). They also pointed out the possible dual role of HIF-1α, which may either aggravate inflammatory responses and viral persistence or promote adaptive mechanisms that reduce cellular damage, all depending on the dynamic adaptation of the body to an oxygen deprivation [48, 49].
The highly elevated levels of HIF-1α in the acute phase of infection highlight its role as a critical regulator in the body’s response to hypoxia and viral infection. The lowest values, found in recovered individuals with new-onset carbohydrate disorders, with no significant difference between diabetics and non-diabetics, raise the question of whether it plays a role in the genesis of these disorders.
The increased levels of HIF-1α among diabetics from all three groups confirm the reported data on dysregulation of HIF-1α in conditions of hyperglycemia. It has been found that the diabetogenic microenvironment suppresses the cellular response mediated by HIF-1α (the so-called HIF-1/HRE response) and thus negatively interferes with the adaptive cellular mechanisms occurring in hypoxia. This leads to reduced production of various growth factors, such as vascular cell adhesion molecule (VCAM), and impaired cell migration [50].
Regarding the relationship with pancreatic function, most data suggest that there is a bidirectional regulation between beta-cell function and HIF-1α. It has been shown that a slight increase in HIF-1α is beneficial for beta-cell function and glucose tolerance, but high levels are detrimental to their functional state [51].
Levels of HIF-1α differed statistically among individuals with diabetes (P = 0.001) and without diabetes (P = 0.027) in both active COVID-19 group (group 1) and post-COVID-19 group (group 2).
When evaluating differences in HIF-1α levels among individuals in group 2 according to the type of carbohydrate disorder, some differences were found. Significantly, higher average levels were detected in individuals with T1DM (589.83 ± 896.98 pg/mL), which were even higher than the average for the entire group 2. Next were the individuals with IGT (541.83 ± 314.31 pg/mL) and IFG (462.51 ± 396.79 pg/mL), who demonstrated similar levels. The lowest values were reported in the subgroup of individuals with IR and/or hyperinsulinemia (169.86 ± 135.71 pg/mL) and T2DM (257.6 ± 183 pg/mL).
All these findings indicate that hypoxia and the subsequent activated intracellular signaling pathways, with the active participation of HIF-1α, play a role in the occurrence of carbohydrate disorders. The significantly lower levels in this group suggest that persistent hypoxia, even at the cellular level, could have an impact on beta-cell function.
Glycemic and hormonal parameters
In order to investigate the influence of SARS-CoV-2 infection and the following disturbances in glucose metabolism, major glycemic parameters and hormones involved in glucose homeostasis were monitored in the patients of each group (Table 5).
Click to view |
Table 5. Evaluated Glycemic and Hormonal
Parameters Among the Studied Population |
Fasting plasma glucose levels were evaluated in individuals with active coronavirus infection (group 1) prior to starting glucocorticoid (GCS) therapy. The highest values were found among individuals in group 2, followed by those in group 1, and the lowest values were found in individuals in group 3. Statistically significant differences were found between groups 1 and 3 (P < 0.001), as well as between groups 2 and 3 (P = 0.039).
These data were not surprising, given the fact that only 50% (n = 16) of the patients in group 1 were diabetic. The average fasting blood sugar level among individuals with diabetes (n = 16) was 7.79 mmol/L, while among individuals with newly diagnosed diabetes (n = 7), it was lower (6.86 mmol/L). In 14 individuals (43.75%) in the group, blood glucose levels ≥ 7.0 mmol/L were observed, while only two of them (6.25%) had levels ≥ 11.1 mmol/L. In contrast, our study found stress hyperglycemia (fasting blood glucose (FBG) ≥ 7.8 mmol/L, HbA1c < 6.5% in patients without pre-existing DM) in only four (12.5%) of all cases in group 1 (Fig. 4).
 Click for large image |
Figure 4. Distribution of the patients according to the diagnosis of DM and its duration among the three groups. DM: diabetes mellitus. |
The bidirectional relationship between coronavirus infection and hyperglycemia has been confirmed by a number of studies [52-55]. There is ample evidence supporting the observation that hyperglycemia is an independent risk factor for more severe disease, the development of complications during the course of infection, and death [52]. Not only hyperglycemia on admission [56] but also fluctuations in glucose levels during hospitalization [57] influence the severity, course and outcome of the disease. On the other hand, COVID-19 is associated with new-onset diabetes and hyperglycemia even in patients without preexisting disturbances in glucose metabolism [6].
In the post-COVID-19 group with newly developed carbohydrate disorders (group 2), the average blood glucose level was 9.43 mmol/L in diabetics, and 5.21 mmol/L in non-diabetics, respectively. In 11 patients (31.43%), blood glucose levels ≥ 7.0mmol/L were found, while only five (14.28%) had levels ≥ 11.1 mmol/L.
Among the individuals in the group, a week positive correlation was also found between the levels of blood glucose and IL-10 (r = 0.369; P < 0.05). A similar correlation was found by Da Porto et al [58] among individuals with active coronavirus infection. They reported that patients with stress hyperglycemia, measured by stress hyperglycemia ratio (SHR) > 1.14, had significantly higher plasma insulin, HOMA-IR, and IL-10 levels.
In the reference group of individuals with MS (group 3), the average fasting glucose level was 7.16 mmol/L in the diabetics, and 4.96 mmol/L in the non-diabetics, respectively. In only four (12.12%) of all patients, values ≥ 7.0 mmol/L were found, while in only one (3.03%), fasting glucose levels ≥ 11.1 mmol/L were recorded.
HbA1c levels were also monitored, with the highest values been found among individuals from group 2, followed by those from group 3, and the lowest values in individuals from group 1. Statistically significant differences were not found between the individual groups (P = 0.162). A likely reason for the discrepancy between the values of fasting glucose and HbA1c between the groups is the small number of individuals, in whom HbA1c was tested, especially in group 3 (n = 12).
In group 1, a total of 16 individuals (50%) of all those studied had DM, and it was pre-existing in only nine of them (28.13%). The remaining seven individuals (21.87%) had newly diagnosed diabetes (four women and three men, respectively) (Fig. 4).
The average value of HbA1c among diabetics in group 1 was 6.55%, while in non-diabetics, it was 5.56%. Among individuals with newly diagnosed diabetes, the value of HbA1c was slightly higher than the average for diabetics in general (6.66%). Average levels of hemoglobin were within the normal reference range (117.07 g/L and 147.75 g/L), which gives reason to assume that the relatively low levels of HbA1c are due to impaired glycation processes in the context of coronavirus inflammation.
Increased mortality was reported among individuals with new-onset diabetes during hospitalization for coronavirus infection (HR: 9.42; 95% CI: 2.18 - 40.7) compared to those with hyperglycemia alone [54]. Our findings support this hypothesis, as there were two deaths in our cohort, both in patients with newly diagnosed diabetes.
Individuals from group 2 were pre-selected according to criteria including newly occurring disorders in glucose metabolism without a history of such, before suffering from coronavirus infection. The diagnosis of newly diagnosed diabetes was made in 19 individuals (54.28%) from group 2 (10 women and nine men, respectively). And eight of them (17.14%) were diagnosed with T1DM, including LADA, the remaining 11 individuals (34.43%) were diagnosed with T2DM. Among the rest of the patients, four (11.43%) were diagnosed with IFG and three (8.57%) with IGT, while the remaining nine (25.71%) were categorized as patients with IR and/or hyperinsulinemia with normoglycemia (Fig. 4).
The average value of HbA1c among diabetics in the group was 9.16%, while in the non-diabetic patients, it was 5.35%. Interestingly, a positive moderately strong correlation between HbA1c and IL-10 levels (r = 0.510, P < 0.05) was also found in the group.
In group 3, DM was detected among 11 of the individuals (33.33%), and only two of them (6.06%) were newly diagnosed. The average HbA1c level was 6.8% in this group, compared with 5.9% in the others.
As seen, individuals with DM in group 3 demonstrated the best glycemic control compared to diabetics from the other groups. This is partly explained by the fact that most of them are undergoing some treatment, and there is also no influence of SARS-CoV-2 infection.
Glucagon
Glucagon levels were monitored to assess pancreatic alpha cells. When examining glucagon levels in the three groups, the highest levels were found in the non-COVID-19 group (group 3) and the lowest levels in the post-COVID-19 one (group 2). Individuals with active coronavirus infection (group 1) demonstrated intermediate levels, which were higher than those in group 2, although no significant difference was found (P = 0.068). There was a statistically significant difference between groups 1 and 3 (P = 0.003), as well as between groups 2 and 3 (P < 0.001). It is well known that in T2DM, reduced beta-cell function, leading to insufficient insulin secretion, is indeed accompanied by increased glucagon secretion, thereby contributing to the hyperglycemia characteristic [59]. The registered increased levels of glucagon among individuals from the two COVID-19-related groups suggest that virus-induced inflammation may affect glucagon secretion, damage alpha cells, and thereby interfere with glucose homeostasis.
Insulin and C-peptide
In order to assess pancreatic beta-cell function, serum levels of insulin and C-peptide were followed among individuals from each group. When examining fasting insulin, the highest levels were found in the reference group with MS (group 3), whereas the lowest levels were found in the post-COVID-19 group with new-onset disorders (group 2). Patients with active coronavirus infection (group 1) also demonstrated higher levels compared to those who had recovered, with no significant difference been found between the three groups (P = 0.159).
Interestingly, among all three groups, there is evidence of basal hyperinsulinemia, most pronounced among the group of individuals with MS. This, together with the data on increased glucagon production, in an analogous manner among all three groups, gives reason to assume that there is an overproduction of the major hormones produced by the main pancreatic cell type.
Following C-peptide levels among the study population, the highest values were observed in group 2 (post-COVID-19), followed by individuals with active coronavirus infection (group 1), and the lowest was observed in the reference group with MS (group 3). Statistically significant differences were found between groups 1 and 3 (P = 0.001), as well as between groups 2 and 3 (P < 0.001), but not between groups 1 and 2 (P > 0.05) where similar values were observed.
A probable reason for the dissonance observed between insulin and C-peptide levels, especially pronounced among individuals in group 3 (COVID-19-negative with MS), could be explained by impaired insulin clearance among those with obesity and metabolic dysfunction-associated fatty liver disease (MAFLD) [60, 61]. Given the fact that MAFLD is a common hepatic manifestation of MS, and MS is the main characteristic of all individuals in this group, it is possible to assume that it is the reduced insulin clearance in patients with MAFLD that accounts for the increased levels among some individuals.
Dissonance between insulin and C-peptide levels was also observed in individuals with newly emerging carbohydrate disorders following previous SARS-CoV-2 infection (group 2). In these cases, the differences are not so pronounced, but the aforementioned disorders in insulin clearance, which are specific to the individual types of diabetes, could still be considered a probable cause in individuals with newly diagnosed diabetes. Hypothetically, the possibility of viral influence on liver function, and consequently on insulin clearance, should also be considered, along with stress-induced hyperglycemia, which could also interfere with the regulation of hepatic insulin clearance [62].
Proinsulin
Analysis of proinsulin levels showed the highest values in patients with active coronavirus infection (group 1), with a slight difference from the reference non-COVID-19 group (group 3), while the lowest levels were found in the post-COVID-19 group with new-onset carbohydrate disorders (group 2). Patients from group 1 demonstrated increased levels compared to group 2, with no significant difference between the three groups (P = 0.147). Diabetics from all three groups demonstrated higher mean levels of proinsulin, as expected, given the fact that in patients with DM, the amount of proinsulin being secreted is higher due to the observed hyperinsulinemia and impaired proinsulin to insulin conversion [63]. Interestingly, in the active COVID-19 group, the difference between diabetics and non-diabetics was not so pronounced (59.45 ng/mL and 52.34 ng/mL, respectively, P > 0.05), whereas it was demonstrative in the post-COVID-19 group (51.82 ng/mL and 28.53 ng/mL, respectively, P > 0.05). Based on these observations, it can be suggested that SARS-CoV-2 infection has additional influence on the proinsulin to insulin cleavage, thereby contributing to beta-cell function impairment.
The characteristics of proinsulin and insulin secretion are similar in the two groups associated with COVID-19: individuals with active infection (group 1) demonstrated higher rate compared to the individuals with new-onset carbohydrate disorders following COVID-19 (group 2). This is a reason to assume that the disease has an impact on beta-cell function, in particular the secretion of insulin and proinsulin, and along with overstimulation and over-secretion by the cells, and the predominance of proinsulin secretion was also observed.
GP-73
GP-73 is an intracellular protein localized in the Golgi apparatus, playing a physiological role in maintaining glucose homeostasis by stimulating hepatic glucose production in the fasting state. Its production and secretion are increased early in the course of both viral and non-viral liver diseases. During COVID-19, GP-73 is secreted by various tissues during fasting and is significantly increased in lung, liver and kidney. In turn, GP-73 contributes to the increase in blood glucose levels by stimulating hepatic gluconeogenesis [64].
In order to study its role in etiopathogenesis of new-onset disorders in glucose metabolism, serum levels of GP-73 were monitored in our cohort of patients. The highest values were found in patients with MS (COVID-19-negative group 3), with a small difference compared to the post-COVID-19 group (group 2). Interestingly, the lowest levels were detected in the active-COVID-19 group (group 1), with a significant difference found compared to group 3 (P < 0.001).
Analysis of our data revealed that diabetics from all three groups have higher levels of GP-73 than those in non-diabetics from the corresponding group. In group 2, they were even nearly twice as high as in diabetics from group 1 (44.16 ng/mL and 22.66 ng/mL, respectively), which supports the theory of its involvement in the pathogenesis of virus-induced hyperglycemia.
In our analysis, a moderately strong positive correlation was found between GP-73 levels and the anti-inflammatory cytokine IL-10 (r = 0.512; P < 0.05) in the group with active infection (group 1), which could explain the observed lower GP-73 levels in this group.
Adipokines
Elevated leptin levels and evidence of leptin resistance have also been reported in COVID-19 [65, 66]. Increased values were observed in all three studied groups when we monitored the serum leptin levels among the patients, When comparing the individual groups, the lowest levels were found in the active COVID-19 group (group 1), followed by those in the post-COVID-19 group (group 2), and the highest in COVID-19-negative patients with MS group (group 3). A significant difference was found between subjects from groups 1 and 2 (P = 0.010) and between subjects from groups 1 and 3 (P < 0.001).
As expected, individuals with diabetes from all three studied groups demonstrated higher leptin levels compared to non-diabetics from the corresponding group. Interestingly, however, this difference was most pronounced in patients with new-onset carbohydrate disorders following COVID-19 (group 2), unlike the other two groups. This is the reason to assume that not only in diabetes, but also in prediabetic conditions that occurred after SARS-CoV-2 infection, there is a dysfunction of adipose tissue, and in particular in leptin production. Among with that, this evidence supports the hypothesis of leptin resistance, which develops and persists, or even worsens, after recovery from SARS-CoV-2 infection.
During the course of coronavirus inflammation, adipocyte dysfunction occurs, with a change in the secretory profile of adipocytokines, including those of adiponectin, which in contrast to leptin, is drastically reduced [66].
We also monitored adiponectin levels among the study population, and we found that levels were within the generally accepted reference range of 3 to 30 µg/mL. When comparing differences between the individual groups, the lowest values were recorded in the individuals from the group with active SARS-CoV-2 infection (group 1), followed by the post-COVID-19 group (group 2), and the highest among COVID-19-negative group with MS (group 3), with no significant difference between them (P = 0.131).
These results are puzzling at first glance; however, considering the marked differences in levels of the other major adipokine, leptin, between the three groups, it could be assumed that the increased levels of adiponectin are a compensatory response to adipocyte dysfunction induced by the virus (groups 1 and 2) or obesity (group 3).
Since adiponectin is an anti-inflammatory adipokine, it has been hypothesized that an initial decrease in circulating adiponectin levels is permissive for an adequate inflammatory response, whereas a subsequent increase may reflect an anti-inflammatory response to suppress immune system over-activation and enhance recovery [67]. Our findings support this hypothesis.
Overall, the role of adipokines in acute infections and critical illness is poorly understood. Previous studies have reported low or high levels of adiponectin in critically ill patients, and a biphasic pattern (low-high levels) has also been described [68, 69]. An association between high adiponectin levels and increased overall and cardiovascular mortality in the elderly has also been reported. Anyway, this adiponectin paradox has not yet been elucidated, hindering our understanding of the biological role of adiponectin [67].
Insulin and non-insulin derived indices
In order to study the IR levels and beta-cell function, some indices were calculated and compared among the individuals from the studied groups (Table 6).
Click to view |
Table 6. Estimated Insulin and Non-Insulin
Derived Indices Among the Studied Population |
HOMA-IR
Monitoring HOMA-IR [27] values (the most widely used method in clinical practice for assessing systemic IR and its quantification) revealed pronounced IR across all three groups, and the average values of the index were significantly high. This is partly explained by the high percentage of overweight and obesity in the groups (except in group 1, where BMI was not calculated as explained earlier).
The highest HOMA-IR values were found in individuals with active SARS-CoV-2 infection (group 1), similar to those of the group with MS (group 3), and the lowest values were seen in the group with new-onset carbohydrate disorders following infection (group 2). No significant difference was found between the three groups (P = 0.0504). The results confirm the widely accepted claim that during the course of SARS-CoV-2 infection, IR arises, which persists even after recovery [5].
Homeostasis model assessment of beta-cell function (HOMA-B)
When evaluating HOMA-B [27] (a method to assess pancreatic beta-cell function and its capacity) values among the groups, the highest index values were detected among individuals in COVID-19-negative group with MS (group 3), suggesting overstimulation and overproduction of beta cells. Similar levels were found in individuals from both active-COVID-19 (group 1) and post-COVID-19 group (group 2), with group 2 being within the reference values and group 1 being slightly lower. All of this gives reason to assume that during active infection, there is initial beta-cell dysfunction, which may be transient or persistent.
C-peptide/glucose ratio
The C-peptide/glucose ratio is another marker used to assess pancreatic beta-cell function in individuals with prediabetes and diabetes. Decreased values (< 2) are indicative of depletion of beta-cell secretory reserve [70]. It was followed in our cohort, and the lowest values were found among individuals with MS from group 3, whereas the highest in individuals from post-COVID-19 group (group 2) (P = 0.002). The group of individuals with active infection (group 1) occupied an intermediate position, as their values differed significantly from group 3 (P = 0.049). All these data support the hypothesis of beta-cell dysfunction during active infection, but further investigations are necessary to precise the exact mechanism.
Insulin/proinsulin ratio
Another widely used index for assessing beta-cell function is the insulin/proinsulin ratio, especially in individuals with diabetes. Elevated levels of proinsulin, and correspondingly decreased ratio, are considered indicators of impaired beta-cell function [71].
Tracking the insulin/proinsulin ratio in our cohort, similar values were recorded in both active COVID-19 and post-COVID-19 group (groups 1 and 2). However, the lowest values were observed among the individuals from the reference COVID-19-negative group with MS (group 3), significantly different from both group 1 (P = 0.011) and group 2 (P < 0.001).
Similar to our results, Montefusco et al [5] found no statistically significant differences in the insulin/proinsulin ratio between individuals with active SARS-CoV-2 infection and those who had recovered. However, they observed that higher mean levels were found in individuals with active SARS-CoV-2 infection, reflecting beta-cell hyperstimulation and aberrant functioning, which they believed could ultimately lead to beta-cell exhaustion and their death.
Analogously, diabetics from each group demonstrated lower levels of the ratio compared to non-diabetics, with the exception of group 3. A marked difference was observed in individuals in group 1 (0.46 and 1.02, respectively) and group 2 (0.49 and 0.93, respectively).
In the post-COVID-19 group with new-onset disorders in glucose metabolism (group 2), a negative correlation was found between the insulin/proinsulin ratio and INF-γ levels (r = -0.488; P < 0.05). Together with the established positive correlation between INF-γ and proinsulin levels in the same group (r = 0.534; P < 0.05), this is a reason to assume that INF-γ is directly involved in beta-cell damage and their subsequent dysfunction after COVID-19.
Sestan et al [72] reported that virus-induced IFN-γ production can reduce insulin receptor expression in skeletal muscle, leading to IR and subsequent hyperinsulinemia. This condition, in turn, may further enhance antiviral immunity by directly stimulating CD8+ effector T-cell function. Therefore, viral infection may accelerate the development of diabetes in individuals with pre-existing conditions of IR, such as obesity or hepatic steatosis.
Adiponectin/leptin ratio
Adiponectin/leptin ratio has been proposed as a predictive marker for MS, as it correlates with IR better than adiponectin or leptin alone and decreases with increasing number of metabolic risk factors [73].
It has been estimated among the studied population, with the highest values being recorded in individuals from group 1, and the lowest in the reference group with MS. Individuals from group 2 occupy an intermediate position, with a significant difference also existing between the group with active SARS-CoV-2 infection and the group of individuals with MS (P = 0.03), as well as between those with newly occurring carbohydrate disorders and those without MS (P = 0.048).
The highly elevated values of the ratio in the group of individuals with active infection (group 1) are confounding at the first glance. However, in the context of coronavirus inflammation, it could hypothetically be considered a compensatory response of the body to the disease or an expression of adipocyte dysfunction.
However, a similar trend was observed by Di Filippo et al [74], who found alike levels of adiponectin and leptin in individuals with different severity of infection, but observed differences in the adiponectin/leptin ratio. They reported that patients with moderate severity of infection had the highest adiponectin/leptin ratio of 5.0 (1.6; 11.2), which was significantly higher than individuals with mild and severe disease (P = 0.019). They also found that the adiponectin/leptin ratio was positively correlated with systemic inflammation (C-reactive protein (CRP)) (r = 0.293, P = 0.023). They also suggested that the increase in the adiponectin/leptin ratio, due to increased adiponectin and decreased leptin levels, is a compensatory response to systemic inflammation.
Conclusions
In the context of SARS-CoV-2 infection, both IR and beta-cell dysfunction are observed, which in turns have an impact on glucose homeostasis and in particular glycemia. After recovery, some individuals develop carbohydrate disorders, the etiology of which remains unsolved in a large percentage of cases.
The changes in immune homeostasis (during and after recovery) that we have identified - reflected in the observed variations in the levels of serum pro- and anti-inflammatory cytokines, along with the cellular immune response and the complement system - are grounds to assume that in some of the cases of newly emerging disorders in glucose homeostasis after COVID-19, immunological disorders are present, as well as an imbalance between pro- and antioxidants. The extent to which their role is primary and leading, and whether the genetic terrain on which all these processes develop has influence, remains a question that requires further investigation.
Acknowledgments
The study was conducted with a grant from the Medical University - Pleven (Project No. D6/2023: “Changes in pancreatic beta-cell function in COVID-19”). We wish to thank Prof. Milena Atanasova BD and Assoc. Prof. Irena Gencheva MD for their assistance with laboratory analyses of the samples, and Assoc. Prof. Mircho Vukov for the statistical analysis.
Financial Disclosure
The study was conducted with a grant of the Medical University - Pleven (Project No. D6/2023: “Changes in pancreatic beta cell function in COVID-19”).
Conflict of Interest
The authors declare that they have no conflict of interest that could be perceived as prejudicing the impartiality of the research reported. The sponsor had no role in study design, in the collection, analysis and interpretation of data; in the writing of the report, and in the decision to submit the article for publication.
Informed Consent
Informed consent was obtained.
Author Contributions
Victoria Tsvetkova: conceptualization, methodology, software, formal analysis, investigation, data curation, writing - original draft, and visualization. Malvina Todorova: investigation, data curation. Katya Todorova: supervision, project administration, writing - review and editing. All authors read and approved the final manuscript.
Data Availability
The authors declare that data supporting the findings of this study are available within the article.
| References | ▴Top |
- Wu CT, Lidsky PV, Xiao Y, Lee IT, Cheng R, Nakayama T, Jiang S, et
al. SARS-CoV-2 infects human pancreatic beta cells and elicits beta cell impairment. Cell Metab.
2021;33(8):1565-1576.e1565.
doi pubmed - Muller JA, Gross R, Conzelmann C, Kruger J, Merle U, Steinhart J,
Weil T, et al. SARS-CoV-2 infects and replicates in cells of the human endocrine and exocrine
pancreas. Nat Metab. 2021;3(2):149-165.
doi pubmed - Tang X, Uhl S, Zhang T, Xue D, Li B, Vandana JJ, Acklin JA, et al.
SARS-CoV-2 infection induces beta cell transdifferentiation. Cell Metab.
2021;33(8):1577-1591.e1577.
doi pubmed - Ben Nasr M, D'Addio F, Montefusco L, Usuelli V, Loretelli C, Rossi A,
Pastore I, et al. Indirect and Direct Effects of SARS-CoV-2 on Human Pancreatic Islets.
Diabetes. 2022;71(7):1579-1590.
doi pubmed - Montefusco L, Ben Nasr M, D'Addio F, Loretelli C, Rossi A, Pastore I,
Daniele G, et al. Acute and long-term disruption of glycometabolic control after SARS-CoV-2
infection. Nat Metab. 2021;3(6):774-785.
doi pubmed - He X, Liu C, Peng J, Li Z, Li F, Wang J, Hu A, et al. COVID-19
induces new-onset insulin resistance and lipid metabolic dysregulation via regulation of
secreted metabolic factors. Signal Transduct Target Ther. 2021;6(1):427.
doi pubmed - Wang Y, Guo H, Wang G, Zhai J, Du B. COVID-19 as a trigger for type 1
diabetes. J Clin Endocrinol Metab. 2023;108(9):2176-2183.
doi pubmed - Friedl N, Sporreiter M, Winkler C, Heublein A, Haupt F, Ziegler AG,
Bonifacio E, et al. Progression from presymptomatic to clinical type 1 diabetes after COVID-19
infection. JAMA. 2024;332(6):501-502.
doi pubmed - Marchand L, Pecquet M, Luyton C. Type 1 diabetes onset triggered by
COVID-19. Acta Diabetol. 2020;57(10):1265-1266.
doi pubmed - Unsworth R, Wallace S, Oliver NS, Yeung S, Kshirsagar A, Naidu H,
Kwong RMW, et al. New-onset type 1 diabetes in children during COVID-19: multicenter regional
findings in the U.K. Diabetes Care. 2020;43(11):e170-e171.
doi pubmed - Vlad A, Serban V, Timar R, Sima A, Botea V, Albai O, Timar B, et al.
Increased incidence of type 1 diabetes during the COVID-19 pandemic in Romanian children.
Medicina (Kaunas). 2021;57(9):973.
doi pubmed - Anindya R, Rutter GA, Meur G. New-onset type 1 diabetes and severe
acute respiratory syndrome coronavirus 2 infection. Immunol Cell Biol.
2023;101(3):191-203.
doi pubmed - Hollstein T, Schulte DM, Schulz J, Gluck A, Ziegler AG, Bonifacio E,
Wendorff M, et al. Autoantibody-negative insulin-dependent diabetes mellitus after SARS-CoV-2
infection: a case report. Nat Metab. 2020;2(10):1021-1024.
doi pubmed - Barrett CE, Koyama AK, Alvarez P, Chow W, Lundeen EA, Perrine CG,
Pavkov ME, et al. Risk for newly diagnosed diabetes >30 days after SARS-CoV-2 infection among
persons aged <18 years - United States, March 1, 2020-June 28, 2021. MMWR Morb Mortal Wkly
Rep. 2022;71(2):59-65.
doi pubmed - Hanley B, Naresh KN, Roufosse C, Nicholson AG, Weir J, Cooke GS,
Thursz M, et al. Histopathological findings and viral tropism in UK patients with severe fatal
COVID-19: a post-mortem study. Lancet Microbe. 2020;1(6):e245-e253.
doi pubmed - Qadir MMF, Bhondeley M, Beatty W, Gaupp DD, Doyle-Meyers LA, Fischer
T, Bandyopadhyay I, et al. SARS-CoV-2 infection of the pancreas promotes thrombofibrosis and is
associated with new-onset diabetes. JCI Insight. 2021;6(16):e151551.
doi pubmed - Zhang T, Mei Q, Zhang Z, Walline JH, Liu Y, Zhu H, Zhang S. Risk for
newly diagnosed diabetes after COVID-19: a systematic review and meta-analysis. BMC Med.
2022;20(1):444.
doi pubmed - Sathish T, Kapoor N, Cao Y, Tapp RJ, Zimmet P. Proportion of newly
diagnosed diabetes in COVID-19 patients: A systematic review and meta-analysis. Diabetes Obes
Metab. 2021;23(3):870-874.
doi pubmed - Miller MG, Terebuh P, Kaelber DC, Xu R, Davis PB. SARS-CoV-2
infection and new-onset type 2 diabetes among pediatric patients, 2020 to 2022. JAMA Netw Open.
2024;7(10):e2439444.
doi pubmed - Sami CA, Rahaman MFU, Khan MMR, Alam Bhuiyan MM, Matin MA, Rashed HM,
Khan AH, et al. Glycemic control status after six months in post-COVID-19 patients. Cureus.
2025;17(3):e81225.
doi pubmed - Sosibo AM, Khathi A. Pre-diabetes and COVID-19, could we be missing
the silent killer? Exp Biol Med (Maywood). 2021;246(4):369-370.
doi pubmed - Stephen RI, Tyndall JA, Hsu HY, Sun J, Umaru N, Olumoh JS, Adegboye
OA, et al. Elevated risk of pre-diabetes and diabetes in people with past history of COVID-19 in
northeastern Nigeria. BMC Public Health. 2024;24(1):2485.
doi pubmed - World Health Organization. Classification of diabetes mellitus. World Health Organization. 2019. https://iris.who.int/handle/10665/325182.
- Bansal N. Prediabetes diagnosis and treatment: a review.
World J Diabetes. 2015;6(2):296-303.
doi pubmed - Alberti KG, Eckel RH, Grundy SM, Zimmet PZ, Cleeman JI, Donato KA,
Fruchart JC, et al. Harmonizing the metabolic syndrome: a joint interim statement of the
International Diabetes Federation Task Force on Epidemiology and Prevention; National Heart,
Lung, and Blood Institute; American Heart Association; World Heart Federation; International
Atherosclerosis Society; and International Association for the Study of Obesity. Circulation.
2009;120(16):1640-1645.
doi pubmed - Alberti KG, Zimmet P, Shaw J. Metabolic syndrome—a new
world-wide definition. A Consensus Statement from the International Diabetes Federation. Diabet
Med. 2006;23(5):469-480.
doi pubmed - Matthews DR, Hosker JP, Rudenski AS, Naylor BA, Treacher DF, Turner
RC. Homeostasis model assessment: insulin resistance and beta-cell function from fasting plasma
glucose and insulin concentrations in man. Diabetologia. 1985;28(7):412-419.
doi pubmed - Cai Q, Huang D, Yu H, Zhu Z, Xia Z, Su Y, Li Z, et al. COVID-19:
Abnormal liver function tests. J Hepatol. 2020;73(3):566-574.
doi pubmed - Herta T, Berg T. COVID-19 and the liver - Lessons learned. Liver Int.
2021;41(Suppl 1):1-8.
doi pubmed - Mao R, Qiu Y, He JS, Tan JY, Li XH, Liang J, Shen J, et al.
Manifestations and prognosis of gastrointestinal and liver involvement in patients with
COVID-19: a systematic review and meta-analysis. Lancet Gastroenterol Hepatol.
2020;5(7):667-678.
doi pubmed - Effenberger M, Grander C, Grabherr F, Griesmacher A, Ploner T, Hartig
F, Bellmann-Weiler R, et al. Systemic inflammation as fuel for acute liver injury in COVID-19.
Dig Liver Dis. 2021;53(2):158-165.
doi pubmed - Ye Q, Wang B, Mao J. The pathogenesis and treatment of the Cytokine
Storm' in COVID-19. J Infect. 2020;80(6):607-613.
doi pubmed - Bhat MY, Solanki HS, Advani J, Khan AA, Keshava Prasad TS, Gowda H,
Thiyagarajan S, et al. Comprehensive network map of interferon gamma signaling. J Cell
Commun Signal. 2018;12(4):745-751.
doi pubmed - Alpdogan O, van den Brink MR. IL-7 and IL-15: therapeutic cytokines
for immunodeficiency. Trends Immunol. 2005;26(1):56-64.
doi pubmed - Chen D, Tang TX, Deng H, Yang XP, Tang ZH. Interleukin-7 biology and
its effects on immune cells: mediator of generation, differentiation, survival, and homeostasis.
Front Immunol. 2021;12:747324.
doi pubmed - Carlini V, Noonan DM, Abdalalem E, Goletti D, Sansone C, Calabrone L,
Albini A. The multifaceted nature of IL-10: regulation, role in immunological homeostasis and
its relevance to cancer, COVID-19 and post-COVID conditions. Front Immunol.
2023;14:1161067.
doi pubmed - Islam H, Chamberlain TC, Mui AL, Little JP. Elevated interleukin-10
levels in COVID-19: potentiation of pro-inflammatory responses or impaired anti-inflammatory
action? Front Immunol. 2021;12:677008.
doi pubmed - Aggarwal S, Gurney AL. IL-17: prototype member of an emerging
cytokine family. J Leukoc Biol. 2002;71(1):1-8.
pubmed - Costela-Ruiz VJ, Illescas-Montes R, Puerta-Puerta JM, Ruiz C,
Melguizo-Rodriguez L. SARS-CoV-2 infection: The role of cytokines in COVID-19 disease. Cytokine
Growth Factor Rev. 2020;54:62-75.
doi pubmed - Afzali B, Noris M, Lambrecht BN, Kemper C. The state of complement in
COVID-19. Nat Rev Immunol. 2022;22(2):77-84.
doi pubmed - Chauhan AJ, Wiffen LJ, Brown TP. COVID-19: A collision of complement,
coagulation and inflammatory pathways. J Thromb Haemost. 2020;18(9):2110-2117.
doi pubmed - Cugno M, Meroni PL, Gualtierotti R, Griffini S, Grovetti E, Torri A,
Lonati P, et al. Complement activation and endothelial perturbation parallel COVID-19 severity
and activity. J Autoimmun. 2021;116:102560.
doi pubmed - Ricke-Hoch M, Stelling E, Lasswitz L, Gunesch AP, Kasten M,
Zapatero-Belinchon FJ, Brogden G, et al. Impaired immune response mediated by prostaglandin E2
promotes severe COVID-19 disease. PLoS One. 2021;16(8):e0255335.
doi pubmed - Hayes JD, Dinkova-Kostova AT. The Nrf2 regulatory network provides an
interface between redox and intermediary metabolism. Trends Biochem Sci.
2014;39(4):199-218.
doi pubmed - Yoon D, Pastore YD, Divoky V, Liu E, Mlodnicka AE, Rainey K, Ponka P,
et al. Hypoxia-inducible Factor-1 Deficiency Results in Dysregulated Erythropoiesis Signaling
and Iron Homeostasis in Mouse Development. Journal of Biological Chemistry.
2006;281(35):25703-25711.
doi - Carmeliet P, Dor Y, Herbert JM, Fukumura D, Brusselmans K, Dewerchin
M, Neeman M, et al. Role of HIF-1alpha in hypoxia-mediated apoptosis, cell proliferation and
tumour angiogenesis. Nature. 1998;394(6692):485-490.
doi pubmed - Tian M, Liu W, Li X, Zhao P, Shereen MA, Zhu C, Huang S, et al.
HIF-1alpha promotes SARS-CoV-2 infection and aggravates inflammatory responses to COVID-19.
Signal Transduct Target Ther. 2021;6(1):308.
doi pubmed - da Silva FPG, Matte R, Wiedmer DB, da Silva APG, Menin RM, Barbosa
FB, Meneguzzi TAM, et al. HIF-1alpha pathway in COVID-19: a scoping review of its modulation and
related treatments. Int J Mol Sci. 2025;26(9):4202.
doi pubmed - Jia J, Zhang Y, Lu Q, Tian S, Zhao Y, Fan H. Dual roles of
hypoxia-inducible factor 1 in acute lung injury: tissue-specific mechanisms and therapeutic
modulation. Cells. 2025;14(14):1089.
doi pubmed - Garcia-Pastor C, Benito-Martinez S, Moreno-Manzano V,
Fernandez-Martinez AB, Lucio-Cazana FJ. Mechanism and consequences of the impaired Hif-1alpha
response to hypoxia in human proximal tubular HK-2 cells exposed to high glucose. Sci Rep.
2019;9(1):15868.
doi pubmed - Gunton JE, Kulkarni RN, Yim S, Okada T, Hawthorne WJ, Tseng YH,
Roberson RS, et al. Loss of ARNT/HIF1beta mediates altered gene expression and pancreatic-islet
dysfunction in human type 2 diabetes. Cell. 2005;122(3):337-349.
doi pubmed - Zahedi M, Kordrostami S, Kalantarhormozi M, Bagheri M. A review of
hyperglycemia in COVID-19. Cureus. 2023;15(4):e37487.
doi pubmed - Schlesinger S, Neuenschwander M, Lang A, Pafili K, Kuss O, Herder C,
Roden M. Risk phenotypes of diabetes and association with COVID-19 severity and death: a living
systematic review and meta-analysis. Diabetologia. 2021;64(7):1480-1491.
doi pubmed - Bode B, Garrett V, Messler J, McFarland R, Crowe J, Booth R, Klonoff
DC. Glycemic characteristics and clinical outcomes of COVID-19 patients hospitalized in the
United States. J Diabetes Sci Technol. 2020;14(4):813-821.
doi pubmed - Unnikrishnan R, Misra A. Diabetes and COVID19: a bidirectional
relationship. Nutr Diabetes. 2021;11(1):21.
doi pubmed - Yang Y, Cai Z, Zhang J. Hyperglycemia at admission is a strong
predictor of mortality and severe/critical complications in COVID-19 patients: a meta-analysis.
Biosci Rep. 2021;41(2):BSR20203584.
doi pubmed - Zhu L, She ZG, Cheng X, Qin JJ, Zhang XJ, Cai J, Lei F, et al.
Association of blood glucose control and outcomes in patients with COVID-19 and pre-existing
type 2 diabetes. Cell Metab. 2020;31(6):1068-1077.e1063.
doi pubmed - Da Porto A, Tascini C, Colussi G, Peghin M, Graziano E, De Carlo C,
Bulfone L, et al. Relationship between cytokine release and stress hyperglycemia in patients
hospitalized with COVID-19 infection. Front Med (Lausanne). 2022;9:988686.
doi pubmed - Lund A, Bagger JI, Christensen M, Knop FK, Vilsboll T. Glucagon and
type 2 diabetes: the return of the alpha cell. Curr Diab Rep. 2014;14(12):555.
doi pubmed - Najjar SM, Caprio S, Gastaldelli A. Insulin clearance in health and
disease. Annu Rev Physiol. 2023;85:363-381.
doi pubmed - Kotronen A, Vehkavaara S, Seppala-Lindroos A, Bergholm R,
Yki-Jarvinen H. Effect of liver fat on insulin clearance. Am J Physiol Endocrinol
Metab. 2007;293(6):E1709-1715.
doi pubmed - Zaharia OP, Antoniou S, Bobrov P, Karusheva Y, Bodis K, Kupriyanova
Y, Schrauwen-Hinderling V, et al. Reduced insulin clearance differently relates to increased
liver lipid content and worse glycemic control in recent-onset type 2 and type 1 diabetes.
Diabetes Care. 2023;46(12):2232-2239.
doi pubmed - Birkeland KI, Torjesen PA, Eriksson J, Vaaler S, Groop L.
Hyperproinsulinemia of type II diabetes is not present before the development of hyperglycemia.
Diabetes Care. 1994;17(11):1307-1310.
doi pubmed - Coate KC. GP73 links SARS-CoV-2 infection with dysglycaemia. Nat
Metab. 2022;4(1):9-10.
doi pubmed - Baltodano-Calle MJ, Polo-Vasquez JS, Romani-Pozo A, Gutarra-Saldana
D, Guija-Poma E. Leptin as a potential prognostic marker of the severity of COVID-19 infection
in obese patients. Nutr Metab Cardiovasc Dis. 2022;32(3):743-744.
doi pubmed - Reiterer M, Rajan M, Gomez-Banoy N, Lau JD, Gomez-Escobar LG, Gilani
A, Alvarez-Mulett S, et al. Hyperglycemia in acute COVID-19 is characterized by adipose tissue
dysfunction and insulin resistance. medRxiv. 2021.
doi pubmed - Muratsu J, Kamide K, Fujimoto T, Takeya Y, Sugimoto K, Taniyama Y,
Morishima A, et al. The combination of high levels of adiponectin and insulin resistance are
affected by aging in non-obese old peoples. Front Endocrinol (Lausanne). 2021;12:805244.
doi pubmed - Alipoor E, Mohammad Hosseinzadeh F, Hosseinzadeh-Attar MJ. Adipokines
in critical illness: a review of the evidence and knowledge gaps. Biomed Pharmacother.
2018;108:1739-1750.
doi pubmed - Pollmanns MR, Pajaziti Q, Hohlstein P, Adams JK, Abu Jhaisha S, Kabak
E, Hamesch K, et al. Serum adiponectin is elevated in critically ill patients with liver disease
and associated with decreased overall survival. Biomedicines. 2024;12(10):2173.
doi pubmed - Fritsche A, Heni M, Peter A, Gallwitz B, Kellerer M, Birkenfeld AL,
Haring HU, et al. Considering insulin secretory capacity as measured by a fasting
C-Peptide/Glucose ratio in selecting glucose-lowering medications. Exp Clin Endocrinol Diabetes.
2022;130(3):200-204.
doi pubmed - Roder ME, Dinesen B, Hartling SG, Houssa P, Vestergaard H,
Sodoyez-Goffaux F, Binder C. Intact proinsulin and beta-cell function in lean and obese subjects
with and without type 2 diabetes. Diabetes Care. 1999;22(4):609-614.
doi pubmed - Sestan M, Marinovic S, Kavazovic I, Cekinovic D, Wueest S, Turk
Wensveen T, Brizic I, et al. Virus-induced interferon-gamma causes insulin resistance in
skeletal muscle and derails glycemic control in obesity. Immunity.
2018;49(1):164-177.e166.
doi pubmed - Fruhbeck G, Catalan V, Rodriguez A, Ramirez B, Becerril S, Salvador
J, Colina I, et al. Adiponectin-leptin ratio is a functional biomarker of adipose tissue
inflammation. Nutrients. 2019;11(2):454.
doi pubmed - Di Filippo L, De Lorenzo R, Sciorati C, Capobianco A, Lore NI,
Giustina A, Manfredi AA, et al. Adiponectin to leptin ratio reflects inflammatory burden and
survival in COVID-19. Diabetes Metab. 2021;47(6):101268.
doi pubmed
This
article is distributed under the terms of the Creative Commons Attribution Non-Commercial 4.0
International License, which permits unrestricted non-commercial use, distribution, and
reproduction in any medium, provided the original work is properly cited.
Journal
of Endocrinology and Metabolism is published by Elmer Press Inc.