| Journal of Endocrinology and Metabolism, ISSN 1923-2861 print, 1923-287X online, Open Access |
| Article copyright, the authors; Journal compilation copyright, J Endocrinol Metab and Elmer Press Inc |
| Journal website https://jem.elmerpub.com |
Original Article
Volume 16, Number 4, August 2026, pages 167-171

Nonlinear Relationship Between Serum 25-Hydroxyvitamin D and Glycemic Control Among US Adults: A Survey-Weighted Analysis of NHANES 2017–2018
George Khayrallah Altarchaa, b  , Aksa Alina Joya, Joseph Iglesiasa
aCommunity Medical Center, Toms River, NJ, USA
bCorresponding Author: George Khayrallah Altarcha, Community Medical Center, Toms River, NJ, USA
Manuscript submitted May 27, 2026, accepted August 4, 2026, published online August 24, 2026
Short title: Vitamin D and HbA1c in Adults
doi: https://doi.org/10.14740/jem1658
| Abstract | ▴Top |
Background: Vitamin D has been implicated in glucose metabolism through effects on pancreatic β-cell function, insulin sensitivity, and systemic inflammation. However, epidemiologic studies evaluating the association between serum 25-hydroxyvitamin D (25(OH)D) and glycemic control have yielded inconsistent findings after adjustment for adiposity and lifestyle-related factors. The objective was to evaluate the association between serum 25(OH)D concentrations and glycemic control in a nationally representative sample of US adults, with emphasis on potential nonlinear relationships.
Methods: We performed a cross-sectional analysis of adults aged ≥ 18 years from the National Health and Nutrition Examination Survey (NHANES) 2017–2018. Participants with available data on serum 25(OH)D, glycated hemoglobin (HbA1c), and covariates were included. Survey-weighted multivariable linear regression models were adjusted for age, sex, race/ethnicity, body mass index (BMI), and physical activity. Serum 25(OH)D was analyzed both categorically and continuously. Restricted cubic spline regression with four knots was used to assess nonlinear associations.
Results: A total of 5,136 adults were included. Vitamin D insufficiency was not significantly associated with HbA1c compared with deficiency (β = −0.051; 95% confidence interval (CI) −0.120 to 0.019; P = 0.156), whereas vitamin D sufficiency was associated with lower HbA1c levels (β = −0.189; 95% CI −0.263 to −0.115; P < 0.001). Increasing age and BMI were independently associated with higher HbA1c, while physical activity was inversely associated with HbA1c. Restricted cubic spline modeling demonstrated a nonlinear, non-monotonic association between serum 25(OH)D and HbA1c, with HbA1c remaining relatively stable at lower vitamin D concentrations and declining modestly at higher concentrations.
Conclusions: Serum 25(OH)D demonstrated a modest nonlinear association with HbA1c in US adults. Although higher vitamin D concentrations were associated with lower HbA1c levels, the effect size was small, suggesting that vitamin D may reflect broader metabolic health rather than serve as a primary determinant of glycemic control.
Keywords: Vitamin D; HbA1c; NHANES; Glycemic control; Diabetes; Nonlinear association; Restricted cubic spline
| Introduction | ▴Top |
The global burden of dysglycemia continues to increase and remains closely linked to cardiovascular and renal complications and early mortality [1]. Identifying modifiable determinants of glycemic control is therefore of considerable clinical and public health importance.
Although vitamin D is classically associated with calcium regulation and bone health, increasing evidence suggests additional metabolic effects [2, 3]. Vitamin D receptors are expressed in pancreatic β cells and peripheral tissues involved in insulin signaling, raising the possibility that vitamin D may influence glucose metabolism through effects on insulin secretion, insulin sensitivity, and systemic inflammatory pathways.
Prior observational investigations assessing serum 25-hydroxyvitamin D (25(OH)D) and glycemic measures have yielded heterogeneous findings. Several studies have reported inverse associations between vitamin D levels and insulin resistance or glycated hemoglobin (HbA1c), whereas others have demonstrated attenuation of these associations after adjustment for obesity and lifestyle-related factors [4, 5]. One potential explanation for these inconsistencies is the assumption of linearity in prior analyses. Biological mechanisms suggest that vitamin D signaling may exhibit threshold-dependent or saturable effects that are not adequately captured using traditional linear modeling approaches [6].
Accordingly, we evaluated the relationship between serum 25(OH)D and HbA1c in a nationally representative sample of US adults using National Health and Nutrition Examination Survey (NHANES) 2017–2018 data. We additionally explored potential nonlinear associations using restricted cubic spline modeling.
| Materials and Methods | ▴Top |
Study design and population
We conducted a cross-sectional study using data from the NHANES 2017–2018, a federally administered health survey designed to sample the civilian US population using complex multistage methods.
Adults aged ≥ 18 years with available data on serum 25(OH)D, HbA1c, covariates, and survey design variables were eligible for inclusion. Participants with missing laboratory or covariate data were excluded. The final analytic cohort consisted of 5,136 individuals.
Exposure variable
Serum 25(OH)D concentrations were measured in nmol/L and analyzed both continuously and categorically according to commonly used clinical thresholds: deficient: < 50 nmol/L; insufficient: 50–74 nmol/L; sufficient: ≥ 75 nmol/L.
Outcome variable
The primary outcome was HbA1c (%), analyzed as a continuous variable.
Covariates
Covariates were selected a priori based on biologic plausibility and prior literature and included: age; sex; race/ethnicity; body mass index (BMI); physical activity (active vs. inactive).
Statistical analysis
All statistical analyses incorporated NHANES survey weights, clustering, and stratification variables to obtain nationally representative estimates.
Survey-weighted multivariable linear regression models were used to estimate associations between vitamin D categories and HbA1c. Models were adjusted for age, sex, race/ethnicity, BMI, and physical activity.
To evaluate nonlinear relationships between serum 25(OH)D and HbA1c, restricted cubic spline regression models with four knots were fitted. Model estimates are presented as β coefficients with 95% confidence intervals (CIs). Statistical significance was defined as a two-sided P-value < 0.05.
All statistical analyses were conducted using R software.
Institutional Review Board statement
NHANES protocols were approved by the National Center for Health Statistics Research Ethics Review Board. The present study utilized publicly available de-identified data and was therefore exempt from additional institutional review board approval.
Ethical compliance statement
This study was conducted in accordance with the ethical standards of the responsible institution on human subjects and with the Helsinki Declaration.
| Results | ▴Top |
Participant characteristics
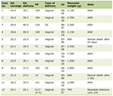
Baseline participant characteristics are summarized in Table 1.
 Click to view | Table 1. Baseline Characteristics of Study Participants (NHANES 2017–2018) |
The study included 5,136 adults representative of the US population. The mean age was 50 ± 19 years, and 52% of participants were female. Mean BMI was 30 ± 7 kg/m2, mean HbA1c was 5.84±1.09%, and mean serum 25(OH)D concentration was 68 ± 32 nmol/L (Table 1).
Approximately 30% of participants were vitamin D deficient, 35% were insufficient, and 36% had sufficient vitamin D concentrations.
Multivariable regression findings are presented in Table 2.
Click to view | Table 2. Multivariable Association Between Serum 25(OH)D and HbA1c |
Multivariable analysis
In adjusted survey-weighted regression models, vitamin D insufficiency was not significantly associated with HbA1c compared with vitamin D deficiency (β = −0.051; 95% CI −0.120 to 0.019; P = 0.156). In contrast, vitamin D sufficiency was significantly associated with lower HbA1c levels (β = −0.189; 95% CI −0.263 to −0.115; P < 0.001).
Age and BMI demonstrated positive associations with HbA1c, whereas physical activity was inversely associated with HbA1c. Female sex was associated with slightly lower HbA1c values compared with male sex.
Nonlinear analysis
Restricted cubic spline modeling demonstrated a nonlinear, non-monotonic association between serum 25(OH)D and HbA1c. HbA1c values remained relatively stable across lower vitamin D concentrations and declined modestly at higher concentrations. CIs overlapped across portions of the spline curve, suggesting a modest overall effect size. The nonlinear spline relationship is illustrated in Figure 1.
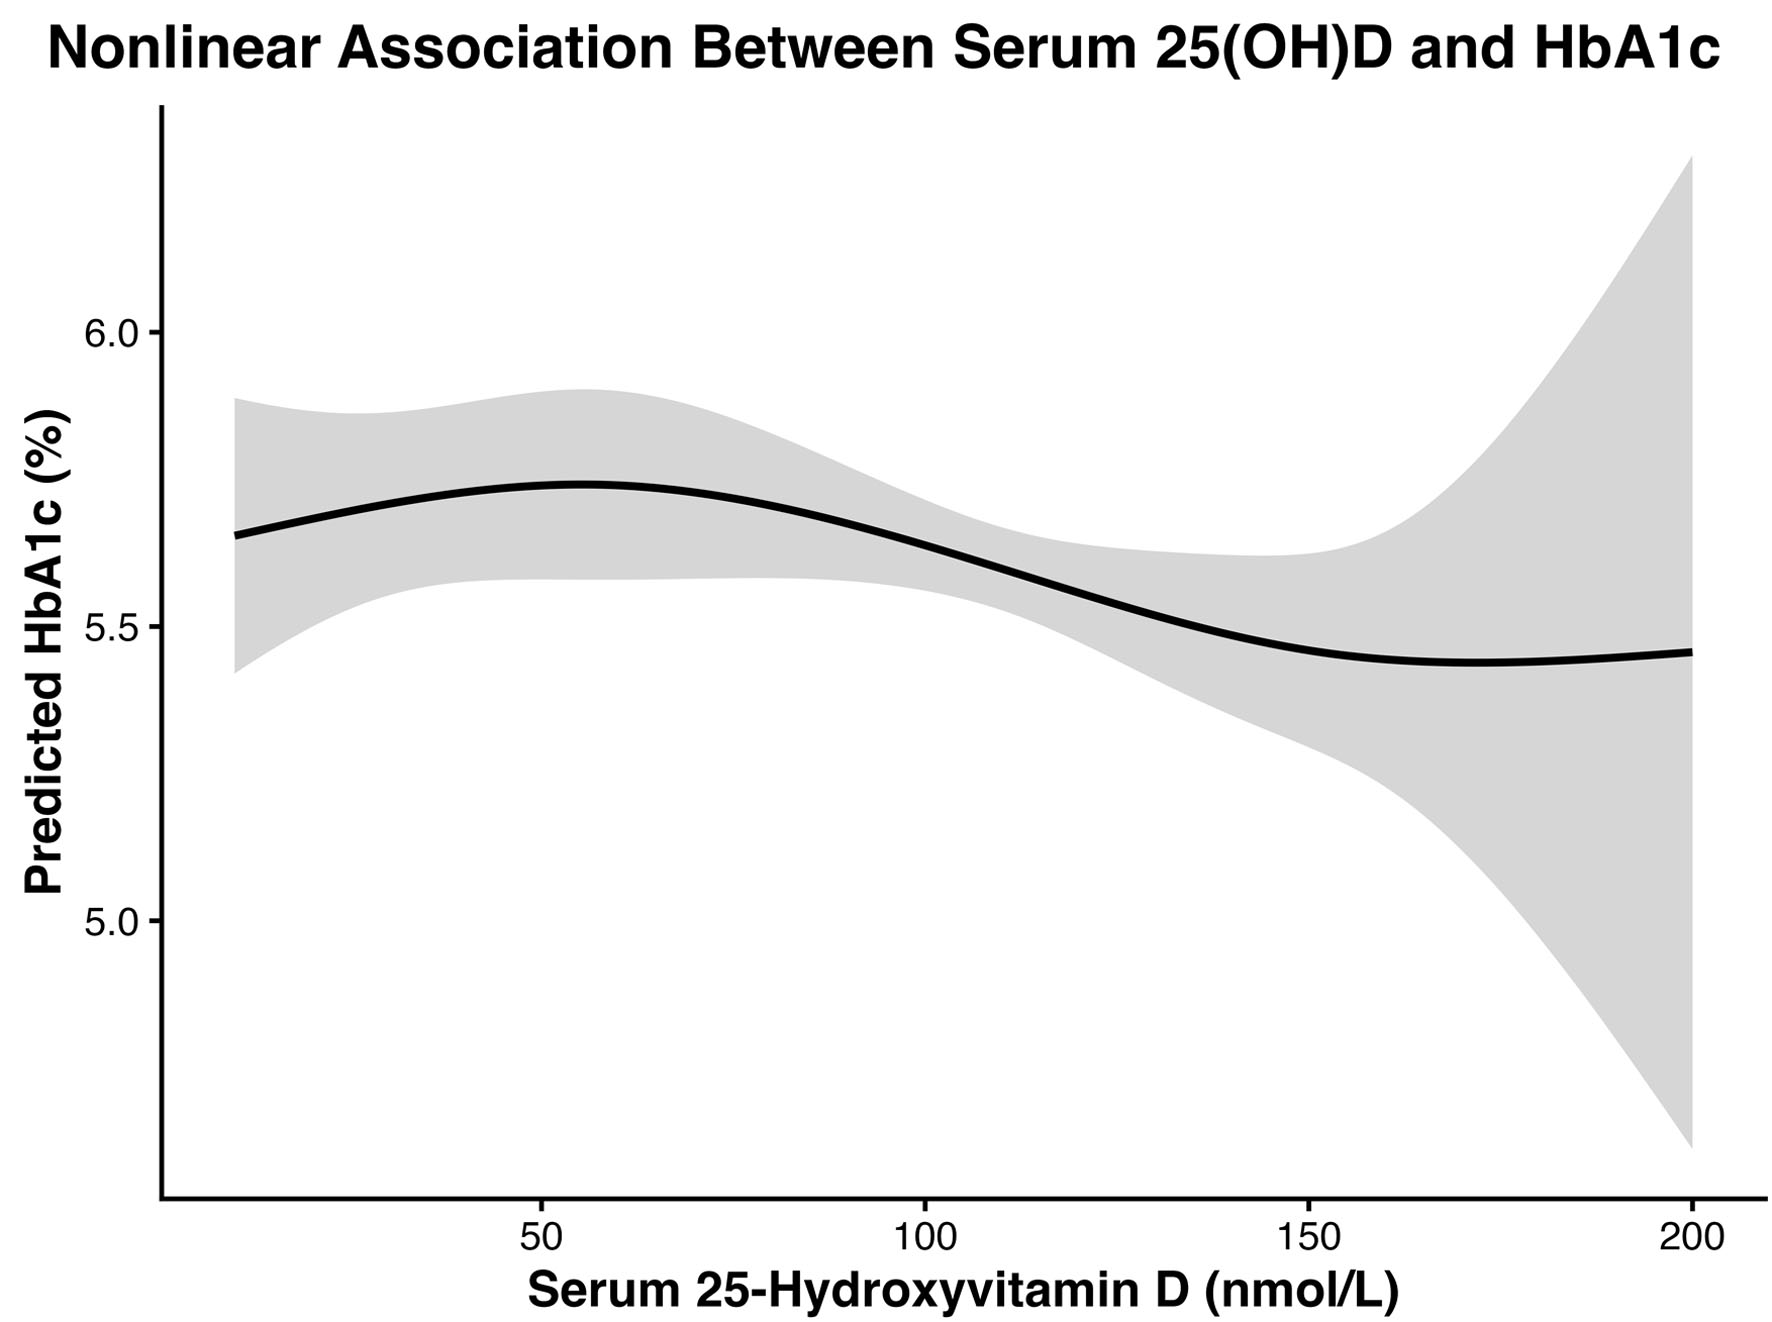 Click for large image | Figure 1. Restricted cubic spline regression demonstrating the nonlinear association between serum 25(OH)D concentrations and predicted HbA1c levels. Shaded regions represent 95% confidence intervals. HbA1c: glycated hemoglobin; 25(OH)D: serum 25-hydroxyvitamin D. |
Subgroup analyses according to age group, BMI category, and sex demonstrated generally consistent trends across demographic strata.
| Discussion | ▴Top |
In this nationally representative analysis of US adults, serum 25(OH)D demonstrated a modest nonlinear association with glycemic control. Rather than a strictly linear relationship, HbA1c remained relatively stable across lower vitamin D concentrations, followed by a modest decline at higher vitamin D levels.
Several biologic mechanisms may explain these observations. Vitamin D receptors are expressed in pancreatic β cells and peripheral tissues involved in insulin signaling. Experimental studies suggest that vitamin D may influence insulin secretion, inflammatory signaling, and insulin sensitivity [7]. However, receptor-mediated pathways may exhibit threshold-dependent or saturable dynamics, potentially explaining the nonlinear relationship observed in our spline analysis [6].
Beyond the conventional conversion of vitamin D3 to 25-hydroxyvitamin D and subsequently to 1,25-dihydroxyvitamin D, vitamin D3 can also undergo CYP11A1-initiated metabolism to generate hydroxyderivatives such as 20-hydroxyvitamin D3 and 20,23-dihydroxyvitamin D3 [8, 9]. The metabolites may exhibit distinct receptor-mediated effects, including signaling through the vitamin D receptor and modulation of other nuclear receptors involved in inflammatory and metabolic pathways. This broader vitamin D metabolome may represent an additional biologic context for the observed association with glycemic control [8]. However, because CYP11A1-derived metabolites were not measured in this study and the analysis was cross-sectional, their contribution to the observed nonlinear relationship cannot be determined.
Our findings may also help reconcile inconsistencies in prior epidemiologic literature. Previous NHANES-based analyses, observational cohort studies, and Mendelian randomization analyses have variably demonstrated inverse associations between serum vitamin D concentrations and diabetes-related outcomes [3, 10], although many associations attenuated after adjustment for adiposity and behavioral covariates. Our nonlinear spline analysis suggests that these relationships may not be adequately characterized using conventional linear modeling approaches. Although vitamin D sufficiency was associated with lower HbA1c levels, the magnitude of association was modest after adjustment for obesity and lifestyle-related variables.
The nonlinear association may reflect the role of vitamin D in insulin release, insulin responsiveness, inflammatory processes, and glucose regulation; however, the findings cannot establish a direct biological effect. Because of the cross-sectional design, the temporal relationship between serum 25(OH)D and glycemic control cannot be determined, and the results should not be interpreted as evidence of a causal effect. In addition, vitamin D status was assessed at a single time point and may not reflect long-term exposure because serum 25(OH)D levels can vary with season, recent supplement use, illness, and intra-individual biological variation. Residual confounding also remains possible, as sunlight exposure, dietary vitamin D intake, physical activity, adiposity, supplement use, comorbid conditions, and medication use may affect both vitamin D status and glycemic measures and may not have been fully accounted for. Seasonal variation in ultraviolet light exposure may have further influenced the measured vitamin D concentrations and, consequently, the observed nonlinear association [11, 12]. Future prospective studies with repeated measurements, detailed assessment of these factors, and longitudinal glycemic follow-up are needed to clarify the direction and clinical significance of this relationship.
These results suggest that vitamin D may function more as a marker of overall metabolic health rather than a direct determinant of glycemic control, consistent with prior studies linking vitamin D biomarkers to diabetes-related complications [13]. This interpretation is consistent with randomized clinical trials that have generally shown limited glycemic benefit from vitamin D supplementation in unselected populations [5].
Limitations
This study should be interpreted within the context of several limitations. First, the cross-sectional design precludes causal inference. Second, residual confounding remains possible despite multivariable adjustment. Third, serum vitamin D concentrations were measured at a single time point and may not reflect long-term vitamin D status. Fourth, seasonal variation in vitamin D levels was not assessed. Finally, physical activity was self-reported and may be subject to recall bias and misclassification.
Conclusion
Serum 25(OH)D demonstrated a modest nonlinear association with HbA1c in US adults. Higher vitamin D concentrations were associated with slightly lower HbA1c levels, although the overall magnitude of association was limited. These findings support the interpretation of vitamin D as a marker of broader metabolic health rather than a primary determinant of glycemic control.
Acknowledgments
The authors acknowledge the National Center for Health Statistics and the participants of the NHANES for providing publicly available data used in this study.
Financial Disclosure
This research received no external funding.
Conflict of Interest
The authors declare no conflicts of interest.
Informed Consent
Written informed consent was obtained from all participants involved in NHANES by the National Center for Health Statistics.
Author Contributions
Conceptualization: George Khayrallah Altarcha; methodology: George Khayrallah Altarcha; formal analysis: George Khayrallah Altarcha; writing – original draft preparation: George Khayrallah Altarcha; writing – review and editing: Aksa Alina Joy and Joseph Iglesias. All authors reviewed and approved the final manuscript.
Data Availability
The datasets analyzed during the current study are publicly available through the National Health and Nutrition Examination Survey (NHANES) database at https://www.cdc.gov/nchs/nhanes/.
| References | ▴Top |
- Afkarian M, Sachs MC, Kestenbaum B, Hirsch IB, Tuttle KR, Himmelfarb J, de Boer IH. Kidney disease and increased mortality risk in type 2 diabetes. J Am Soc Nephrol. 2013;24(2):302-308.
doi pubmed - Veldurthy V, Wei R, Oz L, Dhawan P, Jeon YH, Christakos S. Vitamin D, calcium homeostasis and aging. Bone Res. 2016;4:16041.
doi pubmed - Bischoff-Ferrari H. Health effects of vitamin D. Dermatol Ther. 2010;23(1):23-30.
doi pubmed - Kositsawat J, Freeman VL, Gerber BS, Geraci S. Association of A1C levels with vitamin D status in U.S. adults: data from the National Health and Nutrition Examination Survey. Diabetes Care. 2010;33(6):1236-1238.
doi pubmed - Pittas AG, Chung M, Trikalinos T, Mitri J, Brendel M, Patel K, Lichtenstein AH, et al. Systematic review: Vitamin D and cardiometabolic outcomes. Ann Intern Med. 2010;152(5):307-314.
doi pubmed - Scragg R. Emerging Evidence of Thresholds for Beneficial Effects from Vitamin D Supplementation. Nutrients. 2018;10(5).
doi pubmed - Park S, Kim DS, Kang S. Vitamin D deficiency impairs glucose-stimulated insulin secretion and increases insulin resistance by reducing PPAR-gamma expression in nonobese Type 2 diabetic rats. J Nutr Biochem. 2016;27:257-265.
doi pubmed - Slominski AT, Kim TK, Li W, Yi AK, Postlethwaite A, Tuckey RC. The role of CYP11A1 in the production of vitamin D metabolites and their role in the regulation of epidermal functions. J Steroid Biochem Mol Biol. 2014;144(Pt A):28-39.
doi pubmed - Guryev O, Carvalho RA, Usanov S, Gilep A, Estabrook RW. A pathway for the metabolism of vitamin D3: unique hydroxylated metabolites formed during catalysis with cytochrome P450scc (CYP11A1). Proc Natl Acad Sci U S A. 2003;100(25):14754-14759.
doi pubmed - Ye Z, Sharp SJ, Burgess S, Scott RA, Imamura F, InterAct C, Langenberg C, et al. Association between circulating 25-hydroxyvitamin D and incident type 2 diabetes: a mendelian randomisation study. Lancet Diabetes Endocrinol. 2015;3(1):35-42.
doi pubmed - Jorde R, Sneve M, Hutchinson M, Emaus N, Figenschau Y, Grimnes G. Tracking of serum 25-hydroxyvitamin D levels during 14 years in a population-based study and during 12 months in an intervention study. Am J Epidemiol. 2010;171(8):903-908.
doi pubmed - Sachs MC, Shoben A, Levin GP, Robinson-Cohen C, Hoofnagle AN, Swords-Jenny N, Ix JH, et al. Estimating mean annual 25-hydroxyvitamin D concentrations from single measurements: the Multi-Ethnic Study of Atherosclerosis. Am J Clin Nutr. 2013;97(6):1243-1251.
doi pubmed - Ahmed LHM, Butler AE, Dargham SR, Latif A, Chidiac OM, Atkin SL, Abi Khalil C. Vitamin D(3) metabolite ratio as an indicator of vitamin D status and its association with diabetes complications. BMC Endocr Disord. 2020;20(1):161.
doi pubmed
This article is distributed under the terms of the Creative Commons Attribution 4.0 International License (CC BY 4.0), which permits unrestricted use, distribution, and reproduction in any medium, including commercial use, provided the original work is properly cited.
Journal of Endocrinology and Metabolism is published by Elmer Press Inc.