| Journal of Endocrinology and Metabolism, ISSN 1923-2861 print, 1923-287X online, Open Access |
| Article copyright, the authors; Journal compilation copyright, J Endocrinol Metab and Elmer Press Inc |
| Journal website https://jem.elmerpub.com |
Original Article
Volume 16, Number 5, October 2026, pages 201-216

Sleep Duration and Insulin Resistance: Meta-Analysis Reveals Sleep Restriction Linked to Higher Insulin Resistance, and Mendelian Randomization Suggests Glucagon-Like Peptide-1 Receptor Agonist May Contribute to Sleep Modulation
Si Rui Zenga, c, Liang Yan Wua, c, Cai Xia Maa, c, Xiao Fang Zhangb, Wei Lin Chena, Yong Ting Zhaoa, Jia Xin Wanga, Shi Shi Lia, Li Hong Wanga, d
aDepartment of Endocrinology and Metabolism, The First Affiliated Hospital of Jinan University, Guangzhou, Guangdong, China
bThe Academician Cooperative Laboratory of Basic and Translational Research on Chronic Diseases, Jinan University First Affiliated Hospital, Guangzhou, Guangdong, China
cThese authors contributed equally to this work and share first authorship.
dCorresponding Author: Li Hong Wang, Department of Endocrinology and Metabolism, The First Affiliated Hospital of Jinan University, Guangzhou, Guangdong, China
Manuscript submitted May 23, 2026, accepted September 11, 2026, published online October 31, 2026
Short title: Sleep Duration and Insulin Resistance
doi: https://doi.org/10.14740/jem1655
| Abstract | ▴Top |
Background: The study aimed to evaluate the association between sleep duration and insulin resistance (IR), compare the sensitivity of two IR indices (homeostatic model assessment for insulin resistance (HOMA-IR) vs. Matsuda Index), and investigate the causal impact of glucagon-like peptide-1 receptor agonists (GLP-1RAs) on sleep traits through Mendelian randomization (MR).
Methods: We conducted a meta-analysis of randomized controlled trials and clinical studies (2014–2024) examining sleep duration’s effect on insulin sensitivity (IS), measured via HOMA-IR and Matsuda Index. Additionally, a two-sample MR analysis utilized single nucleotide polymorphisms (SNPs) related to GLP-1R expression and sleep traits (insomnia, short/long duration, chronotype) to assess the causal influence of GLP-1RA exposure on sleep characteristics.
Results: Meta-analysis revealed that reduced sleep duration was significantly associated with increased IR based on HOMA-IR, whereas the Matsuda Index, fasting blood glucose, and fasting insulin showed inconsistent associations. Promoting sleep extension may improve HOMA-IR readings. The MR analysis indicated a causal relationship between genetically proxied GLP-1RA exposure and changes in sleep: specifically, reduced total sleep time and an earlier sleep phase.
Conclusions: Sleep duration is a key modifiable determinant of IR, with HOMA-IR demonstrating greater sensitivity to sleep-related IS changes. Moreover, GLP-1RA may modify sleep architecture—shortening sleep duration and advancing sleep timing—which could offset some therapeutic effects on IR. These findings support integrating sleep management into personalized treatment strategies for individuals with IR.
Keywords: Insulin resistance; Sleep; Type 2 diabetes mellitus
| Introduction | ▴Top |
The global prevalence of diabetes has risen steadily in recent years, driven by a complex interplay of factors including economic conditions, dietary habits, and environmental influences. As of 2021, an estimated 529 million individuals worldwide were living with diabetes, reflecting a global prevalence of 6.1% [1]. This escalating burden poses significant challenges to healthcare systems, particularly amid aging populations. Insulin resistance (IR), a central pathophysiological mechanism underlying numerous metabolic disorders—including type 2 diabetes mellitus (T2DM) [2]—has garnered increasing attention due to its well-established links to cardiovascular complications and renal dysfunction, both of which substantially contribute to morbidity and mortality [3]. Accordingly, the identification and management of IR continue to be key priorities in diabetes research and clinical practice. Sleep has recently emerged as a modifiable yet underexamined factor influencing IR. A growing body of evidence suggests that both sleep duration and sleep architecture play significant roles in metabolic regulation, with chronic sleep restriction consistently associated with decreased insulin sensitivity (IS) [4]. However, the impact of extended sleep duration remains less clearly defined. A 2022 consensus report on T2DM management notably emphasized, for the first time, the clinical relevance of sleep quality, quantity, and chronotype in maintaining glucose homeostasis [5]. Despite this recognition, global sleep trends continue to deteriorate. Current guidelines recommend at least 7 h of sleep per night for adults [6]. However, in the United States, average sleep duration falls short of the recommended minimum, with individuals sleeping only 6.5 h per night on average [7]. Similarly, in China, approximately 64.78% of the population reports sleeping between 6 and 8 h per night, which falls short of the recommended duration [8]. These patterns raise important concerns regarding the feasibility of integrating sleep hygiene into public health strategies for managing T2DM and other IR-related metabolic disorders.
The growing burden of IR has also prompted extensive discussion regarding its evaluation and management. Reliable assessment of IS is fundamental to optimizing the clinical management of T2DM. Two commonly utilized indices include the homeostatic model assessment for insulin resistance (HOMA-IR) [9] and the Matsuda Index [10]. Both are derived from plasma glucose and insulin concentrations, typically measured during oral glucose tolerance tests (OGTTs) or hyperinsulinemic–euglycemic clamp studies. HOMA-IR primarily reflects hepatic IR, emphasizing the feedback loop between hepatic glucose production and pancreatic β-cell function. Despite their clinical utility, there remains a lack of consensus regarding the most appropriate contexts in which each index should be applied. Previous research investigating the interplay between sleep and IR has often relied on surrogate markers such as body mass index (BMI), fasting blood glucose (FBG), OGTT results, and C-peptide levels [11]. Although newer parameters such as IS have been introduced in sleep-related studies [12], the comparative performance of HOMA-IR and the Matsuda Index in this domain remains insufficiently explored. Thus, a systematic comparison of these indices in the context of varying sleep patterns is warranted.
For treatment, interventions aimed at improving IS, such as weight reduction and decreased adiposity, have been shown to attenuate disease progression [13]. Among pharmacological strategies, glucagon-like peptide-1 receptor agonists (GLP-1RAs) are widely recognized antidiabetic agents that induce weight loss, stabilize glycemic control, enhance IS [14], and confer additional cardiometabolic and renal benefits [15]. Some GLP-1RAs and dual receptor agonists, including liraglutide and tirzepatide, have been shown to reduce the severity of obstructive sleep apnea (OSA) [16]. Moreover, current evidence supports strong associations between sleep and the risk of cardiovascular and chronic kidney diseases, for which GLP-1RAs may be beneficial [17, 18]. However, research on the effects of physiological sleep patterns remains limited. Additionally, it remains unclear whether GLP-1RAs, as first-line therapies, influence sleep patterns in insulin-resistant populations.
To address these gaps, the present study employs both a meta-analysis and a two-sample Mendelian randomization (MR) approach to evaluate the relationship between sleep duration and IR, and to explore the potential causal effects of GLP-1RAs on sleep-related phenotypes.
| Materials and Methods | ▴Top |
To address the issues raised in the introduction, we conducted a meta-analysis and a two-sample MR analysis to investigate our research objective. The methods section is organized into two parts, covering method selection, data sources, selection criteria, definitions of terms, and statistical analyses.
Meta-analysis methods
Literature search
A systematic literature search was conducted in the PubMed database to identify randomized controlled trials (RCTs), clinical studies, and non-interventional studies related to sleep deprivation and IR, published between January 1, 2014, and December 31, 2024. To enhance search precision, Medical Subject Headings (MeSH) were employed alongside topic-specific keywords. A total of 367 articles were initially retrieved, and an additional 17 studies were included based on reference list screening, yielding 379 articles for full screening. All included studies were evaluated for risk of bias using standardized forms appropriate for each study design, independently assessed by two reviewers, with discrepancies resolved through discussion. Risk of bias was assessed in accordance with the Cochrane Handbook for Systematic Reviews of Interventions. The detailed search strategy and risk of bias summary are presented in Figures 1 and 2 and the characteristic of included articles are illustrated in Table 1 [19–37].
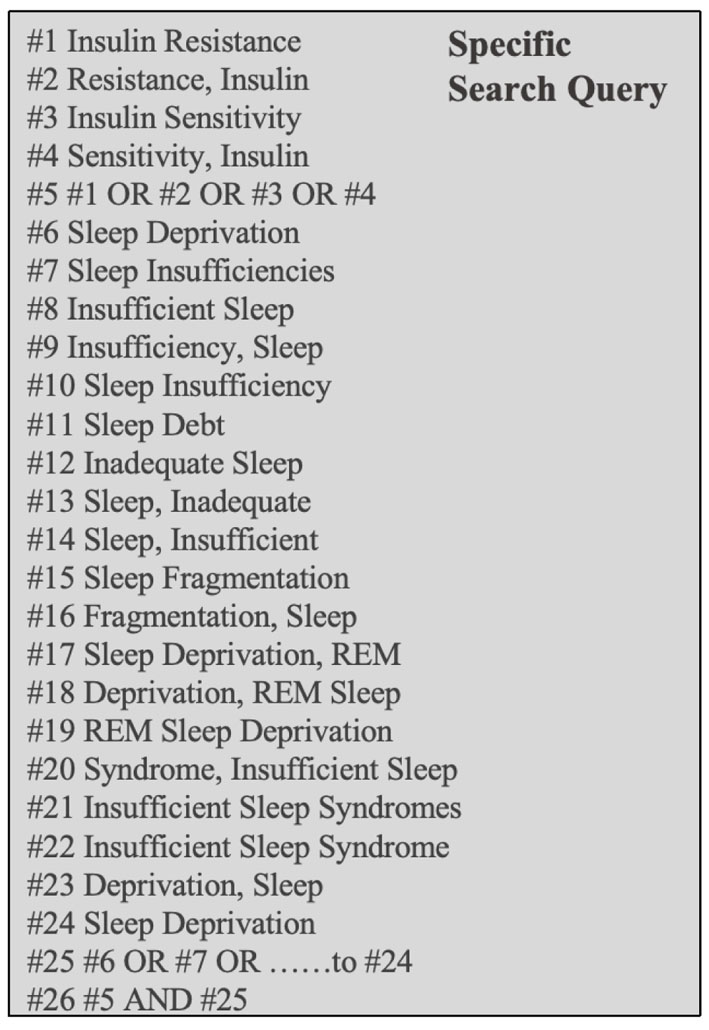 Click for large image | Figure 1. Search strategy illustrating the specific Medical Subject Headings (MeSH) terms included in the query. Logical operators OR and AND were used to refine the search. REM: rapid eye movement. |
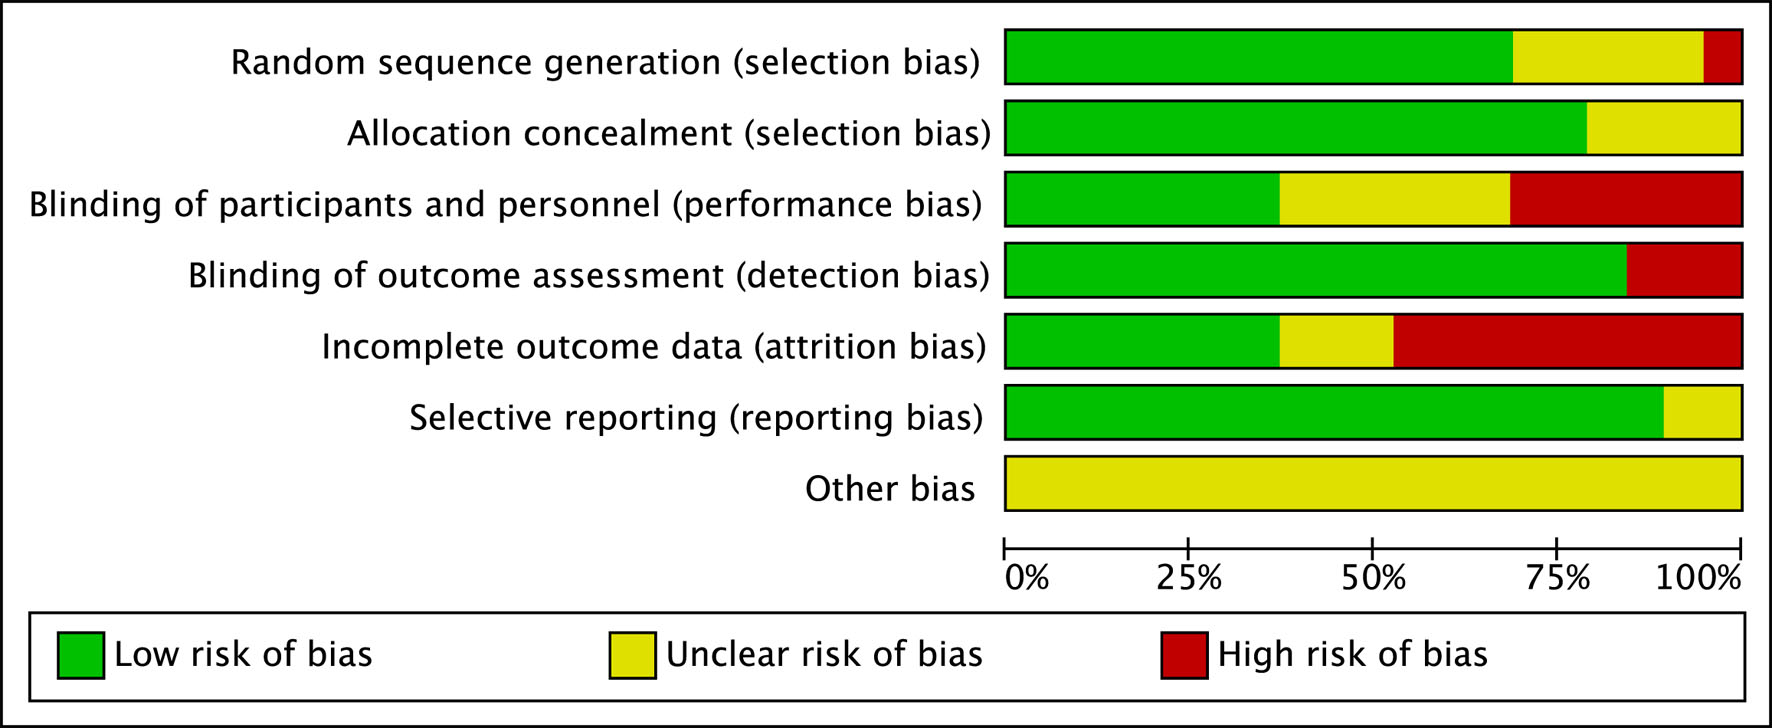 Click for large image | Figure 2. This colorful bias assessment table exhibits the judgments of researchers to included articles. The left list shows various kinds of bias. Green denotes low risk of bias, yellow unclear risk, and red high risk. |
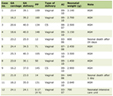 Click to view | Table 1. An Overview of the Key Characteristics of the Studies Incorporated in Our Meta-Analysis |
Study selection
Eligible studies were limited to non-interventional studies, clinical trials, and RCTs, as classified in the journal’s indexing or described in their methodology sections. Participants ranged in age from 11 to 65 years, and demographic variables including sex, nationality, and BMI were documented to facilitate subgroup analyses. Critical variables such as the presence of T2DM or other metabolic conditions, along with baseline and post-intervention sleep duration, were also recorded.
Exclusion criteria
Studies were excluded if they met any of the following criteria: (1) publication in a language other than English or Chinese; (2) duplicate reporting; (3) incomplete or missing data; (4) absence of outcomes related to changes in IS or completion of a sleep intervention.
Data extraction
The primary exposure of interest, sleep restriction, encompassed acute and chronic reductions in sleep duration, insomnia, poor sleep quality, and frequent nocturnal awakenings. The overall study selection and data extraction process is illustrated in Figure 3. The observation period concluded either upon measurable changes in IS or completion of the sleep intervention.
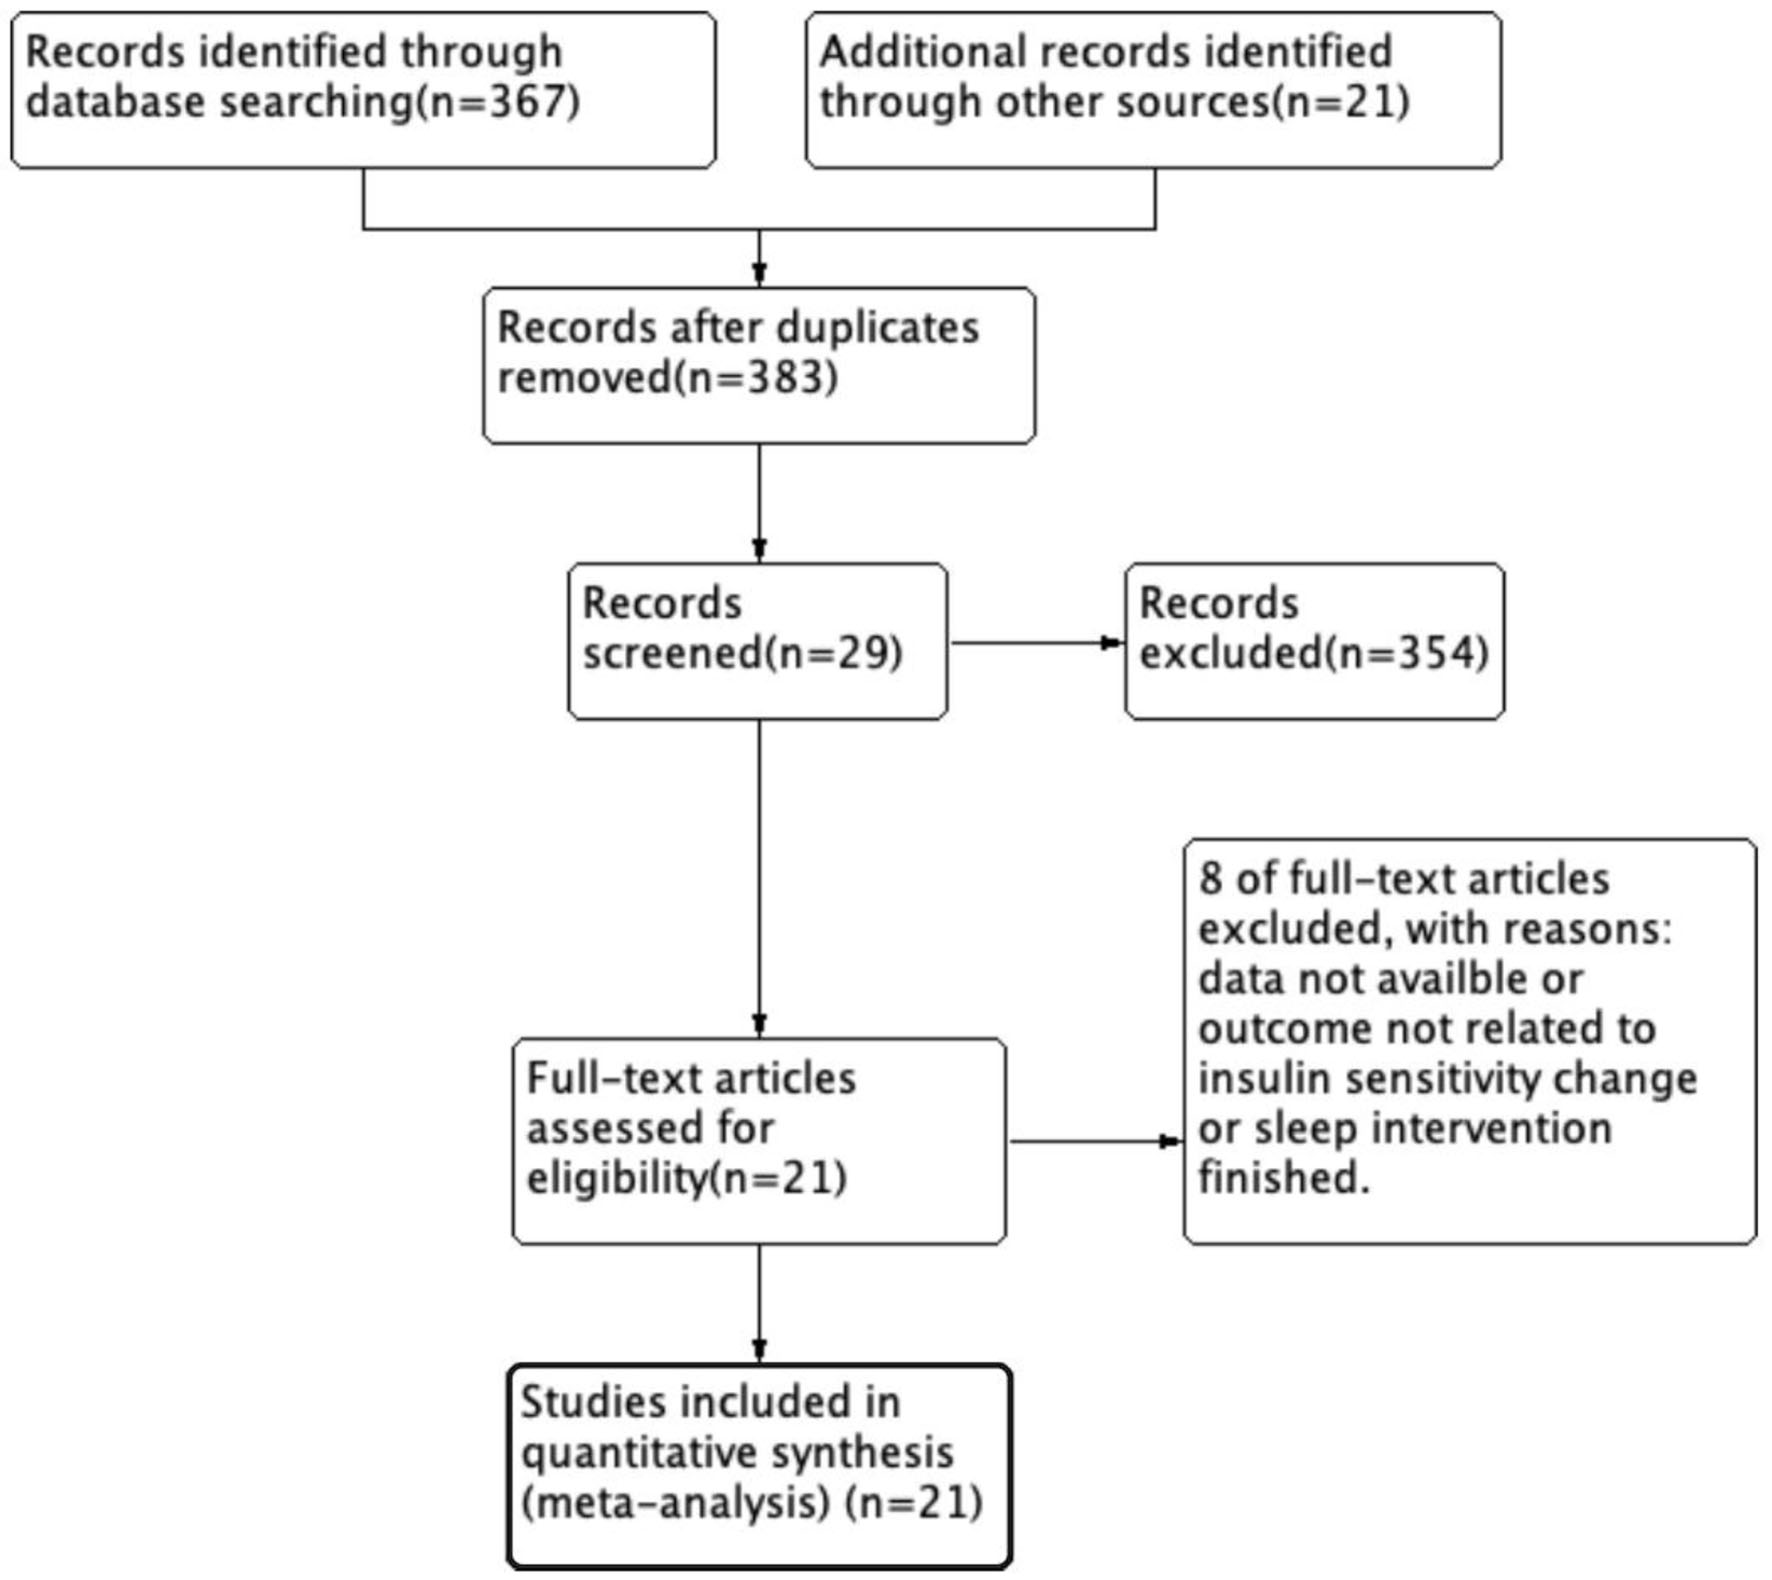 Click for large image | Figure 3. Study flow diagram illustrating the article screening process in this meta-analysis. The arrows indicate the progression through each step of inclusion and exclusion. |
Diagnosis and indices of IR
IR was diagnosed in accordance with the 2022 Expert Consensus on Clinical Issues Related to Insulin Resistance, using the following parameters: (1) HOMA-IR, calculated as HOMA-IR = (fasting blood glucose (mmol/L) × fasting blood insulin (µU/mL))/22.5. While no universally accepted threshold exists, elevated HOMA-IR values are generally considered indicative of IR [38]. (2) FBG: Levels between 5.6 and 6.9 mmol/L were classified as impaired fasting glucose (IFG) and used as a secondary marker of IS. (3) Fasting blood insulin (FBI): A fasting insulin level > 20 µU/mL was indicative of IR. Participants below these thresholds were categorized as non-resistant. This study also assessed post-intervention changes in FBI. (4) Matsuda Index, calculated as 10,000/((G0 × I0)1/2 × (Gmean × Imean)1/2), where G0 and I0 represent FBG (mmol/L) and insulin (µU/mL), respectively, and Gmean and Imean reflect mean glucose and insulin values obtained during OGTT. This index evaluates hepatic and peripheral IS, as well as β-cell function [39].
Statistical analysis
Meta-analysis was performed using Review Manager (RevMan) version 5.4. The mean difference (MD) was utilized as the effect size, with 95% confidence intervals (CIs). Statistical heterogeneity was evaluated using the Q-test (α = 0.1) and quantified with the I2 statistic. In the absence of significant heterogeneity, a random-effects model was applied. If heterogeneity was present, subgroup or sensitivity analyses were conducted to identify potential sources, followed by the application of a random-effects model. Statistical significance was defined as a two-tailed α < 0.05.
MR
The two-sample MR is a genetic epidemiological approach used to infer causal relationships between exposures and outcomes. By employing genetic variants as instrumental variables (IVs), this method effectively minimizes confounding and mitigates reverse causation. In the two-sample MR framework, genetic associations with both the exposure and the outcome are derived from independent, non-overlapping datasets, typically sourced from large genome-wide association studies (GWAS). This approach enhances statistical power and enables the evaluation of causal effects even in the absence of individual-level data. Given that the objective of this study is to elucidate the causal relationship between sleep duration and IS, two-sample MR was selected as the optimal method due to its robust capacity to control for confounding variables.
Design overview
Robust instrumental variables are essential for drawing valid causal inferences in MR analyses. In this context, single nucleotide polymorphisms (SNPs)—the most prevalent form of genetic variation—serve as instrumental variables. SNPs involve a single base-pair change at a specific genomic locus and may influence phenotypic traits, disease susceptibility, or responses to environmental exposures. These SNPs enable the establishment of causal links between exposures and outcomes by leveraging their established associations with the exposure of interest, as identified in GWAS datasets.
In the present study, SNPs associated with both sleep duration and GLP-1R were selected. GLP-1R gene expression in whole blood, as documented in GWAS repositories, was used as a proxy for GLP-1RA exposure. Sleep-related SNPs were categorized based on four phenotypes: insomnia, short sleep, long sleep, and chronotype. A two-sample MR analysis was then conducted to evaluate the causal relationship between these SNPs and IR.
Data sources
All genetic instruments used for exposures and outcomes were extracted from publicly available GWAS summary statistics, so the permissions had been obtained to access these databases. The UK Biobank served as the primary data source, given its extensive, high-quality genetic data. To minimize the potential for population stratification bias, SNPs used in this analysis were of European ancestry and drawn from independent datasets.
Exposures
A total of 235 cis-expression quantitative trait loci (cis-eQTLs), specifically SNPs, were obtained from the eQTLGen Consortium [40, 41]. These SNPs were selected based on a minor allele frequency (MAF) > 1% and a genome-wide significance threshold of P < 5.0 × 10⁻⁸ for association with GLP-1R expression in blood. These variants served as instrumental variables representing GLP-1RA exposure [42]. GLP-1RAs, which are Food and Drug Administration (FDA)-approved for the management of hyperglycemia and body weight, were included as pharmacological exposures. SNPs associated with GLP-1RAs were further examined for potential pleiotropic effects.
Given the focus on IS, only SNPs associated with relevant metabolic traits—such as fasting glucose, fasting insulin, hemoglobin A1c (HbA1c), 1-h OGTT, BMI, and both type 1 and T2DM—were retained. These traits are either directly involved in the pathophysiology of IR or used in calculating IS indices such as HOMA-IR and the Matsuda Index. SNPs primarily associated with unrelated or confounding conditions, e.g., smoking, non-alcoholic fatty liver disease, leptin levels, cardiovascular risk, vascular dementia, or morbid obesity, were excluded from the final analysis. Hence, the selected SNPs (n = 8) were carried forward for the final calculation.
Outcome
For the outcome, sleep, we first categorized the types of sleep duration into four distinct groups: insomnia, long sleep, short sleep, and chronotype. These classifications were derived from the Sleep Disorder Knowledge Portal [43]. Insomnia (n = 453,379) was defined as a sleep disorder characterized by difficulty falling asleep or maintaining sleep. Participants who responded “sometimes” or “usually” to the question, “Do you have trouble falling asleep at night or do you wake up in the middle of the night?” were classified into the insomnia group [44].
Chronotype (n = 449,734) was defined based on responses to two identical questions: “Are you naturally a night person or a morning person?”. For this study, only those identified as “morning people” or “early birds” were included as the morning chronotype group [45].
Sleep duration was classified as short sleep (n = 106,192), < 6 h per night, or long sleep (n = 34,184), > 9 h per night, based on self-reported habitual sleep duration. The distinction between short sleep and insomnia was made by the presence of symptoms. Insomnia was associated with difficulties in concentration or other symptoms, while short sleep was defined solely by the duration of sleep, with no accompanying discomfort or cognitive impairment [46]. The key distinction is the voluntary vs. involuntary nature of the short sleep.
Statistics and sensitivity analysis
R version 4.4.2 was used to perform two-sample MR using the TwoSampleMR package (version 0.6.8). The primary focus of the analysis was on the inverse variance weighted (IVW) method, with a P-value threshold set at < 0.01. Additionally, it was essential to perform heterogeneity and pleiotropy tests to ensure the robustness of the results. Cochran’s Q test was employed to assess heterogeneity among the calculated SNPs, with a P-value > 0.05 indicating no significant heterogeneity. For pleiotropy evaluation, MR-Egger regression was conducted, with a β value significantly different from zero suggesting the presence of pleiotropy, while a P-value > 0.05 was considered indicative of no significant pleiotropic effects. In addition, the leave-one-out sensitivity analysis would be employed to recheck the reliability of the result. It involves iteratively removing individual genetic variants and recalculating the causal estimate. This assesses whether the overall result is unduly influenced by any single variant, thereby testing the robustness of the causal inference. All results were visualized using scatter plots and forest plots.
Study design of MR is shown in Figure 4.
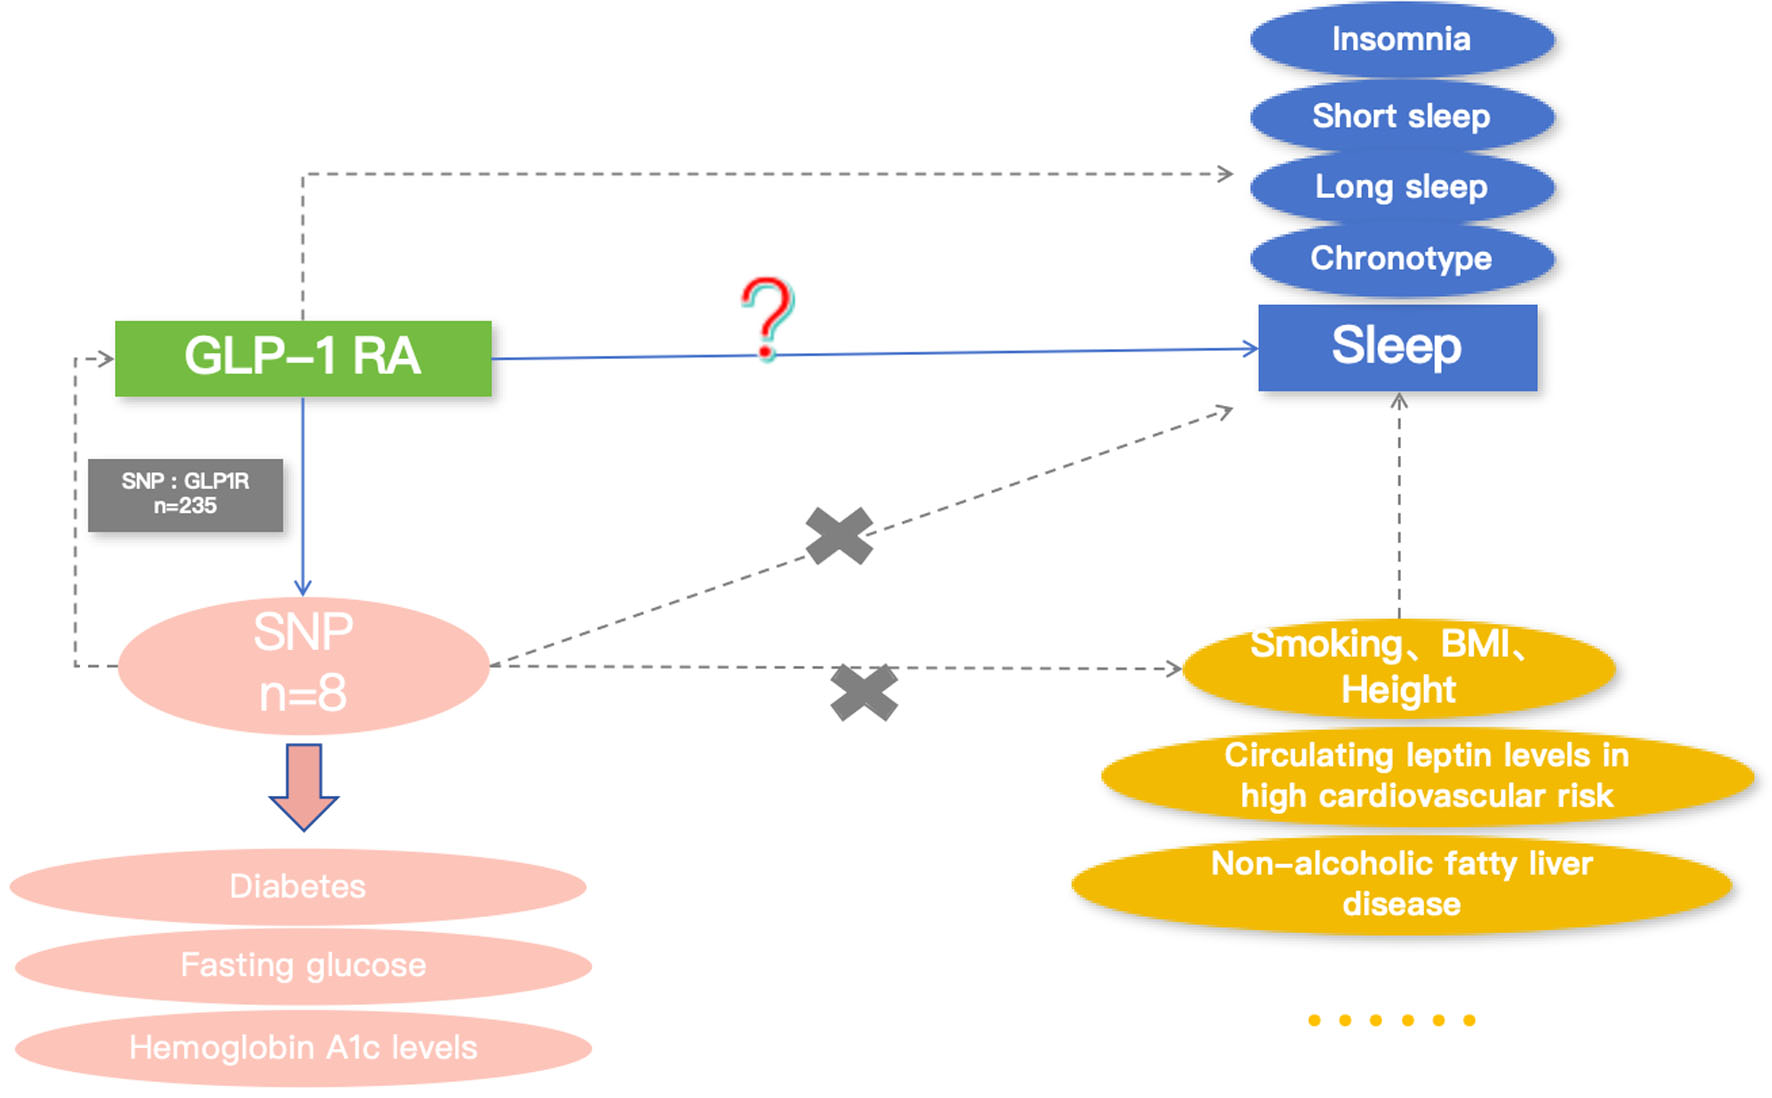 Click for large image | Figure 4. Directed acyclic graph (DAG) of the two-sample Mendelian randomization (MR) analysis examining the effects of glucagon-like peptide-1 receptor agonist (GLP-1RA) phenotypes on various sleep patterns. The solid blue arrow marked with a red question mark represents the primary relationship explored in this study. Yellow blocks denote confounding variables, while yellow ellipses indicate unspecified external factors. Pink blocks along the pink arrow describe the traits of the selected SNPs. Blue blocks represent different included sleep behaviors. SNP: single nucleotide polymorphism; BMI: body mass index; short sleep: short sleep duration; long sleep: long sleep duration; chronotype: morning chronotype. |
| Results | ▴Top |
This section is organized into two parts, corresponding to the two analytical approaches. The first part reports the meta-analysis results, including sleep restriction and sleep extension. The second part reports the two-sample MR results also containing these two sections.
Meta-analysis of sleep restriction
Matsuda Index
Figure 5a presents a meta-analysis using the Matsuda Index as the outcome measure (the number of included article = 6). Due to substantial statistical heterogeneity (P < 0.00001, I2 = 88%), a random-effects model was applied to account for clinical variation across the five included studies. The pooled analysis yielded no statistically significant effect (Z = 1.05, P = 0.30), suggesting that sleep restriction is not significantly associated with IR when assessed using the Matsuda Index.
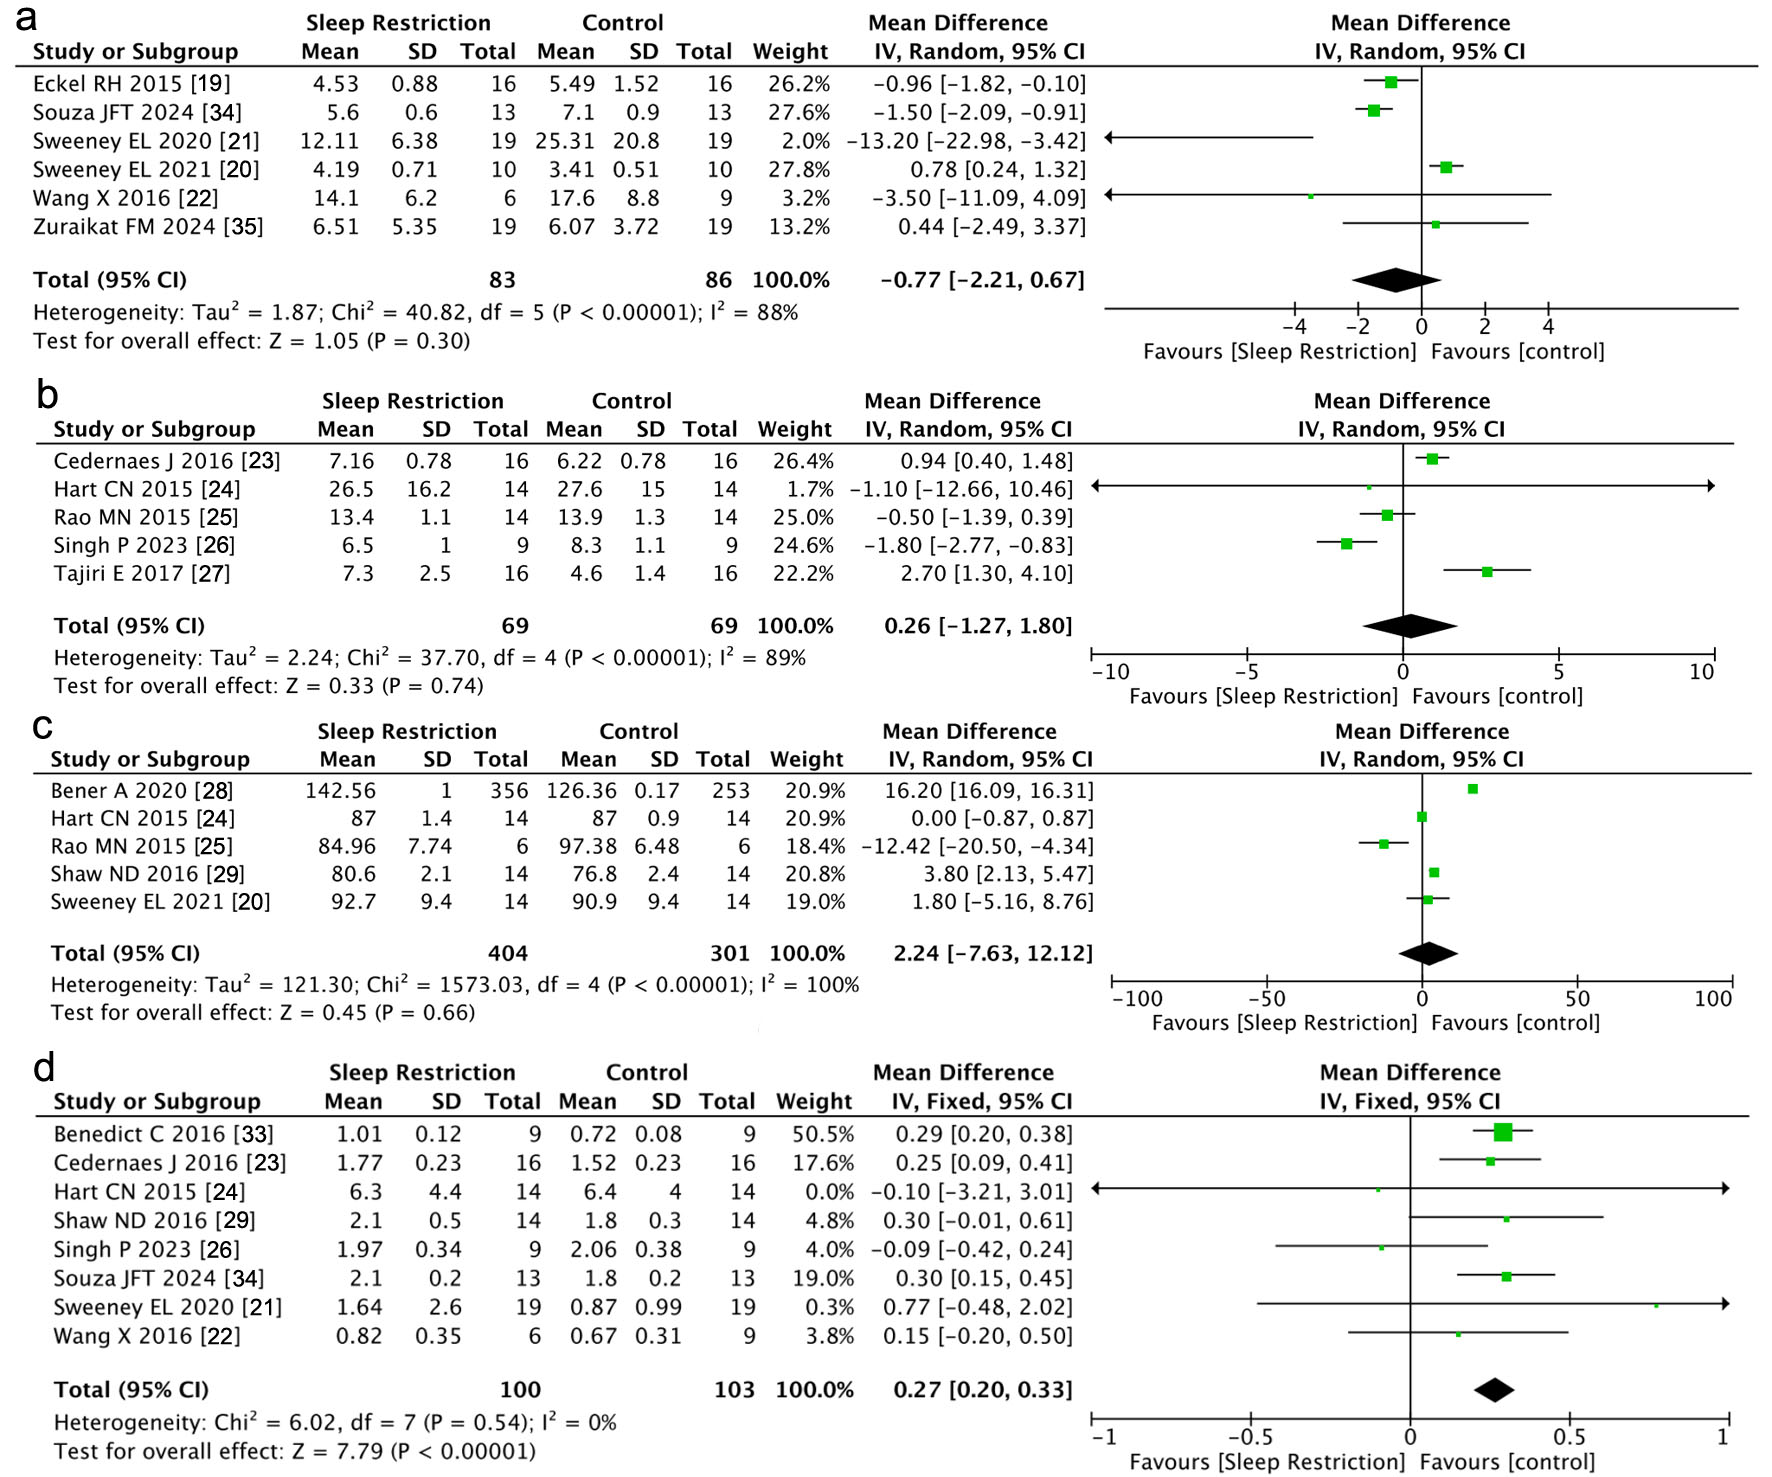 Click for large image | Figure 5. Forest plot illustrating the meta-analysis results on the effect of sleep restriction on insulin resistance, assessed by four different indicators: (a) Matsuda Index, (b) fasting blood insulin (FBI), (c) fasting blood glucose (FBG), and (d) homeostatic model assessment of insulin resistance (HOMA-IR). 95% CI: 95% confidence interval; SD: standard deviation; IV: inverse variance. |
FBI
Figure 5b illustrates the results of a meta-analysis evaluating the impact of sleep restriction on FBI levels (the number of included article = 5). Significant statistical heterogeneity was observed (P < 0.000001, I2 = 89%), warranting the use of a random-effects model. The combined MD was 0.26 (95% CI: −1.27 to 1.80). The test for overall effect (Z = 0.33, P = 0.74) indicated no statistically significant association between sleep restriction and IR as measured by FBI.
FBG
A meta-analysis of FBG levels across five studies is shown in Figure 5c (the number of included article = 5). High statistical heterogeneity was observed (P < 0.00001, I2 = 100%), and a random-effects model was employed. The combined results showed no significant association (Z = 0.45, P = 0.66), indicating that sleep restriction does not appear to significantly impact IR when assessed using FBG as an outcome.
HOMA-IR
Figure 5d displays the results of a meta-analysis evaluating sleep restriction in relation to IR measured by HOMA-IR (the number of included article = 8). No significant heterogeneity was identified (P = 0.54, I2 = 0%), supporting the reliability of the combined estimate. A random-effects model revealed a pooled MD of 0.27 (95% CI: 0.20–0.33), with a highly significant overall effect (Z = 7.79, P < 0.00001). Although variation in effect size existed among individual studies, e.g., Benedict et al (2016) reported a moderate effect (MD = 0.29; 95% CI: 0.20 to 0.38) [33], while Wang et al (2016) observed a smaller, nonsignificant effect (MD = 0.15; 95% CI: −0.20 to 0.50) [22], the overall analysis demonstrated a statistically robust association between sleep restriction and increased IR as measured by HOMA-IR.
Meta-analysis of sleep extension
HOMA-IR
In the investigation exploring the impact of extended sleep duration on IR, we primarily employed HOMA-IR as the observational metric to reflect IS (the number of included article = 5). A total of three studies were incorporated into the meta-analysis for this subgroup, as illustrated in the accompanying figure. The heterogeneity test results showed an I2 of 22% (< 80%), suggesting that the statistical outcomes were relatively reliable. Utilizing the inverse-variance method with a random-effects model, the statistical analysis revealed a significant difference in HOMA-IR between individuals with extended sleep duration and those with normal sleep duration (Z = 2.29, P = 0.02 (< 0.05)). Figure 6 indicates that statistically individuals with sleep extension exhibited a lower degree of IR compared to those with habitual sleep duration.
 Click for large image | Figure 6. Forest plot illustrating the meta-analysis results of the effect of prolonged sleep duration on insulin resistance, assessed by the homeostatic model assessment for insulin resistance (HOMA-IR). 95% CI: 95% confidence interval; SD: standard deviation; IV: inverse variance. |
Two-sample MR method
GLP-1RA and sleep phenotypes
1) Association between genetically proxied GLP-1 RA exposure and insomnia
Figure 7 illustrates the association between genetically proxied GLP-1 RA exposure (n = 8) and insomnia (n = 453,379), based on analysis of eight SNPs. Supplementary Material 1 (jem.elmerpub.com) presents the leave-one-out sensitivity analysis and the aggregate effect of all included SNPs is shown by the red line. Using the IVW method, represented by the blue line, the results demonstrated a slight positive trend (β = 0.0010, P < 0.05), with an intercept at odds ratio (OR) of 1.0010 (95% CI: 1.0000–1.00198), suggesting a marginal effect of genetically proxied GLP-1 RA exposure on insomnia risk. While the IVW analysis indicated statistical significance, Cochran’s Q test yielded a P-value < 0.05, indicating the presence of significant heterogeneity. However, the pleiotropy test returned a P-value > 0.05, suggesting no evidence of directional pleiotropy. These findings imply that factors other than genetically proxied GLP-1 RA exposure may be contributing to the observed effect, and that the selected SNPs may reflect exposures beyond the intended genetic proxy. Therefore, from a statistical standpoint, genetically proxied GLP-1 RA exposure does not appear to have a significant causal effect on insomnia.
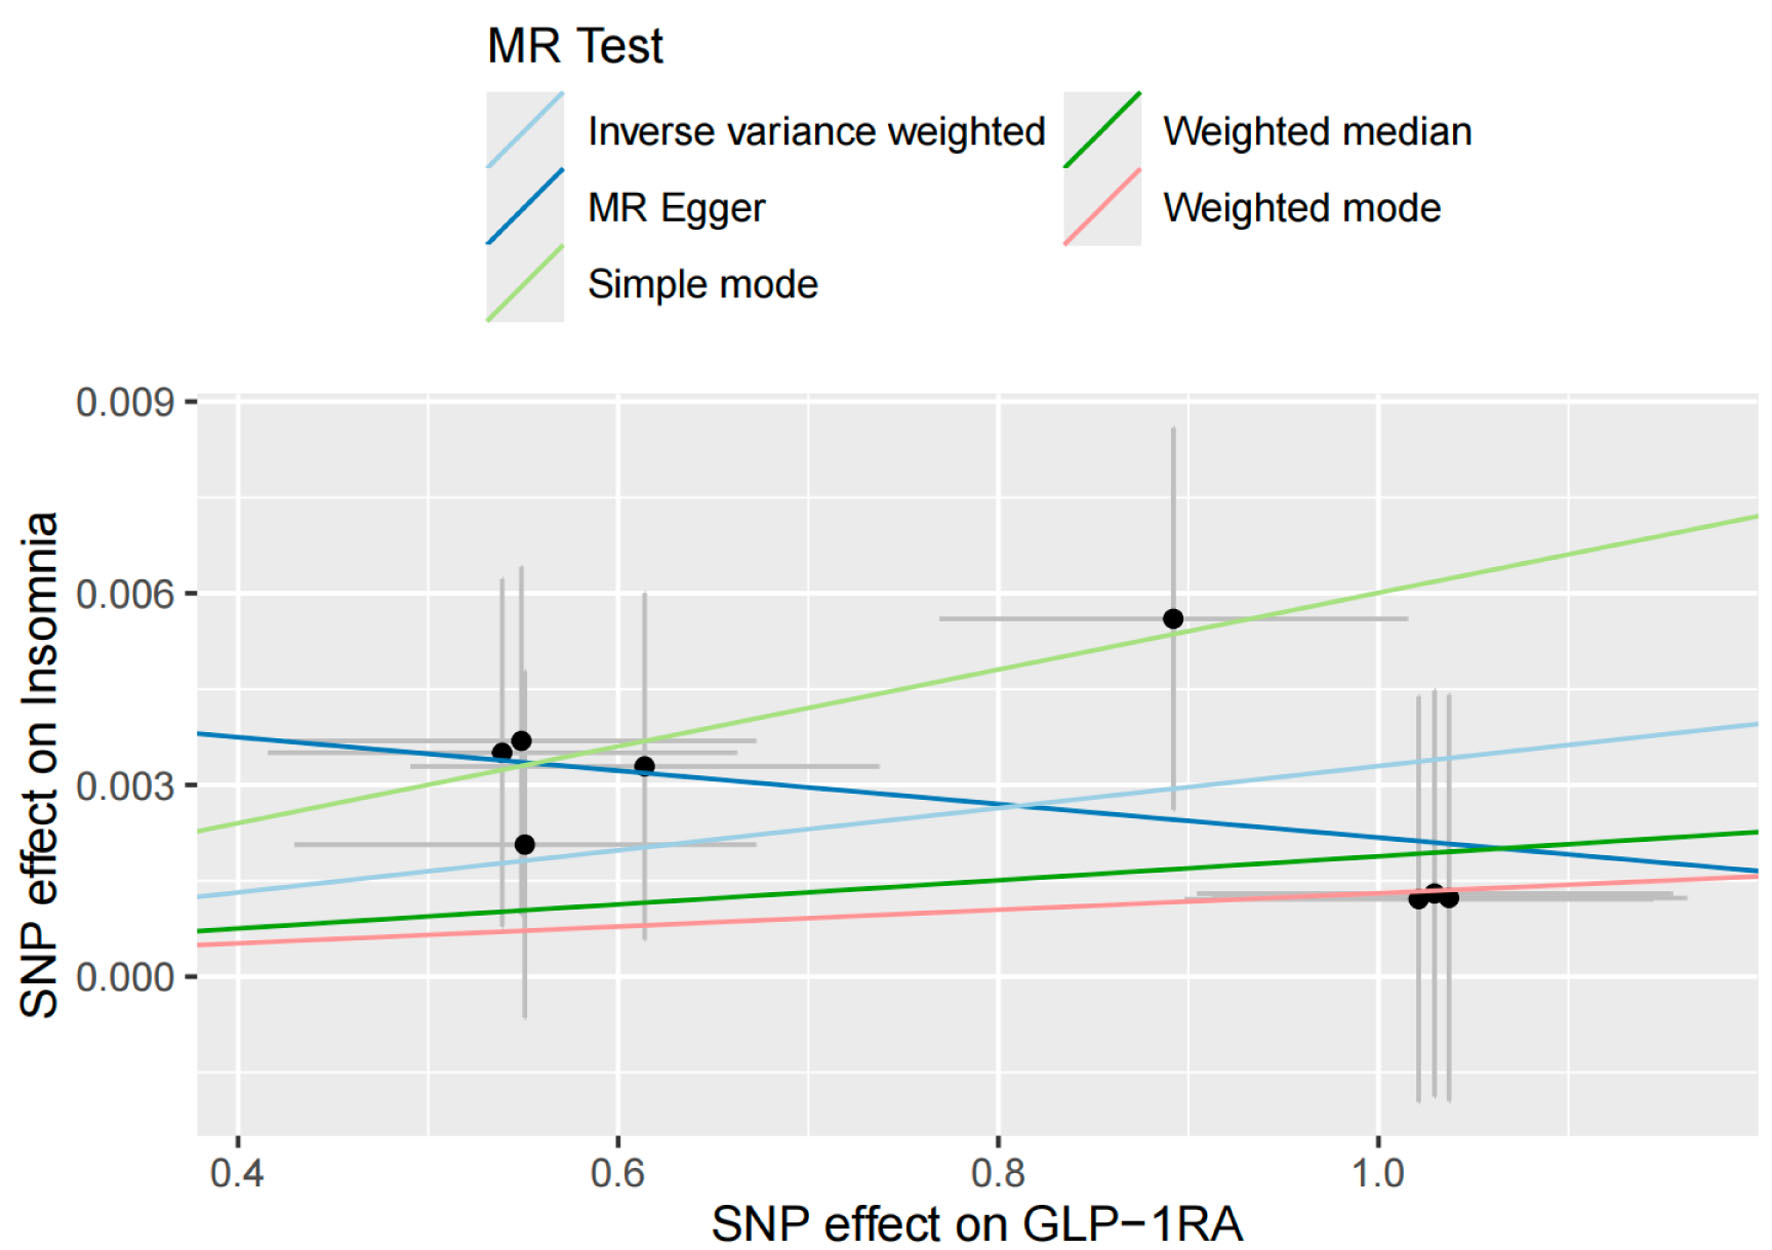 Click for large image | Figure 7. Scatter plot depicting the results of a two-sample Mendelian randomization (MR) analysis, with glucagon-like peptide-1 receptor agonist (GLP-1RA) as the exposure phenotype and insomnia as the outcome phenotype. Insomnia was defined as difficulty initiating or maintaining sleep. Participants who responded “sometimes” or “usually” to the question, “Do you have trouble falling asleep at night or do you wake up in the middle of the night?” were classified as having insomnia. |
2) Association between genetically proxied GLP-1 RA exposure and long sleep duration
To evaluate the relationship between genetically proxied GLP-1 RA exposure (n = 8) and prolonged sleep duration (n = 34,184), the IVW method was applied, as shown in Figure 8. This analysis, based on eight SNPs, revealed no statistically significant association (β = 8.18 × 10⁻⁵, P > 0.05; OR = 1.00008, 95% CI: 1.00008–1.00008). Supplementary Material 2 (jem.elmerpub.com), presenting the leave-one-out sensitivity analysis, further supported the absence of a meaningful effect. These findings suggest that genetically proxied GLP-1 RA exposure is not significantly associated with increased sleep duration.
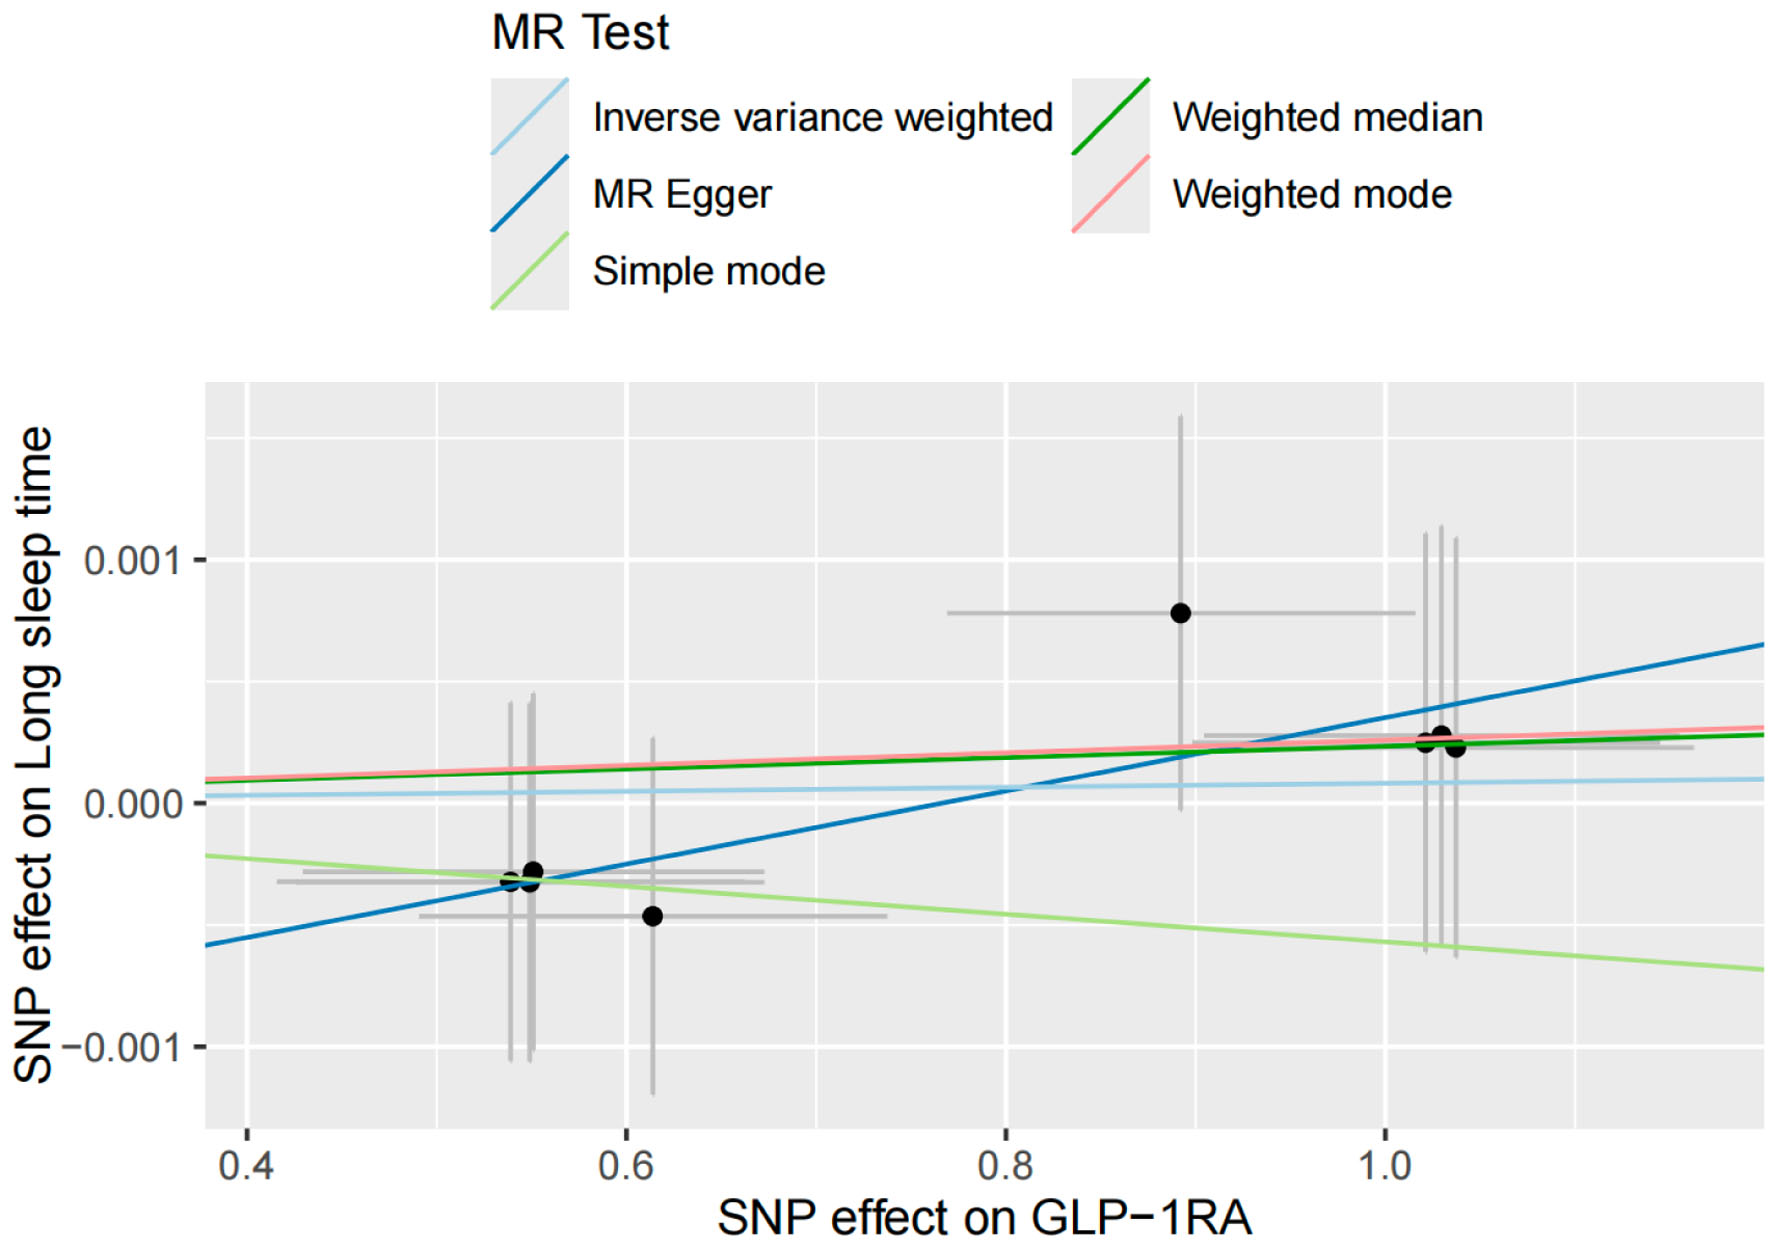 Click for large image | Figure 8. Scatter plot illustrating the results of a two-sample Mendelian randomization (MR) analysis with glucagon-like peptide-1 receptor agonist (GLP-1RA) as the exposure phenotype and long sleep duration as the outcome phenotype. Long sleep duration is defined as self-reported habitual sleep of more than 9 h per night. |
3) Association between genetically proxied GLP-1 RA exposure and short sleep duration
Figures 9 and Supplementary Material 3 (jem.elmerpub.com) depict the association between genetically proxied GLP-1 RA exposure (n = 8) and short sleep duration (n = 106,192). The IVW method (blue line, Fig. 9) and the leave-one-out sensitivity analysis (red line, Supplementary Material 3, jem.elmerpub.com) demonstrated a statistically significant positive association (β = 0.0026, P < 0.05; OR = 1.0026, 95% CI: 1.0017–1.0035), indicating that genetically proxied GLP-1 RA exposure may modestly increase the likelihood of short sleep duration. Cochran’s Q test yielded a P-value > 0.05, indicating no evidence of heterogeneity, while the pleiotropy test returned a P-value < 0.05, confirming consistency in the instrumental variables. These results support the hypothesis that genetically proxied GLP-1 RA exposure contributes to shorter sleep duration from a causal genetic perspective.
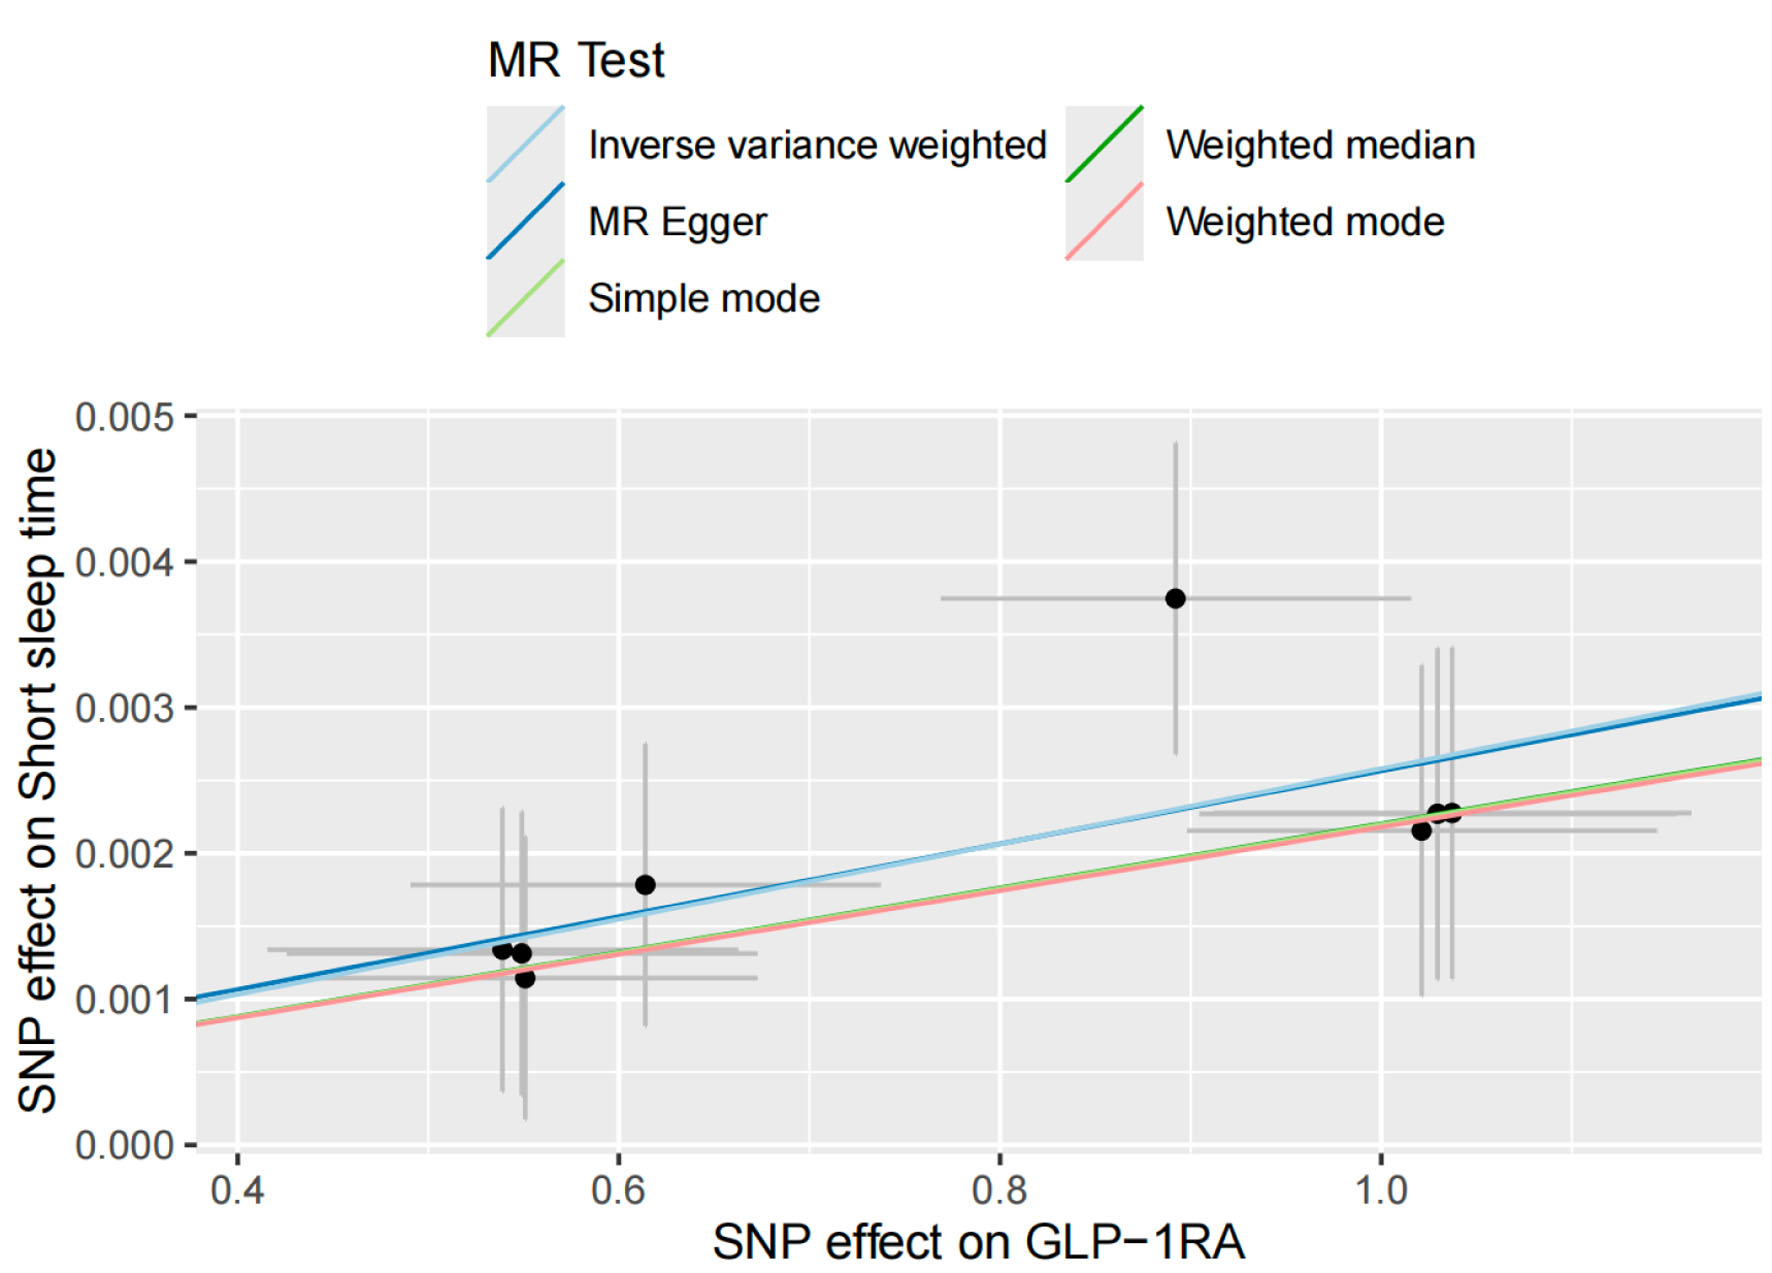 Click for large image | Figure 9. Scatter plot showing the results of a two-sample Mendelian randomization (MR) analysis with glucagon-like peptide-1 receptor agonist (GLP-1RA) as the exposure phenotype and short sleep duration as the outcome phenotype. Short sleep duration is defined as self-reported habitual sleep of less than 6 h per night. |
4) Association between genetically proxied GLP-1 RA exposure and chronotype
The final analysis focused on chronotype (n = 449,734), applying both the IVW method and leave-one-out sensitivity analysis. As illustrated in Figure 10 (IVW method, blue line) and Supplementary Material 4 (jem.elmerpub.com) (sensitivity analysis, red line), genetically proxied GLP-1 RA exposure (n = 8) was significantly associated with a shift toward a morning chronotype (β = 0.0033, P < 0.05; OR = 1.0033, 95% CI: 1.0017–1.0059).
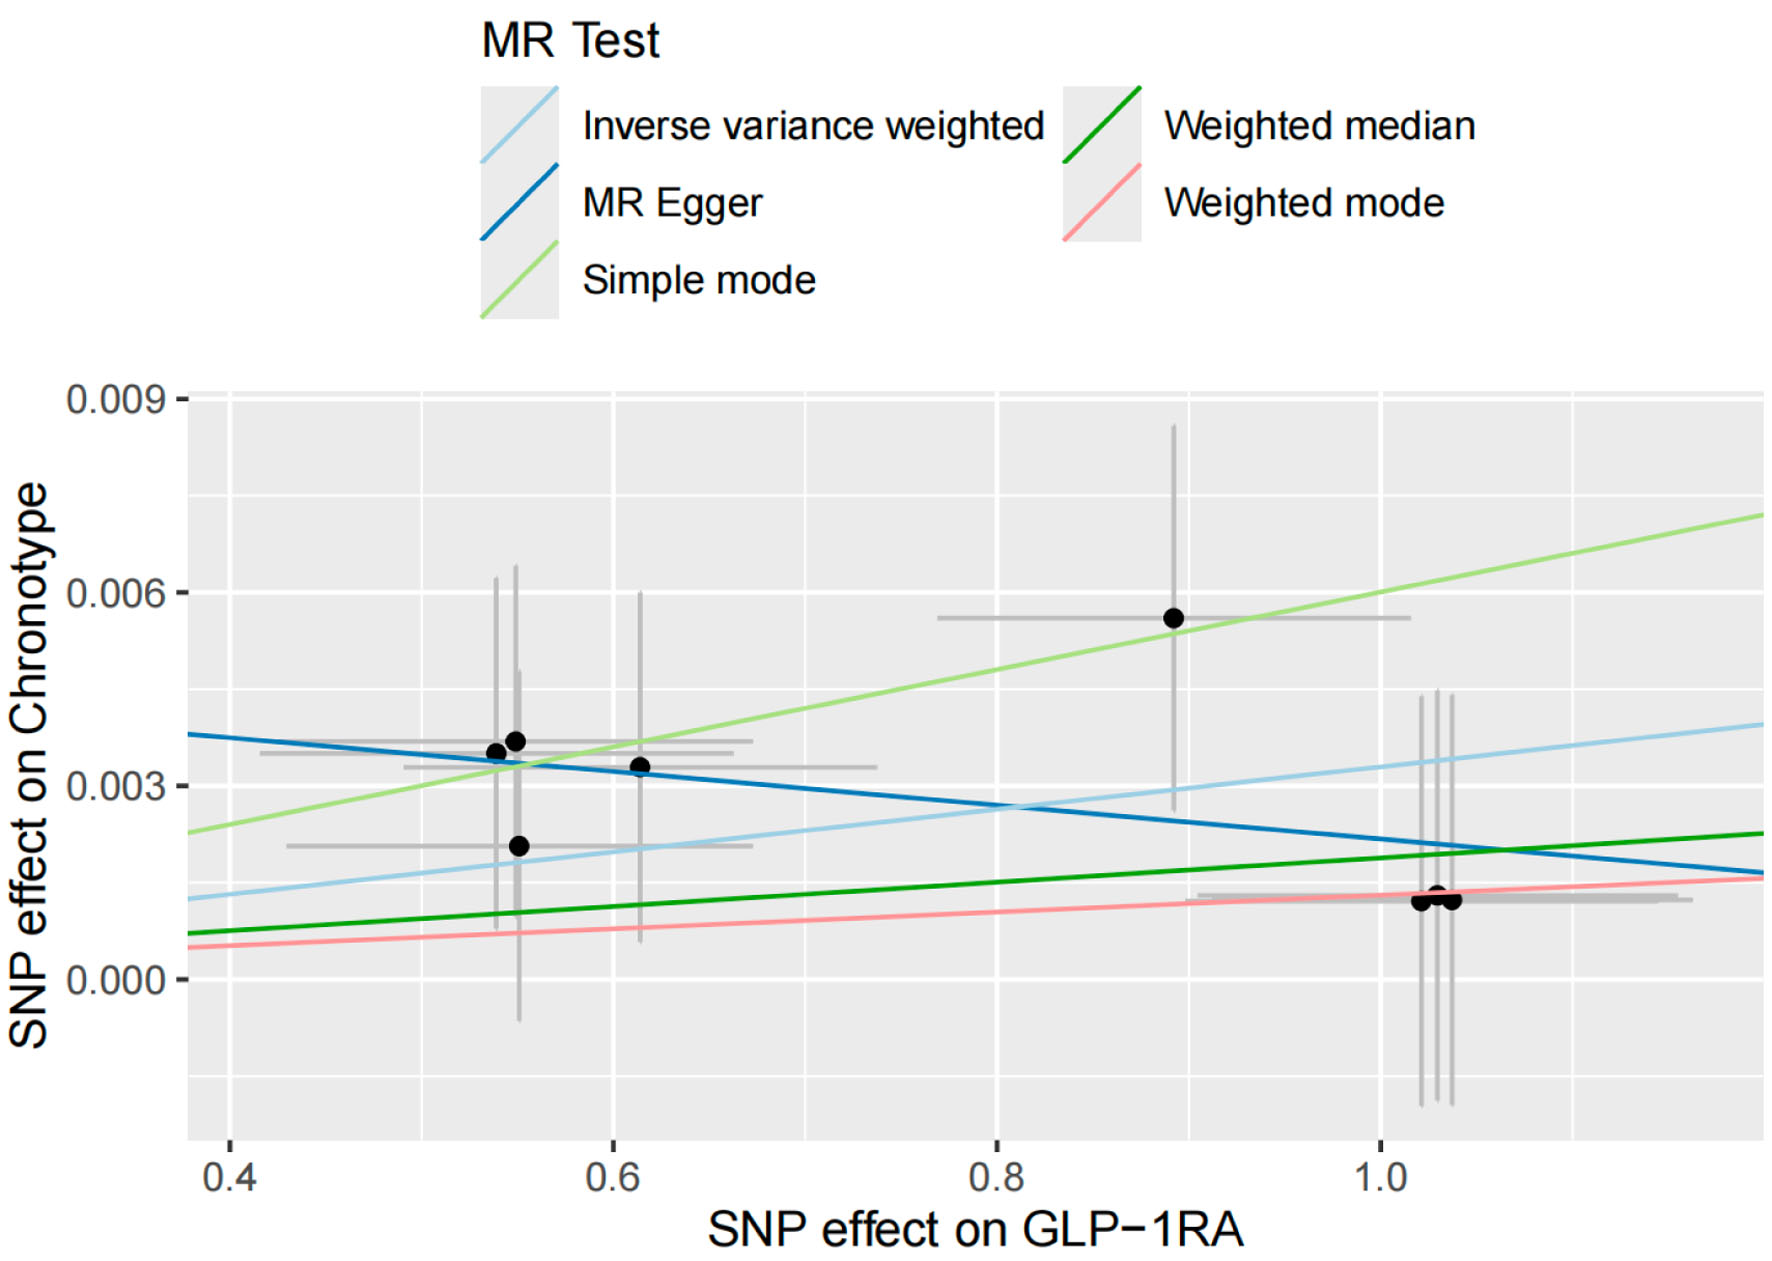 Click for large image | Figure 10. Scatter plot illustrating the results of a two-sample Mendelian randomization (MR) analysis with glucagon-like peptide-1 receptor agonist (GLP-1RA) as the exposure phenotype and chronotype as the outcome phenotype. Chronotype was defined based on responses to two identical questions: “Are you naturally a night person or a morning person?” For this study, only participants identifying as “morning people” or “early birds” were classified as having a morning chronotype. |
Cochran’s Q test returned a P-value > 0.05, indicating no significant heterogeneity among SNPs. The pleiotropy test yielded a P-value < 0.05, suggesting an absence of directional pleiotropic bias. These results provide robust statistical evidence that genetically proxied GLP-1 RA exposure is positively associated with a morning chronotype.
| Discussion | ▴Top |
IR remains a major challenge in the assessment and treatment of metabolic disorders such as T2DM, which poses a global burden on healthcare systems due to its strong association with mortality [47, 48]. In recent years, sleep has emerged as an important risk factor, attracting increasing attention amid widespread sleep deprivation [49, 50]. In this context, we conducted a meta-analysis comparing the HOMA-IR and Matsuda Index in evaluating IR within sleep clinical trials and non-interventional studies. Additionally, a two-sample MR analysis was performed to explore the potential effects of GLP-1RA on sleep duration and chronotype.
Our findings are consistent with previous evidence demonstrating that sleep restriction is positively associated with elevated IR, as assessed by HOMA-IR. Interestingly, our analyses revealed differing sensitivities among established IS indices in response to sleep alterations: HOMA-IR showed associations with sleep habit modifications, while the Matsuda Index did not reach statistical significance. Moreover, our MR analysis suggested that GLP-1RA use may be associated with shorter sleep duration and a morning chronotype, but not with insomnia or prolonged sleep. Collectively, these results support the interaction between sleep and IR, reinforce the utility of HOMA-IR as a responsive biomarker in sleep-metabolism studies, and reveal potential sleep-modulating effects of GLP-1RA, advocating for precision medicine approaches that integrate sleep pattern analysis.
Given the rising concern over sleep disturbances, driven by physiological, genetic, and broader societal factors [51], alongside the increasing prevalence of IR-related disorders [52], it is essential to explore the IR–sleep relationship using robust and novel biomarkers. Our meta-analysis revealed a positive association between sleep duration and IS, reaffirming the well-documented trend that shorter sleep is linked to increased IR. This aligns with findings from Rae et al, who demonstrated similar results using HOMA-IR in a cross-sectional study [53]. Notably, among various indices such as the Matsuda Index, FBG, and FBI derived from OGTT, only HOMA-IR—owing to its focus on hepatic glucose metabolism—showed a statistically significant association under both sleep-restricted and sleep-extended conditions. Although several studies have compared different IR indices [54], most focused on cardiovascular or metabolic outcomes rather than sleep, and often found no significant differences between HOMA-IR and the Matsuda Index. While the appropriateness of FBG for assessing IR has been debated [55], it remains widely used because of its role in OGTT and its importance in calculating several IR-related indices. This leads us to propose the following hypothesis: since both FBI and FBG primarily reflect hepatic glycogen metabolism, which is closely linked to IR, and because all sleep states occur during fasting, HOMA-IR—calculated using these two markers—may be more responsive to sleep-related changes. In contrast, the Matsuda Index incorporates not only fasting values but also insulin and glucose levels at various points during OGTT, which reflect peripheral IS. This broader scope may dilute its sensitivity to changes in fasting physiology, potentially explaining why it did not show statistical significance in our analysis [56]. Given the substantial difference in sample sizes between the HOMA-IR and Matsuda Index analyses, the lack of significance in the latter may primarily reflect insufficient statistical power rather than a true biological discrepancy. Nevertheless, the variation in sample sizes must also be considered, and additional real-world studies are needed to test this hypothesis. However, our finding that prolonged sleep is associated with improved IS appears to contrast with previous conclusions suggesting that excessive sleep may increase IR risk [57]. This apparent discrepancy can be clarified by examining the sleep patterns in the included studies. Most articles in our meta-analysis focused on nighttime sleep interventions, whereas studies linking long sleep duration to IR often involved daytime sleep or excessive napping [58, 59]. Therefore, it may be more accurate to conclude that extending nighttime sleep appropriately can reduce IR risk, while excessive daytime napping may have adverse metabolic effects. Taken together, our findings highlight the essential role of sleep in IR pathophysiology and suggest HOMA-IR as a potential more sensitive marker for detecting sleep-related changes in IS.
Building upon the meta-analytic evidence linking sleep and IR, our two-sample MR analysis indicated that individuals genetically predisposed to respond to GLP-1RA may experience shorter sleep durations and exhibit a morning chronotype. This finding differs from prior studies focused on GLP-1RA in the context of OSA, where it has demonstrated therapeutic benefits [60]. This discrepancy is understandable, as the mechanism by which GLP-1RAs improve OSA primarily involves reducing adiposity, thereby alleviating airway obstruction [61]. But uniquely, our study used a genetic approach excluding pathological sleep conditions and instead focused on physiological sleep traits.
Three potential mechanisms may explain these findings. First, GLP-1RA may influence central nervous system activity. Previous studies suggest overlapping brain regions involved in GLP-1RA signaling and the regulation of appetite and wakefulness [62]. In addition to stimulating insulin secretion, suppressing glucagon, and delaying gastric emptying [63], GLP-1RA may indirectly affect neuroendocrine pathways involved in sleep regulation. Second, dietary modulation induced by GLP-1RA may affect hormones such as melatonin, epinephrine, and cortisol [64], all of which are implicated in sleep architecture. Supporting this, studies of athletes on restrictive diets have reported reduced sleep duration and efficiency compared to non-athletes [65], likely due to negative energy balance—a condition comparable to that experienced by GLP-1RA users. However, the impact of dietary composition and caloric intake on sleep quality remains controversial [66, 67]. Additionally, research on glucose regulation and chronotype suggests that GLP-1RA may promote a morning chronotype through improved nocturnal glucose stability [68], potentially enhancing sleep quality without increasing the risk of insomnia [69, 70]. Third, the gut-brain axis may contribute to these effects through alterations in gut microbiota induced by GLP-1RA. Emerging evidence indicates that changes in gut microbiota composition can influence sleep regulation via the gut-brain axis [71]. Since GLP-1RAs interact with and may modify gut microbiota [72], this pathway could mediate sleep-related effects. Although direct evidence is currently lacking, we cautiously hypothesize that GLP-1RAs might affect the reticular activating system (RAS), which is responsible for sleep–wake cycles and arousal, potentially through the mechanisms described above. These findings add a novel dimension to the limited literature on the sleep-related effects of anti-IR therapies, suggesting that GLP-1RA may promote circadian alignment and emphasizing the need for clinicians to consider sleep characteristics when prescribing such treatments.
Nevertheless, several limitations should be acknowledged. First, the number of studies included in the meta-analysis may be insufficient to fully clarify the differences among IR indices, particularly due to the limited data assessing the Matsuda Index in sleep extension conditions. Second, the SNPs associated with GLP-1RA may be limited, raising concerns about potential pleiotropy. Third, while two-sample MR is a widely accepted method, summary-data-based MR may be more suitable for analyzing pharmacological effects, especially when the target receptors are ubiquitously expressed. To address these concerns, we performed comprehensive literature searches to expand data sources, and SNPs were carefully selected from the LDlink database based on the core principles of MR instrument validity: (1) relevance to the exposure, (2) no direct association with the outcome, and (3) independence from confounders. Moreover, we performed heterogeneity and pleiotropy tests for each MR result to ensure robustness. Despite the potential for false positives, including type I errors, we remain confident in our findings. Nonetheless, we encourage cautious interpretation and recommend further investigation—combining clinical traits and basic research—to elucidate the underlying biological mechanisms.
Conclusions
This study provides compelling evidence of a strong inverse relationship between sleep duration and IR, with HOMA-IR emerging as a particularly reliable index for assessing IR in the context of sleep. Additionally, individuals with IR who are genetically predisposed to respond to GLP-1RA may exhibit shorter sleep duration and a morning chronotype, highlighting the value of incorporating sleep follow-up into the clinical decision-making process for personalized IR management.
| Supplementary Material | ▴Top |
Suppl 1. Leave-one-out sensitivity analysis assessing the effect of glucagon-like peptide-1 receptor agonist (GLP-1RA) on insomnia using genetic instrumental variables.
Suppl 2. Leave-one-out sensitivity analysis evaluating the effect of glucagon-like peptide-1 receptor agonist (GLP-1RA) on long sleep duration using genetic instrumental variables.
Suppl 3. Leave-one-out sensitivity analysis assessing the effect of glucagon-like peptide-1 receptor agonist (GLP-1RA) on short sleep duration using genetic instrumental variables.
Suppl 4. Leave-one-out sensitivity analysis evaluating the effect of glucagon-like peptide-1 receptor agonist (GLP-1RA) on chronotype using genetic instrumental variables.
Acknowledgments
We extend our sincere gratitude to the researchers of the eQTLGen Consortium and the Sleep Disorder Knowledge Portal for making their GWAS databases publicly available. Their contributions have significantly facilitated our research.
Financial Disclosure
This study was supported by Project of Regional Joint Fund of the Basic and Applied Basic Research Foundation of Guangdong Province (No. 2025A1515010565); Talent Introduction Funding Project of The First Affiliated Hospital of Jinan University (No. 808026); Talent Introduction Funding Project of the First Affiliated Hospital of Jinan University (No. 808053); and the Scientific Research Project of Guangdong Provincial Bureau of Traditional Chinese Medicine (No. 20251078).
Conflict of Interest
The authors declare no conflict of interest.
Informed Consent
Not applicable.
Author Contributions
Si Rui Zeng: conceptualization, data curation, formal analysis, software, writing – original draft. Liang Yan Wu: funding acquisition, project administration, writing – review & editing. Cai Xia Ma: investigation, methodology, visualization, resources, validation. Xiao Fang Zhang: resources, project administration, methodology. Wei Lin Chen: formal analysis, investigation. Yong Ting Zhao: validation. Jia Xin Wang: methodology, software. Shi Shi Li: methodology. Li Hong Wang: funding acquisition, supervision, writing – review & editing.
Data Availability
All data generated or analyzed during this study are included in this published article.
Abbreviations
BMI: body mass index; CIs: confidence intervals; cis-eQTLs: cis-expression quantitative trait loci; FBG: fasting blood glucose; FBI: fasting blood insulin; FDA: Food and Drug Administration; GLP-1R: GLP-1 receptor; GLP-1RA: glucagon-like peptide-1 receptor agonist; GWAS: genome-wide association studies; HbA1c: hemoglobin A1c; HOMA-IR: homeostatic model assessment for insulin resistance; IFG: impaired fasting glucose; IR: insulin resistance; IVs: instrumental variables; IVW: inverse variance weighted; MAF: minor allele frequency; MD: mean difference; MeSH: Medical Subject Headings; MR: Mendelian randomization; OGTTs: oral glucose tolerance tests; OR: odds ratio; OSA: obstructive sleep apnea; RAS: reticular activating system; RCTs: randomized controlled trials; RevMan: Review Manager; IS: insulin sensitivity; SNPs: single nucleotide polymorphisms; T2DM: type 2 diabetes mellitus
| References | ▴Top |
- G. B. D. Diabetes Collaborators. Global, regional, and national burden of diabetes from 1990 to 2021, with projections of prevalence to 2050: a systematic analysis for the Global Burden of Disease Study 2021. Lancet. 2023;402(10397):203-234.
doi pubmed - Seong J, Kang JY, Sun JS, Kim KW. Hypothalamic inflammation and obesity: a mechanistic review. Arch Pharm Res. 2019;42(5):383-392.
doi pubmed - Parcha V, Heindl B, Kalra R, Li P, Gower B, Arora G, Arora P. Insulin resistance and cardiometabolic risk profile among nondiabetic American young adults: insights from NHANES. J Clin Endocrinol Metab. 2022;107(1):e25-e37.
doi pubmed - Reutrakul S, Van Cauter E. Sleep influences on obesity, insulin resistance, and risk of type 2 diabetes. Metabolism. 2018;84:56-66.
doi pubmed - Davies MJ, Aroda VR, Collins BS, Gabbay RA, Green J, Maruthur NM, Rosas SE, et al. Management of hyperglycemia in type 2 diabetes, 2022. A consensus report by the American Diabetes Association (ADA) and the European Association for the Study of Diabetes (EASD). Diabetes Care. 2022;45(11):2753-2786.
doi pubmed - Hirshkowitz M, Whiton K, Albert SM, Alessi C, Bruni O, DonCarlos L, Hazen N, et al. National Sleep Foundation's sleep time duration recommendations: methodology and results summary. Sleep Health. 2015;1(1):40-43.
doi pubmed - Watson NF, Badr MS, Belenky G, Bliwise DL, Buxton OM, Buysse D, Dinges DF, et al. Recommended amount of sleep for a healthy adult: a joint consensus statement of the American academy of sleep medicine and sleep research society. Sleep. 2015;38(6):843-844.
doi pubmed - Liu YY, Wang JX, Zhang Y. China sleep research report 2022. Annual Sleep Report of China; 2022. Beijing: Social Sciences Academic Press (SSAP). ISBN:9787520197373.
- Matthews DR, Hosker JP, Rudenski AS, Naylor BA, Treacher DF, Turner RC. Homeostasis model assessment: insulin resistance and beta-cell function from fasting plasma glucose and insulin concentrations in man. Diabetologia. 1985;28(7):412-419.
doi pubmed - Matsuda M, DeFronzo RA. Insulin sensitivity indices obtained from oral glucose tolerance testing: comparison with the euglycemic insulin clamp. Diabetes Care. 1999;22(9):1462-1470.
doi pubmed - Singh T, Ahmed TH, Mohamed N, Elhaj MS, Mohammed Z, Paulsingh CN, Mohamed MB, et al. Does insufficient sleep increase the risk of developing insulin resistance: a systematic review. Cureus. 2022;14(3):e23501.
doi pubmed - Sondrup N, Termannsen AD, Eriksen JN, Hjorth MF, Faerch K, Klingenberg L, Quist JS. Effects of sleep manipulation on markers of insulin sensitivity: A systematic review and meta-analysis of randomized controlled trials. Sleep Med Rev. 2022;62:101594.
doi pubmed - Santoro A, Kahn BB. Adipocyte regulation of insulin sensitivity and the risk of type 2 diabetes. N Engl J Med. 2023;388(22):2071-2085.
doi pubmed - Song Y, Chang Z, Song C, Cui K, Yuan S, Qiao Z, Bian X, et al. Association of sleep quality, its change and sleep duration with the risk of type 2 diabetes mellitus: Findings from the English longitudinal study of ageing. Diabetes Metab Res Rev. 2023;39(6):e3669.
doi pubmed - Mahaffey KW, Tuttle KR, Arici M, Baeres FMM, Bakris G, Charytan DM, Cherney DZI, et al. Cardiovascular outcomes with semaglutide by severity of chronic kidney disease in type 2 diabetes: the FLOW trial. Eur Heart J. 2025;46(12):1096-1108.
doi pubmed - Mediano O, Masa JF. Impact of glucagon-like peptide-1 analogues in the treatment of obstructive sleep Apnoea: a Pro/Con debate. Arch Bronconeumol. 2025;61(10):581-585.
doi pubmed - Kuehn BM. Sleep duration linked to cardiovascular disease. Circulation. 2019;139(21):2483-2484.
doi pubmed - Maung SC, El Sara A, Chapman C, Cohen D, Cukor D. Sleep disorders and chronic kidney disease. World J Nephrol. 2016;5(3):224-232.
doi pubmed - Eckel RH, Depner CM, Perreault L, Markwald RR, Smith MR, McHill AW, Higgins J, et al. Morning circadian misalignment during short sleep duration impacts insulin sensitivity. Curr Biol. 2015;25(22):3004-3010.
doi pubmed - Sweeney EL, Peart DJ, Ellis JG, Walshe IH. Impairments in glycaemic control do not increase linearly with repeated nights of sleep restriction in healthy adults: a randomised controlled trial. Appl Physiol Nutr Metab. 2021;46(9):1091-1096.
doi pubmed - Sweeney EL, Peart DJ, Kyza I, Harkes T, Ellis JG, Walshe IH. Impaired insulin profiles following a single night of sleep restriction: the impact of acute sprint interval exercise. Int J Sport Nutr Exerc Metab. 2020;30(2):139-144.
doi pubmed - Wang X, Greer J, Porter RR, Kaur K, Youngstedt SD. Short-term moderate sleep restriction decreases insulin sensitivity in young healthy adults. Sleep Health. 2016;2(1):63-68.
doi pubmed - Cedernaes J, Lampola L, Axelsson EK, Liethof L, Hassanzadeh S, Yeganeh A, Broman JE, et al. A single night of partial sleep loss impairs fasting insulin sensitivity but does not affect cephalic phase insulin release in young men. J Sleep Res. 2016;25(1):5-10.
doi pubmed - Hart CN, Carskadon MA, Demos KE, Van Reen E, Sharkey KM, Raynor HA, Considine RV, et al. Acute changes in sleep duration on eating behaviors and appetite-regulating hormones in overweight/obese adults. Behav Sleep Med. 2015;13(5):424-436.
doi pubmed - Rao MN, Neylan TC, Grunfeld C, Mulligan K, Schambelan M, Schwarz JM. Subchronic sleep restriction causes tissue-specific insulin resistance. J Clin Endocrinol Metab. 2015;100(4):1664-1671.
doi pubmed - Singh P, Beyl RA, Stephens JM, Noland RC, Richard AJ, Boudreau A, Hebert RC, et al. Effect of sleep restriction on insulin sensitivity and energy metabolism in postmenopausal women: A randomized crossover trial. Obesity (Silver Spring). 2023;31(5):1204-1215.
doi pubmed - Tajiri E, Yoshimura E, Hatamoto Y, Tanaka H, Shimoda S. Effect of sleep curtailment on dietary behavior and physical activity: a randomized crossover trial. Physiol Behav. 2018;184:60-67.
doi pubmed - Bener A, Al-Hamaq A, Agan AF, Ozturk M, Omer A. Sleeping disturbances and predictor risk factors among type 2 diabetic mellitus patients. Ann Afr Med. 2020;19(4):230-236.
doi pubmed - Shaw ND, McHill AW, Schiavon M, Kangarloo T, Mankowski PW, Cobelli C, Klerman EB, et al. Effect of slow wave sleep disruption on metabolic parameters in adolescents. Sleep. 2016;39(8):1591-1599.
doi pubmed - Chennaoui M, Arnal PJ, Drogou C, Sauvet F, Gomez-Merino D. Sleep extension increases IGF-I concentrations before and during sleep deprivation in healthy young men. Appl Physiol Nutr Metab. 2016;41(9):963-970.
doi pubmed - Reutrakul S, Martyn-Nemeth P, Quinn L, Rydzon B, Priyadarshini M, Danielson KK, Baron KG, et al. Effects of Sleep-Extend on glucose metabolism in women with a history of gestational diabetes: a pilot randomized trial. Pilot Feasibility Stud. 2022;8(1):119.
doi pubmed - So-Ngern A, Chirakalwasan N, Saetung S, Chanprasertyothin S, Thakkinstian A, Reutrakul S. Effects of two-week sleep extension on glucose metabolism in chronically sleep-deprived individuals. J Clin Sleep Med. 2019;15(5):711-718.
doi pubmed - Benedict C, Vogel H, Jonas W, Woting A, Blaut M, Schurmann A, Cedernaes J. Gut microbiota and glucometabolic alterations in response to recurrent partial sleep deprivation in normal-weight young individuals. Mol Metab. 2016;5(12):1175-1186.
doi pubmed - Souza JFT, Monico-Neto M, Tufik S, Antunes HKM. Sleep debt and insulin resistance: What's worse, sleep deprivation or sleep restriction? Sleep Sci. 2024;17(3):e272-e280.
doi pubmed - Zuraikat FM, Laferrere B, Cheng B, Scaccia SE, Cui Z, Aggarwal B, Jelic S, et al. Chronic insufficient sleep in women impairs insulin sensitivity independent of adiposity changes: results of a randomized trial. Diabetes Care. 2024;47(1):117-125.
doi pubmed - Li X, Pang X, Zhang Q, Qu Q, Hou Z, Liu Z, Lv L, et al. Long-term single and joint effects of excessive daytime napping on the HOMA-IR index and glycosylated hemoglobin: a prospective cohort study. Medicine (Baltimore). 2016;95(5):e2734.
doi pubmed - Widjaja NA, Kurube CF, Ardianah E. Sleep duration and insulin resistance in obese adolescents with metabolic syndrome: is there a correlation? Acta Biomed. 2023;94(4):e2023079.
doi pubmed - Gonzalez-Gonzalez JG, Violante-Cumpa JR, Zambrano-Lucio M, Burciaga-Jimenez E, Castillo-Morales PL, Garcia-Campa M, Solis RC, et al. HOMA-IR as a predictor of health outcomes in patients with metabolic risk factors: a systematic review and meta-analysis. High Blood Press Cardiovasc Prev. 2022;29(6):547-564.
doi pubmed - Chinese Diabetes Society. Expert consensus on insulin resistance (2022 edition). Chin J Diabetes Mellitus. 2022;14(12).
doi - Vosa U, Claringbould A, Westra HJ, Bonder MJ, Deelen P, Zeng B, Kirsten H, et al. Large-scale cis- and trans-eQTL analyses identify thousands of genetic loci and polygenic scores that regulate blood gene expression. Nat Genet. 2021;53(9):1300-1310.
doi pubmed - https://www.eqtlgen.org/.
- Sun Y, Liu Y, Dian Y, Zeng F, Deng G, Lei S. Association of glucagon-like peptide-1 receptor agonists with risk of cancers-evidence from a drug target Mendelian randomization and clinical trials. Int J Surg. 2024;110(8):4688-4694.
doi pubmed - https://sleep.hugeamp.org/.
- Lane JM, Jones SE, Dashti HS, Wood AR, Aragam KG, van Hees VT, Strand LB, et al. Biological and clinical insights from genetics of insomnia symptoms. Nat Genet. 2019;51(3):387-393.
doi pubmed - Jones SE, Lane JM, Wood AR, van Hees VT, Tyrrell J, Beaumont RN, Jeffries AR, et al. Genome-wide association analyses of chronotype in 697,828 individuals provides insights into circadian rhythms. Nat Commun. 2019;10(1):343.
doi pubmed - Dashti HS, Jones SE, Wood AR, Lane JM, van Hees VT, Wang H, Rhodes JA, et al. Genome-wide association study identifies genetic loci for self-reported habitual sleep duration supported by accelerometer-derived estimates. Nat Commun. 2019;10(1):1100.
doi pubmed - Penno G, Solini A, Orsi E, Bonora E, Fondelli C, Trevisan R, Vedovato M, et al. Insulin resistance, diabetic kidney disease, and all-cause mortality in individuals with type 2 diabetes: a prospective cohort study. BMC Med. 2021;19(1):66.
doi pubmed - Ausk KJ, Boyko EJ, Ioannou GN. Insulin resistance predicts mortality in nondiabetic individuals in the US. Diabetes Care. 2010;33(6):1179-1185.
doi pubmed - Cole HVS, Anguelovski I, Triguero-Mas M, Mehdipanah R, Arcaya M. Promoting health equity through preventing or mitigating the effects of gentrification: a theoretical and methodological guide. Annu Rev Public Health. 2023;44:193-211.
doi pubmed - Grandner MA. Sleep, health, and society. Sleep Med Clin. 2017;12(1):1-22.
doi pubmed - Koren D, Taveras EM. Association of sleep disturbances with obesity, insulin resistance and the metabolic syndrome. Metabolism. 2018;84:67-75.
doi pubmed - Ferrari CKB. Chapter 6 - Epidemiology of metabolic syndrome: global scenario. Metabolic syndrome, 2024. p. 59-71. Academic Press. ISBN 9780323857321.
doi - Rae DE, Pienaar PR, Henst RHP, Roden LC, Goedecke JH. Associations between long self-reported sleep, obesity and insulin resistance in a cohort of premenopausal Black and White South African women. Sleep Health. 2018;4(6):558-564.
doi pubmed - Zethelius B, Cederholm J. Comparison between indexes of insulin resistance for risk prediction of cardiovascular diseases or development of diabetes. Diabetes Res Clin Pract. 2015;110(2):183-192.
doi pubmed - Farkas GJ, Gordon PS, Trewick N, Gorgey AS, Dolbow DR, Tiozzo E, Berg AS, et al. Comparison of various indices in identifying insulin resistance and diabetes in chronic spinal cord injury. J Clin Med. 2021;10(23):5591.
doi pubmed - Titchenell PM, Lazar MA, Birnbaum MJ. Unraveling the regulation of hepatic metabolism by insulin. Trends Endocrinol Metab. 2017;28(7):497-505.
doi pubmed - Liu X, Chu A, Ding X. Investigating the associations between weekend catch-up sleep and insulin resistance: NHANES cross-sectional study. BMC Med. 2025;23(1):311.
doi pubmed - Zhang B, Liu W, Wang J, Zhang L, Wang K, Wang P. Sleep duration, daytime napping and the risk of incident metabolic syndrome vary by age and sex: findings from the China health and retirement longitudinal study. BMC Public Health. 2025;25(1):803.
doi pubmed - Kakutani-Hatayama M, Kadoya M, Morimoto A, Miyoshi A, Kosaka-Hamamoto K, Kanzaki A, Konishi K, et al. Excessive daytime napping independently associated with decreased insulin sensitivity in cross-sectional study - Hyogo Sleep Cardio-Autonomic Atherosclerosis cohort study. Front Endocrinol (Lausanne). 2023;14:1211705.
doi pubmed - Pack A, Grunstein R, Mokhlesi B, Ryan S, Schwab R, Gozal D. What will the impact be of use of tirzepatide in patients with obstructive sleep apnea (OSA)? Sleep. 2025;48(6):zsaf045.
doi pubmed - Yin S, Xu H, Zou J, Zhang C, Guan J, Yi H. 0565 obstructive sleep apnea, but not short sleep duration, is independently associated with insulin resistance: a large-scale cohort study. Sleep. 2020;43(Supplement_1):A216-A217.
doi - van Bloemendaal L, RG IJ, Ten Kulve JS, Barkhof F, Konrad RJ, Drent ML, Veltman DJ, et al. GLP-1 receptor activation modulates appetite- and reward-related brain areas in humans. Diabetes. 2014;63(12):4186-4196.
doi pubmed - Charest J, Grandner MA. Sleep and athletic performance: impacts on physical performance, mental performance, injury risk and recovery, and mental health. Sleep Med Clin. 2020;15(1):41-57.
doi pubmed - Zheng Z, Zong Y, Ma Y, Tian Y, Pang Y, Zhang C, Gao J. Glucagon-like peptide-1 receptor: mechanisms and advances in therapy. Signal Transduct Target Ther. 2024;9(1):234.
doi pubmed - St-Onge MP, Mikic A, Pietrolungo CE. Effects of diet on sleep quality. Adv Nutr. 2016;7(5):938-949.
doi pubmed - Cao C, Yu K, Lin F, Xu A, Zhou M. Relationship between relative fat mass and low-carbohydrate diet scores and sleep disorders in United States: a real-world cross-sectional study. Front Nutr. 2024;11:1500934.
doi pubmed - De Marchi F, Vignaroli F, Mazzini L, Comi C, Tondo G. New insights into the relationship between nutrition and neuroinflammation in Alzheimer's disease: preventive and therapeutic perspectives. CNS Neurol Disord Drug Targets. 2024;23(5):614-627.
doi pubmed - Chong GY, Kaur S, Talib RA, Loy SL, Tan HY, Harjit Singh SS, Abdullah RB, et al. Chronotype, chrononutrition and glucose tolerance among prediabetic individuals: research protocol for a prospective longitudinal study Chrono-DM. BMC Prim Care. 2022;23(1):193.
doi pubmed - Pelczynska M, Moszak M, Wojciechowska J, Plocienniczak A, Potocki J, Blok J, Balcerzak J, et al. The role of the chronotype in developing an excessive body weight and its complications-a narrative review. Nutrients. 2024;17(1):80.
doi pubmed - Ozsimsek F, Sert H, Gulbahar Eren M, Yaylaci S. Relationship between chronotype, healthy lifestyle behaviors, sleep quality and glycemic control in patients with type 2 diabetes mellitus: a cross-sectional study. Biological Rhythm Research. 2024;56(1):45-62.
doi - Sen P, Molinero-Perez A, O'Riordan KJ, McCafferty CP, O'Halloran KD, Cryan JF. Microbiota and sleep: awakening the gut feeling. Trends Mol Med. 2021;27(10):935-945.
doi pubmed - Zeng Y, Wu Y, Zhang Q, Xiao X. Crosstalk between glucagon-like peptide 1 and gut microbiota in metabolic diseases. mBio. 2024;15(1):e0203223.
doi pubmed
This article is distributed under the terms of the Creative Commons Attribution 4.0 International License (CC BY 4.0), which permits unrestricted use, distribution, and reproduction in any medium, including commercial use, provided the original work is properly cited.
Journal of Endocrinology and Metabolism is published by Elmer Press Inc.