| Journal of Endocrinology and Metabolism, ISSN 1923-2861 print, 1923-287X online, Open Access |
| Article copyright, the authors; Journal compilation copyright, J Endocrinol Metab and Elmer Press Inc |
| Journal website https://jem.elmerpub.com |
Original Article
Volume 16, Number 5, October 2026, pages 217-227

Prevalence, Geographic Distribution, and Socioeconomic Disparities of Normal-Weight Central Obesity: An Analysis of 46,493 Adults
Lily Mabel Portal-Valquia  , Adriana Mishell Yoplac-Oyarcea , Kevin Cusma-Regaladoa , Jhosmer Ballena-Caicedoa , Fiorella E. Zuzunaga-Montoyaa , Rossmery Leonor Poemape Mestanzaa, b , Marcos Francisco Garavito Castilloa, b , Víctor Juan Vera-Poncea, c
aFacultad de Medicina (FAMED), Universidad Nacional Toribio Rodríguez de Mendoza de Amazonas (UNTRM), Amazonas, Perú
bHospital Regional Virgen de Fátima, Chachapoyas, Perú
cCorresponding Author: Víctor Juan Vera-Ponce, Facultad de Medicina (FAMED), Universidad Nacional Toribio Rodríguez de Mendoza de Amazonas (UNTRM), Amazonas, Peru
Manuscript submitted March 7, 2026, accepted June 2, 2026, published online October 31, 2026
Short title: Normal-Weight Central Obesity
doi: https://doi.org/10.14740/jem1639
| Abstract | ▴Top |
Background: Normal-weight central obesity (NWCO) represents a metabolically adverse phenotype that is often overlooked when nutritional status is assessed using body mass index (BMI) alone. This study aimed to determine the prevalence of NWCO among Peruvian adults, characterize its geographic distribution using spatial autocorrelation, assess socioeconomic inequalities, and analyze temporal trends from 2018 to 2024.
Methods: An analytical cross-sectional study using ENDES 2018–2024 data with directly measured anthropometric information was conducted. Adults aged ≥18 years with normal weight (BMI 18.5–24.9 kg/m2) were included. NWCO was defined as waist circumference ≥ 80 cm in women or ≥ 90 cm in men. Prevalences were estimated accounting for the complex survey design; socioeconomic inequalities were assessed using the Slope Index of Inequality (SII), Relative Index of Inequality (RII), and concentration index; temporal trends were evaluated using linear regression; spatial autocorrelation was examined using global Moran’s I and local indicators of spatial association (LISA); and an ATP III-based sensitivity analysis was performed using waist circumference cutoffs of ≥ 88 cm in women and ≥ 102 cm in men.
Results: Among 46,493 adults with normal weight, 15,907 (35.1%; 95% confidence interval (CI): 34.4–35.9%) had NWCO. Prevalence was higher in women (58.9%) than in men (14.2%) and increased with age (25.0% in 18–29 years vs. 48.9% in ≥ 60 years). A positive socioeconomic gradient was observed: 26.7% in the lowest wealth quintile to 46.4% in the highest wealth quintile (SII = 0.23; RII = 1.93; concentration index = 0.100). At the departmental level, NWCO prevalence among adults with normal BMI ranged from 24.0% in Huancavelica to 41.9% in Tacna. Global Moran’s I was 0.167 (P = 0.070), and no significant LISA clusters were identified. No statistically significant temporal change was observed overall (−0.46 percentage points per year (pp/year), P = 0.172), among men (−0.21 pp/year, P = 0.356), or among women (−0.63 pp/year, P = 0.101). In sensitivity analyses using ATP III cutoffs, NWCO prevalence was substantially lower (8.0%; 95% CI: 7.6–8.4%) but remained concentrated among women and higher wealth groups.
Conclusions: More than one-third of Peruvian adults with normal weight have central obesity, with a female predominance, concentration in higher socioeconomic strata, and marked geographic heterogeneity without statistically significant spatial clustering after correction of the departmental estimand. These findings support incorporating waist circumference measurement into routine adult clinical assessment, including primary care visits, even when BMI is within the normal range.
Keywords: Central obesity; Normal weight; Waist circumference; Spatial analysis; Health inequities; Peru
| Introduction | ▴Top |
Assessment of nutritional status using body mass index (BMI) has been the standard in clinical and epidemiological practice for decades. However, this measure has limitations in identifying individuals with abnormal body fat distribution, particularly those with visceral adipose tissue accumulation despite a body weight within ranges considered normal [1]. This phenotype, termed normal-weight central obesity (NWCO), has gained prominence in the recent scientific literature because of its adverse metabolic profile [2–4].
Studies based on the NHANES III cohort have shown that individuals with NWCO have a higher risk of all-cause and cardiovascular mortality than those with obesity defined solely by BMI [5]. Specifically, men with normal weight but central obesity had a 1.87-fold higher mortality risk than their counterparts without central obesity, and a 2.42-fold higher risk than individuals with BMI-defined obesity but without central obesity. This finding challenges the traditional notion that BMI alone is sufficient to assess adiposity-related metabolic risk.
Visceral fat accumulation, characteristic of NWCO, is associated with insulin resistance, endothelial dysfunction, a chronic proinflammatory state, and disturbances in lipid metabolism [6, 7]. These mechanisms operate independently of total body weight, explaining why individuals with a normal BMI may have a cardiometabolic profile similar to, or even worse than, those with generalized obesity [8, 9].
In Latin America, the nutritional transition has driven a sustained increase in the prevalence of abdominal obesity. A recent systematic review reported a pooled abdominal obesity prevalence of 62% using International Diabetes Federation criteria in Latin American populations [10]. However, most studies have focused on general or abdominal obesity without specifically considering the NWCO phenotype. Peru is undergoing a rapid epidemiological transition toward excess weight [11]; therefore, characterizing this phenotype is particularly relevant [12]. Moreover, understanding socioeconomic inequities in the distribution of NWCO is essential to inform public health interventions and to determine whether this phenotype follows the same pattern as general obesity or shows a distinct distribution.
In Peru, technical guidance for adult anthropometric assessment includes waist circumference measurement and recommends recording anthropometric results in the clinical record. However, nutritional status classification in both clinical and epidemiological settings remains strongly BMI-centered. Consequently, adults with normal BMI but elevated waist circumference may be classified as apparently low-risk if waist circumference is not systematically incorporated into routine assessment. This gap supports the need to quantify NWCO and characterize the groups and territories in which it is most frequent.
NWCO should be interpreted as an operational anthropometric phenotype rather than as evidence of a fixed biological subtype. In cross-sectional data, this phenotype may reflect heterogeneous trajectories, including persistent normal BMI with central adiposity, early progression toward overweight or obesity, or context-specific body fat distribution. Longitudinal data are required to distinguish these possibilities.
Accordingly, this study aimed to: (1) determine the national and departmental prevalence of NWCO among Peruvian adults with normal weight; (2) characterize the geographic distribution of NWCO using spatial autocorrelation analysis; (3) assess socioeconomic inequalities in its distribution using absolute and relative inequality indices; and (4) analyze temporal trends in NWCO prevalence between 2018 and 2024.
| Materials and Methods | ▴Top |
Study design
We conducted an analytical cross-sectional observational study using publicly available secondary data from Peru’s Demographic and Family Health Survey (ENDES). The study purpose was descriptive. The analysis included seven consecutive years (2018–2024) because waist circumference measurements were systematically available starting in 2018. The manuscript was prepared following the Strengthening the Reporting of Observational Studies in Epidemiology (STROBE) guidelines [13]; the checklist is provided in Supplementary Material 1 (jem.elmerpub.com).
ENDES is a repeated cross-sectional survey; each annual round includes an independent sample, and participants were not followed across years. Therefore, temporal analyses assessed population-level annual changes rather than within-person longitudinal changes.
Data source
ENDES is a repeated cross-sectional, population-based survey conducted annually by Peru’s National Institute of Statistics and Informatics (INEI), with technical assistance from the USAID Demographic and Health Surveys (DHS) Program. The survey is nationally representative, representative at the level of the 24 departments and the Constitutional Province of Callao, and by area of residence (urban and rural) [14].
ENDES uses a two-stage, probabilistic, stratified sampling design that is independent within each department. In the first stage, clusters (primary sampling units) are selected with probability proportional to size. In the second stage, households within each cluster are selected through systematic sampling with a random start. The datasets are publicly available through the INEI portal.
Study population and sample
The target population comprised adults aged 18 years or older residing in Peru during the study period. Inclusion criteria were: (1) age ≥ 18 years at the time of the survey; (2) valid measurements of weight, height, and waist circumference recorded in the health module; and (3) complete information on the sociodemographic variables of interest.
Exclusion criteria were: (1) underweight (BMI < 18.5 kg/m2), given the study’s focus on individuals with normal weight; (2) incomplete information in the variables of interest; and (3) physiologically implausible anthropometric values (waist circumference < 50 or > 180 cm, BMI < 10 or > 60 kg/m2).
Variables
The dependent variable was NWCO, defined as a dichotomous variable (present/absent). NWCO was considered present when participants simultaneously met two conditions: (1) normal weight defined as BMI 18.5–24.9 kg/m2, and (2) central obesity defined as waist circumference ≥ 80 cm in women or ≥ 90 cm in men, according to the International Diabetes Federation (IDF) criteria for Latin American populations [15]. The IDF criterion was selected a priori as the primary definition because it provides sex-specific waist circumference thresholds commonly used for Latin American populations and allows comparison with regional evidence. However, because these thresholds have not been specifically validated in the Peruvian adult population, NWCO was treated as a screening-oriented operational definition rather than a diagnostic gold standard.
In ENDES, anthropometric measurements were obtained by trained field staff. Body weight was measured using calibrated digital scales (precision: 0.1 kg), and height using portable stadiometers (precision: 0.1 cm). Waist circumference was measured at the midpoint between the lower border of the last rib and the iliac crest using a non-elastic measuring tape (precision: 0.1 cm). BMI was calculated as weight in kilograms divided by height in meters squared.
Independent variables included sex (male/female), age in completed years at the time of the survey categorized into four groups (18–29, 30–44, 45–59, and ≥ 60 years), and educational level classified by the highest level attained into four categories: none, primary, secondary, and higher education. Area of residence was classified as urban or rural according to INEI census definitions. Urban areas comprise settlements with at least 100 contiguous dwellings or district capitals, whereas rural areas comprise settlements that do not meet this criterion or have dispersed dwellings. Natural region was categorized as Metropolitan Lima, rest of the Coast, Highlands, and Jungle. Department of residence was used as the geographic unit for the spatial analyses, including the 24 departments and the Constitutional Province of Callao.
We used the wealth index constructed by INEI using principal component analysis (PCA) based on a set of household assets. This index was categorized into population quintiles and used as a household-asset-based proxy of socioeconomic position. Quintile 1 represented the lowest wealth quintile and quintile 5 the highest wealth quintile.
Statistical analysis
Descriptive and inequality analyses accounted for the complex survey design by incorporating sampling weights, strata, and primary sampling units (clusters). For pooled multi-year analyses, sampling weights were divided by the number of years included. The scaled single-unit option was used to handle strata containing a single primary sampling unit.
Descriptive analysis included calculation of unweighted absolute frequencies and weighted percentages with their respective 95% confidence intervals (95% CIs). NWCO prevalences were estimated overall, stratified by each sociodemographic variable, and disaggregated by department. Participants were classified into four phenotypic groups: normal weight without central obesity, NWCO, overweight/obesity without central obesity, and overweight/obesity with central obesity.
Participants with missing or invalid values in anthropometric variables, survey design variables, or sociodemographic covariates used in the analyses were excluded from the complete-case analytic sample. No multiple imputation was performed because the study was descriptive and all primary analyses were based on complete cases after applying predefined eligibility criteria.
To assess socioeconomic inequalities in NWCO, three complementary indices were computed. The Slope Index of Inequality (SII), representing the absolute difference in prevalence between the theoretical extremes of the socioeconomic distribution, was estimated using weighted linear regression of prevalence on the ridit score modeled as a continuous variable. The ridit score represents the cumulative midpoint of the socioeconomic rank on a scale from 0 to 1, assigning each wealth group its relative position in the ordered socioeconomic distribution. The SII was estimated on the proportion scale; therefore, values were interpreted as absolute prevalence differences after multiplying by 100 and expressed as percentage points. A positive SII indicates higher prevalence in higher socioeconomic levels. The Relative Index of Inequality (RII) was estimated using Poisson regression on the ridit score. The concentration index quantifies the extent of socioeconomic inequality in the distribution of NWCO, ranging from −1 to +1, where 0 indicates perfect equality, negative values indicate concentration among lower socioeconomic levels, and positive values indicate concentration among higher socioeconomic levels. The concentration curve was constructed by plotting the cumulative proportion of NWCO cases against the cumulative proportion of the population ranked by socioeconomic level.
Because IDF waist circumference thresholds have not been specifically validated in Peruvian adults and may identify a broader screening-oriented phenotype, we performed a sensitivity analysis using ATP III cutoffs for central obesity, defined as waist circumference ≥ 102 cm in men and ≥ 88 cm in women. In this analysis, NWCO was redefined as normal BMI plus central obesity according to ATP III criteria. Prevalence estimates, socioeconomic inequality indices, and annual trends were re-estimated using the same complex survey design specification as in the primary analysis.
Temporal trends were assessed by estimating annual prevalences with 95% CIs. A linear regression model was fitted using the weighted annual prevalences as the outcome to estimate the annual change in prevalence (percentage points per year). Sex-stratified analyses were performed to examine differences in trends. Because the 2020 ENDES round was affected by the COVID-19 pandemic, INEI implemented telephone interviews and gradually resumed face-to-face fieldwork under biosafety procedures, including recovery of biometric measurements. Anthropometric measurements remained based on standardized procedures performed by trained field staff. Therefore, annual estimates for 2020–2021 were retained in the trend analysis but interpreted cautiously with respect to fieldwork comparability.
For spatial analysis, departmental prevalences of NWCO estimated under the complex survey design were used. A shapefile of Peru’s departmental boundaries was obtained from the Global Administrative Areas (GADM) database. The spatial weights matrix was constructed using Queen contiguity (departments sharing a border or vertex were considered neighbors), with row standardization.
Global spatial autocorrelation was assessed using Moran’s I, which measures the extent to which similar prevalence values cluster geographically. Positive I values indicate positive autocorrelation (clustering of similar values), negative values indicate negative autocorrelation (dispersion), and values near zero suggest a random spatial distribution. Statistical significance was assessed using Monte Carlo permutation tests with 999 simulations.
To identify local clusters of high or low prevalence, we used local indicators of spatial association (LISA) analysis [16]. This analysis computes a local Moran’s I for each department, allowing classification into four categories: high–high (hot spots: departments with high prevalence surrounded by departments with high prevalence), low–low (cold spots: low prevalence surrounded by low prevalence), high–low (outliers: high prevalence surrounded by low prevalence), and low–high (outliers: low prevalence surrounded by high prevalence). Clusters with P ≤ 0.05 were considered statistically significant.
Analyses were performed using Stata version 17 for complex survey data processing, and R version 4.3 with the sf, spdep, and tmap packages for spatial analysis and mapping.
Ethical considerations
This study used exclusively publicly available, fully anonymized secondary data, accessible through the INEI institutional portal. According to current Peruvian regulations, studies using anonymized secondary databases do not require additional approval from an institutional ethics committee.
| Results | ▴Top |
Study population and phenotype distribution
After applying the inclusion and exclusion criteria, 139,234 adults were included in the analysis (Supplementary Material 2, jem.elmerpub.com). Of these, 46,493 (33.4%) had normal weight (BMI 18.5–24.9 kg/m2) and constituted the analytic population for the primary NWCO prevalence estimates. Among the remaining participants, 8,173 (5.9%) had overweight/obesity without central obesity and 84,568 (60.7%) had overweight/obesity with central obesity.
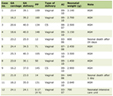
Marked differences were observed across phenotypic groups. Individuals with NWCO were predominantly women (78.6%) compared with those with normal weight without central obesity (29.7%) and those with overweight/obesity without central obesity (22.3%). Mean age was higher in the NWCO group (44.8 years) than in the normal weight without central obesity group (36.9 years). The NWCO group also had higher proportions living in urban areas (80.9%) and in higher wealth quintiles (22.7% in the richest quintile vs. 14.2% among those with normal weight without central obesity).
Regarding anthropometric measurements, individuals with NWCO had a higher mean waist circumference (87.9 cm) than those with normal weight without central obesity (79.4 cm), despite having similar BMI values (23.5 vs. 22.3 kg/m2).
Table 1 describes the sociodemographic composition of each body weight/central obesity phenotype, whereas Table 2 presents the prevalence of NWCO within the normal-weight analytic population across sociodemographic strata. Therefore, percentages in the NWCO column of Table 1 and prevalence estimates in Table 2 have different denominators and are not expected to be identical.
 Click to view | Table 1. Characteristics of Peruvian Adults According to Body Weight Phenotype and Central Obesity, ENDES 2018–2024 |
Click to view | Table 2. Prevalence of NWCO Among Peruvian Adults With Normal Weight by Sociodemographic Characteristics, ENDES 2018–2024 |
Prevalence of NWCO by sociodemographic characteristics
Among adults with normal weight, the overall prevalence of NWCO was 35.1% (95% CI: 34.4–35.9%), corresponding to 15,907 participants in the sample (Table 2). A marked sex difference was observed: NWCO prevalence was 58.9% (95% CI: 57.9–60.0%) in women and 14.2% (95% CI: 13.4–14.9%) in men, corresponding to an approximate prevalence ratio of 4:1.
Prevalence increased progressively with age, from 25.0% (95% CI: 24.0–25.9%) in the 18- to 29-year group to 48.9% (95% CI: 47.1–50.8%) among those aged ≥ 60 years, representing nearly a twofold difference between the extreme age groups. By natural region, Metropolitan Lima and the rest of the Coast showed similar prevalences (38.5% and 38.4%, respectively), higher than those observed in the Highlands and Jungle (30.8% in both). Urban residents had a higher prevalence (37.6%) than rural residents (27.5%).
Geographic distribution and spatial analysis
NWCO prevalence among adults with normal BMI showed descriptive geographic heterogeneity across the 24 departments and the Constitutional Province of Callao (Fig. 1a). The highest prevalences were observed in Tacna (41.9%; 95% CI: 38.5–45.4%), Tumbes (40.5%; 95% CI: 37.5–43.5%), Lima (38.6%; 95% CI: 36.8–40.3%), Piura (38.4%; 95% CI: 35.7–41.0%), Lambayeque (38.3%; 95% CI: 35.8–40.9%), and La Libertad (38.3%; 95% CI: 35.4–41.2%). The lowest prevalences were observed in Huancavelica (24.0%; 95% CI: 21.9–26.1%), Huánuco (27.2%; 95% CI: 24.9–29.5%), Puno (28.0%; 95% CI: 25.3–30.7%), Apurímac (28.6%; 95% CI: 26.3–30.9%), and Ayacucho (28.7%; 95% CI: 26.4–31.0%).
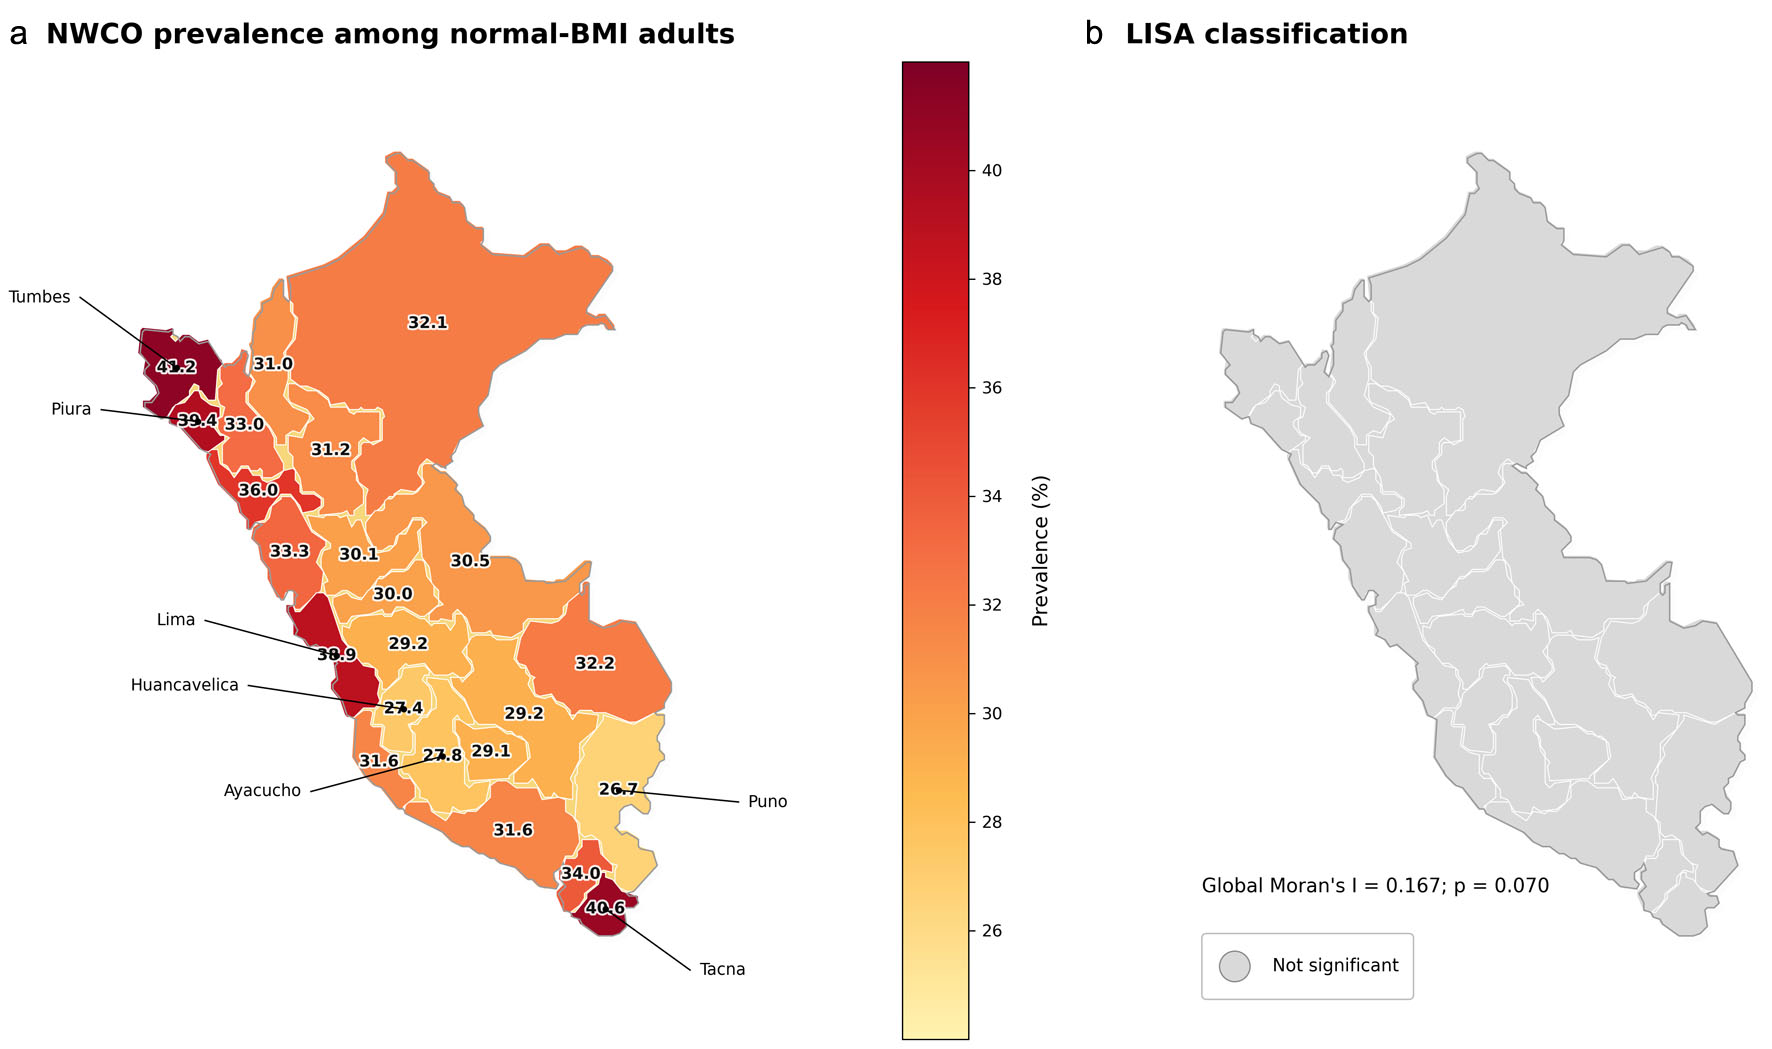 Click for large image | Figure 1. Geographic distribution of the prevalence of normal-weight central obesity (NWCO) by department among Peruvian adults with normal body mass index (BMI), ENDES 2018–2024. (a) Department-level point map using the corrected estimand among adults with normal BMI (range: 24.0–41.9%). (b) LISA classification; no statistically significant local clusters were identified. Global Moran’s I = 0.167 (Monte Carlo P = 0.070). |
Global Moran’s I was 0.167 (Monte Carlo P = 0.070), indicating that the observed departmental variation did not reach statistical significance for global spatial autocorrelation (Supplementary Material 3, jem.elmerpub.com). Consistently, LISA analysis did not identify statistically significant local clusters at P ≤ 0.05. Therefore, the corrected spatial analysis supports descriptive geographic heterogeneity but not statistically significant spatial clustering.
Socioeconomic inequalities
NWCO prevalence showed a consistent positive socioeconomic gradient: 26.7% in the lowest wealth quintile, 32.7% in the low wealth quintile, 35.2% in the middle wealth quintile, 39.0% in the high wealth quintile, and 46.4% in the highest wealth quintile (Table 2).
Socioeconomic inequality indices quantified this pattern (Table 3). The SII was 0.23 on the proportion scale (95% CI: 0.204–0.256), equivalent to an absolute difference of approximately 23 percentage points in NWCO prevalence between the theoretical extremes of the socioeconomic distribution. The RII was 1.93 (95% CI: 1.80–2.07), meaning that prevalence at the highest wealth rank was nearly double that at the lowest wealth rank in relative terms.
Click to view | Table 3. Socioeconomic Inequalities in NWCO Prevalence, ENDES 2018–2024 |
The concentration index was positive (0.100), indicating that NWCO is disproportionately concentrated in higher wealth quintiles. The concentration curve, consistently below the line of equality (diagonal), graphically demonstrates this concentration pattern among higher wealth groups (Fig. 2).
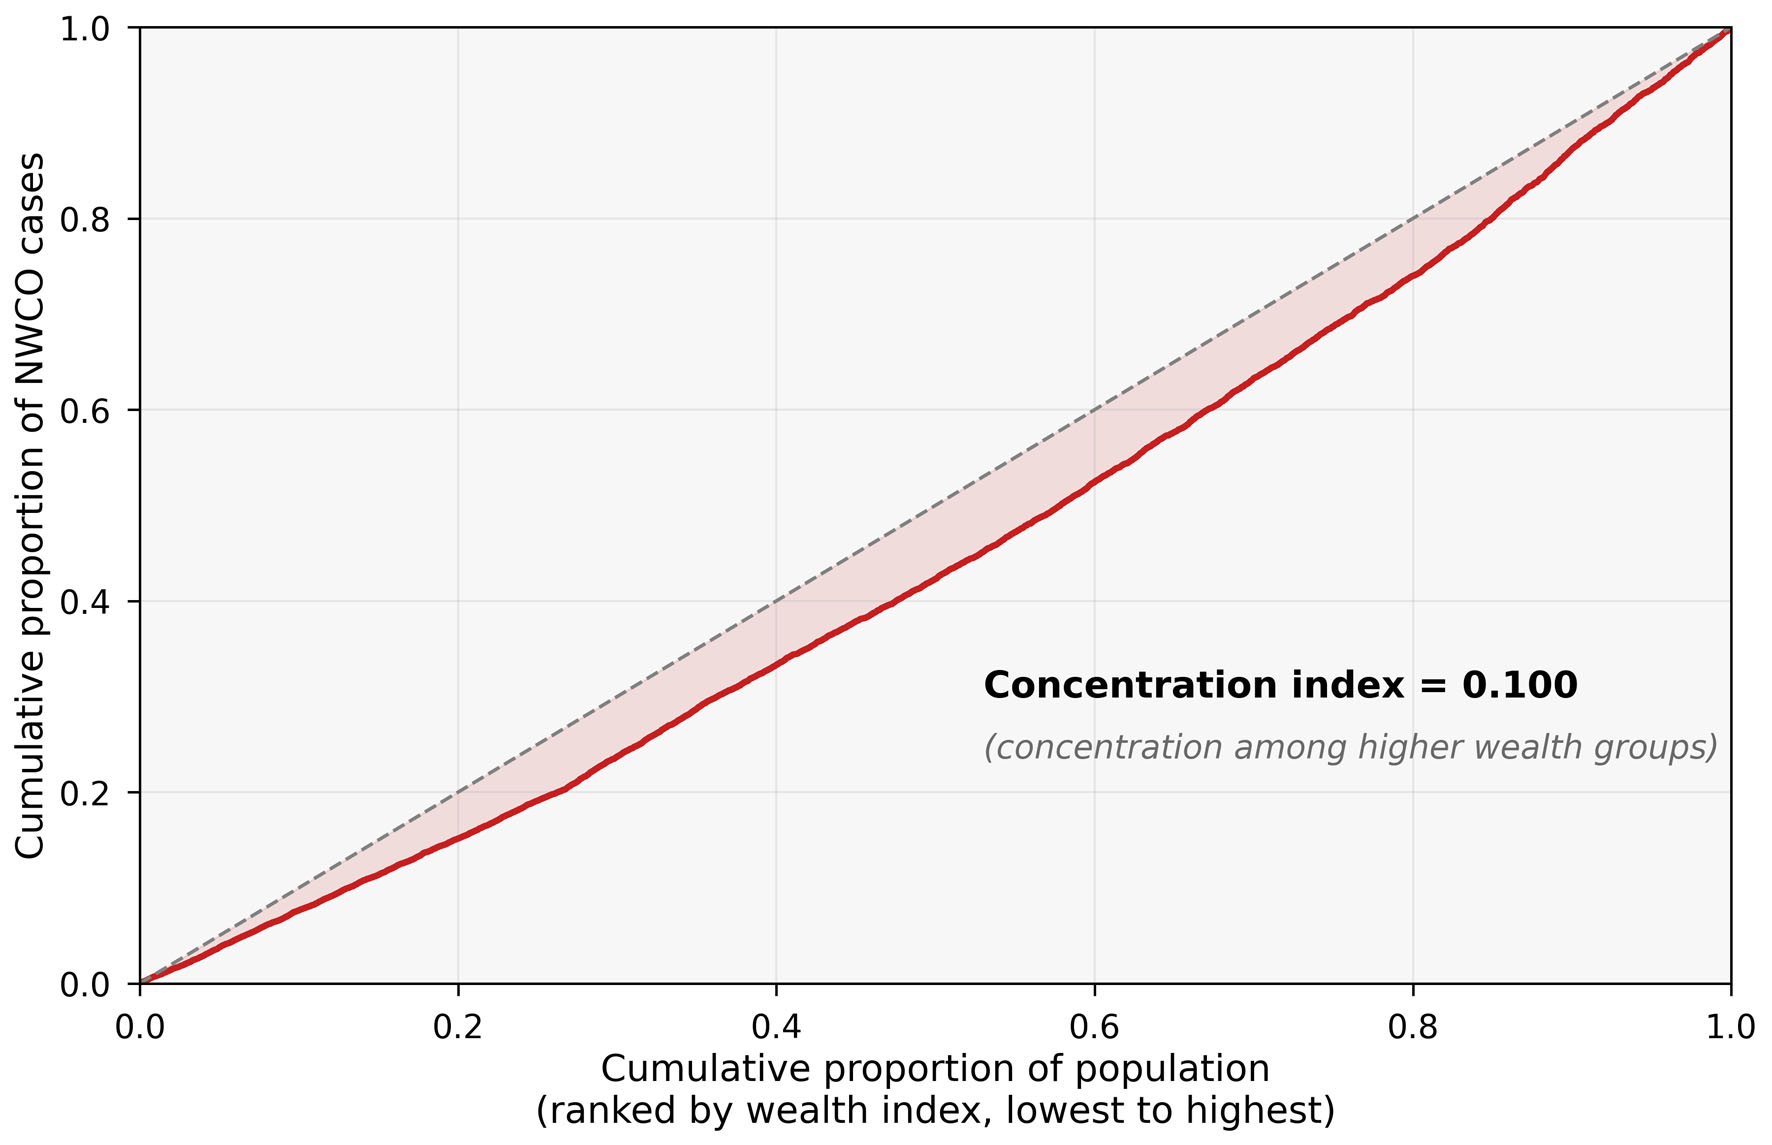 Click for large image | Figure 2. Concentration curve for normal-weight central obesity (NWCO) by wealth index, ENDES 2018–2024. The curve below the diagonal indicates concentration among higher wealth groups. Concentration index = 0.100. |
Temporal trend
NWCO prevalence ranged from 32.8% to 37.9% between 2018 and 2024 (Fig. 3). The year with the highest prevalence was 2019 (37.9%) and the lowest was 2023 (32.8%). The linear trend showed no statistically significant temporal change overall (−0.46 percentage points per year (pp/year), P = 0.172).
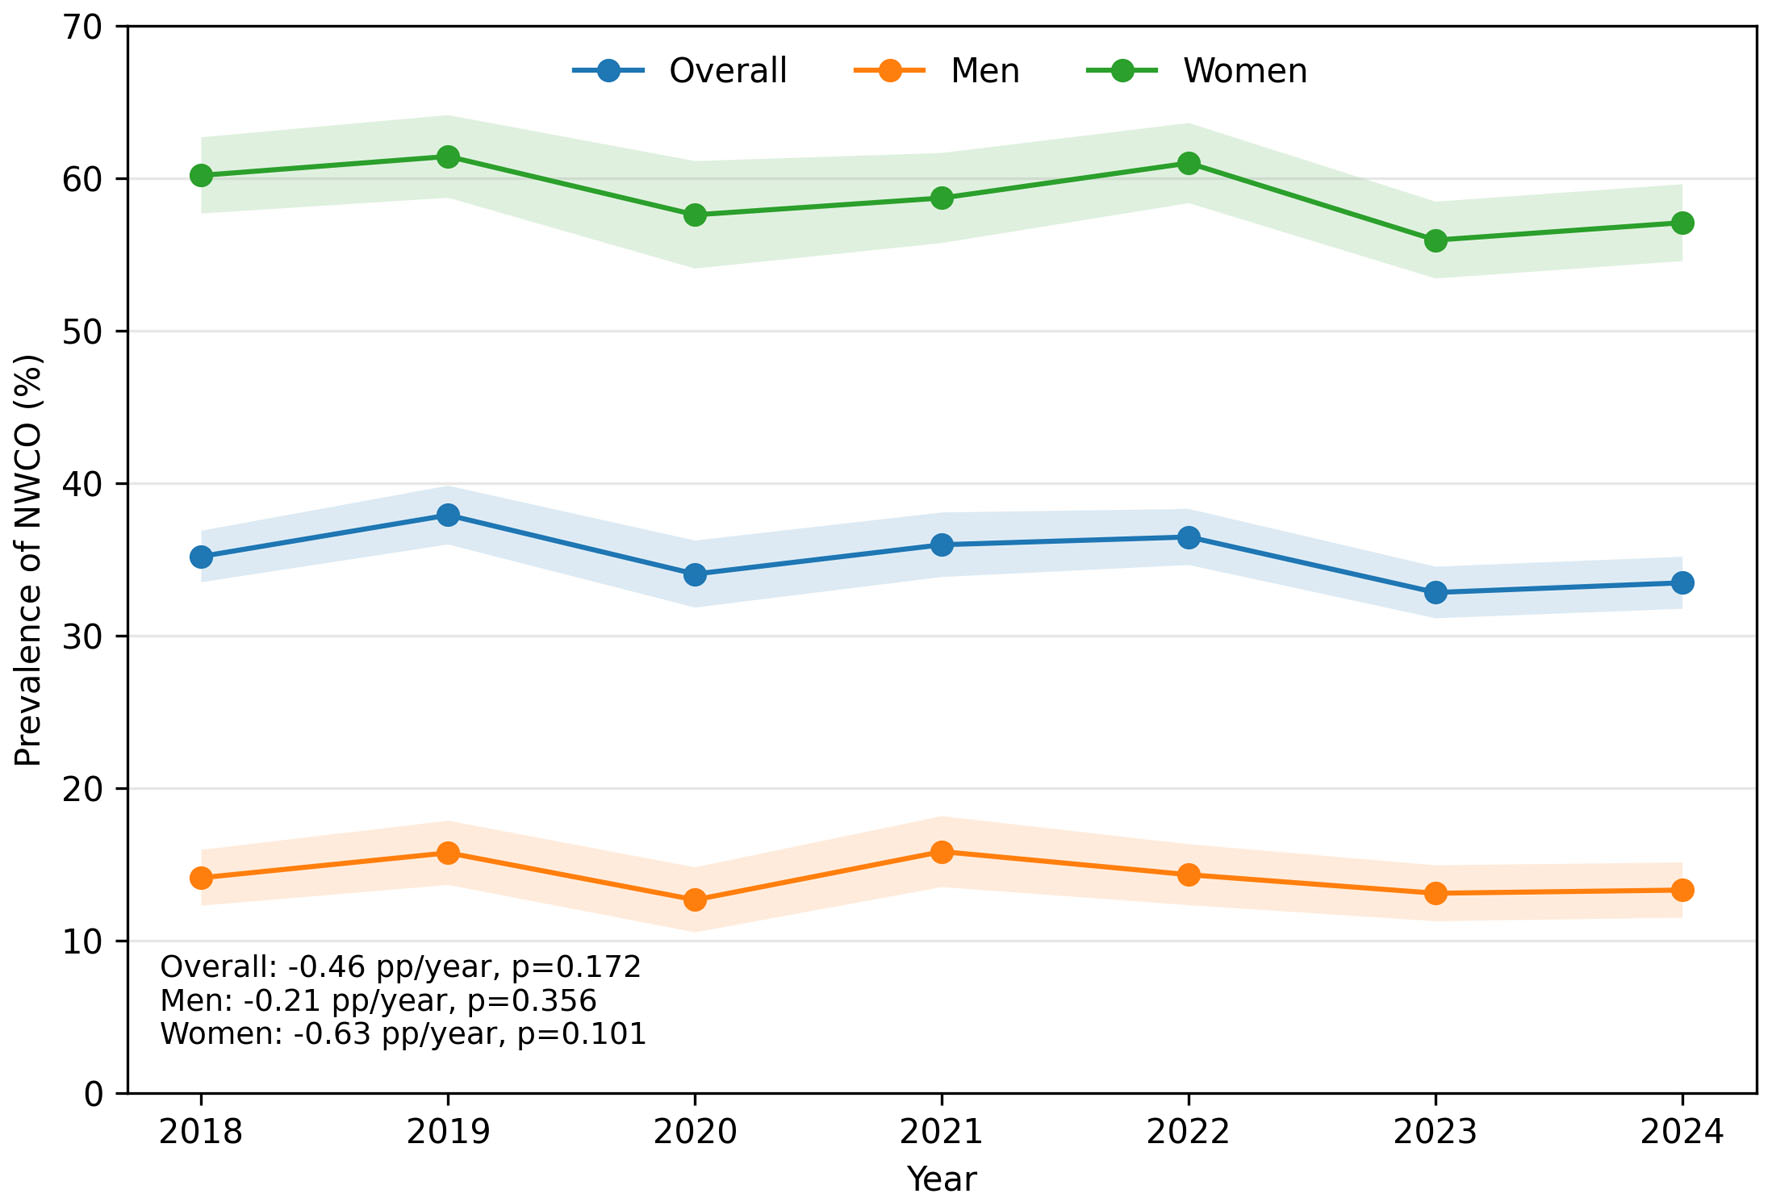 Click for large image | Figure 3. Temporal trends in normal-weight central obesity (NWCO) prevalence overall and by sex, ENDES 2018–2024. Annual change was not statistically significant overall (−0.46 pp/year, P = 0.172), among men (−0.21 pp/year, P = 0.356), or among women (−0.63 pp/year, P = 0.101). |
When stratified by sex, women consistently had a higher prevalence than men across all years, and the sex gap remained stable (Fig. 3). Prevalence in women ranged from 55.9% to 61.4%, whereas in men it ranged from 12.7% to 15.8%. No statistically significant annual change was observed among women (−0.63 pp/year, P = 0.101) or men (−0.21 pp/year, P = 0.356).
In the ATP III sensitivity analysis, NWCO prevalence was 8.0% (95% CI: 7.6–8.4%), substantially lower than the IDF-based estimate. The prevalence remained higher in women than in men (17.0% vs. 0.1%), higher in urban than rural residents (8.9% vs. 5.2%), and increased across wealth quintiles from 4.9% in the lowest wealth quintile to 11.5% in the highest wealth quintile. Socioeconomic inequality persisted under ATP III criteria, with an SII of 7.68 percentage points, an RII of 2.64, and a concentration index of 0.154. No statistically significant temporal trend was observed under ATP III criteria overall (−0.17 pp/year, P = 0.308), among women (−0.36 pp/year, P = 0.290), or among men (−0.005 pp/year, P = 0.489) (Supplementary Material 4, jem.elmerpub.com). Detailed sensitivity estimates are provided in Supplementary Materials 5 and 6 (jem.elmerpub.com).
| Discussion | ▴Top |
Main findings
This study shows that NWCO is a common phenotype among Peruvian adults, affecting more than one-third of those with a normal BMI. Moreover, NWCO exhibited a consistent epidemiological pattern: it predominated in women, increased with age, was more frequent in urban areas and in higher wealth quintiles, showed marked descriptive geographic heterogeneity without statistically significant global or local spatial clustering after correction of the departmental estimand, and did not show a significant linear temporal trend between 2018 and 2024. Clinically, these findings indicate that a substantial proportion of adults classified as “normal weight” by BMI may already have abdominal adiposity with metabolic relevance, suggesting that BMI alone is insufficient to capture this risk.
A methodologically relevant aspect of this study is that NWCO estimates were based on the waist circumference cutoffs established by the IDF (≥ 90 cm in men and ≥ 80 cm in women). Applying these thresholds in the Peruvian population yields prevalences markedly higher than those obtained with more conservative criteria: recent data in Peruvian adults show that abdominal obesity prevalence reaches 68.31% using the IDF criterion versus 44.75% using ATP III, a difference of more than 23 percentage points reflecting how strongly the selected threshold influences the final estimate [17]. Our ATP III sensitivity analysis confirmed this criterion dependence: NWCO prevalence decreased from 35.1% under IDF criteria to 8.0% under ATP III criteria. Nevertheless, the positive wealth gradient and the absence of statistically significant temporal change were preserved. The near-zero ATP III prevalence among normal-BMI men also indicates that sex-specific estimates are strongly influenced by the selected waist circumference threshold, reinforcing the need for Peruvian outcome-based validation studies rather than mechanical adoption of universal cutoffs.
The marked female predominance requires cautious interpretation. Part of this difference may reflect criterion-related effects, because the IDF waist circumference threshold is lower for women than for men. However, biological and life-course factors may also contribute. Menopausal transition is associated with a shift toward abdominal and visceral adiposity, and reproductive history, caregiving-related time constraints, occupational patterns, diet, and physical activity may influence central fat accumulation across adulthood. Because ENDES does not provide sufficiently detailed information on menopausal status, parity across all adult women, objectively measured physical activity, or detailed dietary intake for this specific analysis, these mechanisms should be interpreted as plausible explanatory pathways rather than causal conclusions.
Comparison with other studies
Our results are consistent with the available Peruvian evidence, although they suggest a greater magnitude of the problem. In a previous analysis using ENDES 2018–2021 data, Guerra Valencia and colleagues reported an NWCO prevalence of 26.7% and found associations with female sex, older age, higher wealth levels, lower frequency in the Andean region, and a history of hypertension and diabetes [12]. The higher prevalence observed in the present study may reflect the extended analytical period, differences in population composition, or temporal variation in exposure to obesogenic factors, rather than a shift in the epidemiological pattern previously described.
Internationally, our results are also consistent with recent literature questioning the adequacy of BMI as the sole marker of risk-related adiposity. A multi-continental study published in 2025, including 471,228 participants from 91 countries, found that 21.7% of adults with normal BMI had abdominal obesity; moreover, this phenotype was associated with hypertension, diabetes, hypercholesterolemia, and hypertriglyceridemia [18]. Similarly, a recent systematic review estimated a pooled NWCO prevalence of 21.1% and documented a significant association with type 2 diabetes (pooled odds ratio 1.82) [19]. Together, these data place Peru among high-burden settings within a problem that is now recognized globally.
Direct comparisons, however, should be interpreted with caution because the frequency of abdominal obesity varies markedly according to the anthropometric criterion used. A recent Latin American meta-analysis showed that abdominal obesity prevalence was 40% using ATP III criteria and 62% using IDF criteria, with a clear predominance in women in both cases [10]. This is especially relevant for NWCO, where small changes in waist cutoffs can substantially shift the observed prevalence and affect comparisons across countries and time periods.
Interpretation of geographic distribution and inequalities
The corrected spatial analysis supports descriptive geographic heterogeneity rather than statistically significant spatial clustering. Higher prevalences were observed in several coastal and southern departments, whereas lower prevalences were observed in Andean departments such as Huancavelica, Huánuco, Puno, Apurímac, and Ayacucho. In Peru, a multilevel analysis of abdominal obesity showed higher odds in women, older individuals, those with higher wealth index, and departments with higher Human Development Index [20]. This pattern is consistent with our findings and supports the hypothesis that urbanization, nutritional transition, and more sedentary environments may contribute to greater central fat accumulation even among individuals with normal BMI. However, because Moran’s I and LISA did not reach statistical significance after correction of the departmental estimand, territorial interpretations should be framed as descriptive rather than inferential evidence of clustering.
The concentration of NWCO among higher wealth groups contrasts with the pattern typically observed for general obesity in high-income countries, where the burden tends to be concentrated in socioeconomically disadvantaged groups. The positive wealth gradient identified in our study also warrants a specific interpretation. In a systematic review of Latin American cities, most associations between socioeconomic position and BMI-based obesity were inverse, especially in women, suggesting a reversal of the classic social gradient in several urban contexts in the region [21]. In contrast, NWCO in our analysis was concentrated in higher wealth quintiles. This may indicate that abdominal adiposity with normal BMI follows a different social logic than general obesity and that, in the Peruvian context, it is capturing hidden cardiometabolic risk in groups that would not necessarily be identified as priorities if BMI alone were used.
The lower frequency observed in Andean departments should be interpreted with caution. It may reflect true differences in lifestyle, occupation, or body habitus; however, it could also be partly influenced by limitations of the currently used cutoffs. A recent study in Peruvian adults showed clinically relevant differences by altitude, with 4–6 cm variations in waist circumference, and concluded that classic criteria may overestimate abdominal obesity prevalence in the Peruvian population [17]. Therefore, the spatial heterogeneity found likely reflects a combination of genuine contextual differences and some degree of misclassification arising from cutoffs not validated locally.
Public health implications
From a clinical perspective, these findings support the routine incorporation of waist circumference into adult assessment, even when BMI falls within the normal range. This recommendation is consistent with The Lancet Commission on the clinical definition of obesity, which emphasizes that BMI should not be used as the sole individual-level measure of adiposity and should be complemented with additional anthropometric or direct measures when clinically appropriate [22]. In the Peruvian context, an ENDES 2018–2023 analysis also showed that abdominal obesity was associated with higher hypertension prevalence, reinforcing the clinical value of waist circumference as an additional marker alongside BMI [23].
Programmatically, screening and interventions should prioritize women, older adults, urban residents, and territories with higher descriptive burden, particularly coastal and southern departments with high prevalences. NWCO should also be explicitly incorporated into cardiometabolic risk surveillance, as its temporal stability suggests that it is not a transient fluctuation but rather a persistent and underdetected burden. Finally, these results support the need to move toward national cutoffs or, at minimum, cutoffs contextualized by sex, age, and altitude to reduce misclassification and improve the targeting of interventions.
Limitations
This study has several limitations. First, its cross-sectional design does not allow assessment of the natural history of NWCO; consequently, this phenotype should be interpreted as an operational anthropometric category that may include individuals following different trajectories, including progression toward overweight or obesity. Second, waist circumference does not distinguish visceral fat from abdominal subcutaneous fat. Third, ENDES does not include direct measures of body composition nor potentially relevant clinical or behavioral variables, such as menopausal status, parity across all adult women, detailed diet, or objectively measured physical activity. Fourth, using waist cutoffs not specifically validated for the Peruvian population may have introduced misclassification; this limitation is particularly important in light of recent evidence of anthropometric differences by altitude and potential overestimation of prevalence when universal criteria are applied. Finally, departmental-level spatial analysis may mask within-department heterogeneity and is subject to limitations inherent to ecological analyses.
Conclusions and recommendations
NWCO is a common and potentially underdiagnosed phenotype in Peru. It affects more than one in three adults with normal BMI, predominates in women, increases with age, is concentrated in higher socioeconomic strata, shows geographic heterogeneity without statistically significant spatial clustering after correction of the departmental estimand, and did not show significant temporal changes during the analyzed period. These findings reinforce that BMI alone is insufficient to identify risk-related adiposity and that waist circumference should be integrated into routine clinical and epidemiological assessment.
Based on these findings, we recommend incorporating systematic waist circumference measurement at all levels of care; validating cutoffs specific to the Peruvian population by sex, age, and altitude; including NWCO in national surveillance systems; prioritizing territorial strategies in areas with the highest descriptive burden; and conducting longitudinal studies to evaluate its association with diabetes, hypertension, cardiovascular disease, and mortality in the Peruvian context.
| Supplementary Material | ▴Top |
Suppl 1. Strengthening the Reporting of Observational Studies in Epidemiology (STROBE) checklist for cross-sectional studies.
Suppl 2. Participant selection flow diagram.
Suppl 3. Moran’s I scatter plot after correction of the departmental estimand (I = 0.167; Monte Carlo P = 0.070).
Suppl 4. Temporal trend of NWCO using ATP III criteria, overall and by sex.
Suppl 5. Sensitivity analysis of NWCO prevalence using IDF and ATP III waist circumference criteria.
Suppl 6. Socioeconomic inequality indices for NWCO using IDF and ATP III criteria.
Acknowledgments
We thank the members of the Universidad Nacional Toribio Rodríguez de Mendoza de Amazonas (UNTRM), Amazonas, Peru, for their support and contributions during the conduct of this research.
Financial Disclosure
Article processing charges, if applicable upon acceptance, will be covered by the funding source (Vice-Rectorate for Research, Universidad Nacional Toribio Rodríguez de Mendoza de Amazonas), which had no role in study design, data collection and analysis, decision to publish, or preparation of the manuscript.
Conflict of Interest
The authors declare that they have no conflict of interest.
Informed Consent
Because this manuscript is based on a secondary data study, ethics committee approval was not required. For the same reason, as this is an analysis of existing data, informed consent from participants was not necessary. Likewise, a clinical trial registration number is not applicable to this research.
Author Contributions
Lily Mabel Portal-Valqui: investigation, methodology, software, data curation, writing – original draft, writing – review & editing. Adriana Mishell Yoplac-Oyarce: investigation, methodology, writing – original draft, writing – review & editing. Kevin Cusma-Regalado: methodology, software, validation, formal analysis, writing – review & editing. Jhosmer Ballena-Caicedo: methodology, software, formal analysis, writing – review & editing. Fiorella E. Zuzunaga-Montoya: investigation, supervision, project administration, validation, visualization, resources, writing – original draft, writing – review & editing. Rossmery Leonor Poemape Mestanza: investigation, methodology, supervision, writing – review & editing. Marcos Francisco Garavito Castillo: investigation, methodology, data curation, writing – review & editing. Víctor Juan Vera-Ponce: conceptualization, investigation, methodology, funding acquisition, writing – original draft, writing – review & editing.
Data Availability
The data supporting the findings of this study have been deposited in the Instituto Nacional de Estadística e Informática (INEI) repository and can be accessed via https://proyectos.inei.gob.pe/microdatos/
AI Use Declaration
The authors declare that neither generative artificial intelligence (AI) nor large language models (LLMs) were used in the conception, data analysis, or initial drafting of this manuscript.
| References | ▴Top |
- Stefan N, Schick F, Haring HU. Causes, characteristics, and consequences of metabolically unhealthy normal weight in humans. Cell Metab. 2017;26(2):292-300.
doi pubmed - Romero-Corral A, Somers VK, Sierra-Johnson J, Korenfeld Y, Boarin S, Korinek J, Jensen MD, et al. Normal weight obesity: a risk factor for cardiometabolic dysregulation and cardiovascular mortality. Eur Heart J. 2010;31(6):737-746.
doi pubmed - Bosomworth NJ. Normal-weight central obesity: Unique hazard of the toxic waist. Can Fam Physician. 2019;65(6):399-408.
pubmed - Zenas-Trujillo GZ, Trujillo-Ramirez I, Carhuavilca-Torres JM, Ayala-Mendivil RE, Vera-Ponce VJ. Prevalence of metabolically-obese normal-weight worldwide: systematic review and meta-analysis. J Endocrinol Metab. 2023;13(3):104-113.
doi - Sahakyan KR, Somers VK, Rodriguez-Escudero JP, Hodge DO, Carter RE, Sochor O, Coutinho T, et al. Normal-weight central obesity: implications for total and cardiovascular mortality. Ann Intern Med. 2015;163(11):827-835.
doi pubmed - Stefan N. Causes, consequences, and treatment of metabolically unhealthy fat distribution. Lancet Diabetes Endocrinol. 2020;8(7):616-627.
doi pubmed - Neeland IJ, Ross R, Despres JP, Matsuzawa Y, Yamashita S, Shai I, Seidell J, et al. Visceral and ectopic fat, atherosclerosis, and cardiometabolic disease: a position statement. Lancet Diabetes Endocrinol. 2019;7(9):715-725.
doi pubmed - Zhang C, Rexrode KM, van Dam RM, Li TY, Hu FB. Abdominal obesity and the risk of all-cause, cardiovascular, and cancer mortality: sixteen years of follow-up in US women. Circulation. 2008;117(13):1658-1667.
doi pubmed - Carmienke S, Freitag MH, Pischon T, Schlattmann P, Fankhaenel T, Goebel H, Gensichen J. General and abdominal obesity parameters and their combination in relation to mortality: a systematic review and meta-regression analysis. Eur J Clin Nutr. 2013;67(6):573-585.
doi pubmed - Vera-Ponce VJ, Loayza-Castro JA, Zuzunaga-Montoya FE, Vasquez-Romero LEM, Sanchez-Tamay NM, Bustamante-Rodriguez JC, Ballena-Caicedo J, et al. Abdominal obesity prevalence in Latin America: a systematic review and meta-analysis comparing ATP III and IDF criteria. Front Endocrinol (Lausanne). 2025;16:1562060.
doi pubmed - Vasquez-Romero LEM, Zuzunaga-Montoya FE, Loayza-Castro JA, Vigil-Ventura E, Ramos W, Vera-Ponce VJ. Prevalence of obesity according to body mass index, waist circumference, and waist-to-height ratio in Peru: A systematic review and meta-analysis. Obes Pillars. 2025;13:100166.
doi pubmed - Guerra Valencia J, Saavedra-Garcia L, Vera-Ponce VJ, Espinoza-Rojas R, Barengo NC. Factors associated with normal-weight abdominal obesity phenotype in a representative sample of the Peruvian population: a 4-year pooled cross-sectional study. J Clin Med. 2023;12(10):3482.
doi pubmed - von Elm E, Altman DG, Egger M, Pocock SJ, Gotzsche PC, Vandenbroucke JP, Initiative S. The Strengthening the Reporting of Observational Studies in Epidemiology (STROBE) statement: guidelines for reporting observational studies. Lancet. 2007;370(9596):1453-1457.
doi pubmed - National Institute of Statistics and Informatics (INEI). Technical sheet: Demographic and Family Health Survey (ENDES). Lima: INEI; 2024. Available from: https://proyectos.inei.gob.pe/endes/.
- International Diabetes Federation. IDF Diabetes Atlas. 10th ed. Brussels: International Diabetes Federation; 2021. Available from: https://diabetesatlas.org/idfawp/resource-files/2021/07/IDF_Atlas_10th_Edition_2021.pdf.
- Anselin L. Local Indicators of Spatial Association-LISA. Geogr Anal. 1995;27(2):93-115.
doi - Vera-Ponce VJ, Ballena-Caicedo J, Valladolid-Sandoval LAM, Zuzunaga-Montoya FE, Poemape Mestanza RL, Garavito Castillo MF, Gutierrez De Carrillo CI. Anthropometric percentiles for Peruvian adults: population reference curves for body mass index, waist circumference, and waist-to-height ratio. Int J Obes (Lond). 2026;50(5):1035-1045.
doi pubmed - Ahmed KY, Aychiluhm SB, Thapa S, Tegegne TK, Ketema DB, Kassa ZY, Kibret GD, et al. Cardiometabolic outcomes among adults with abdominal obesity and normal body mass index. JAMA Netw Open. 2025;8(10):e2537942.
doi pubmed - Bai J, Zhang Y, He L, Zhao Y. Normal weight central obesity and its impact on type 2 diabetes mellitus. Curr Diab Rep. 2024;25(1):3.
doi pubmed - Hernandez-Vasquez A, Olazo-Cardenas KM, Visconti-Lopez FJ, Barrenechea-Pulache A. What drives abdominal obesity in Peru? A multilevel analysis approach using a nationally representative survey. Int J Environ Res Public Health. 2022;19(16):10333.
doi pubmed - de Menezes MC, Duran AC, Langellier B, Perez-Ferrer C, Barnoya J, Mayen AL. Socioeconomic position, pre-obesity and obesity in latin american cities: a systematic review. Int J Soc Determinants Health Health Serv. 2024;54(3):224-232.
doi pubmed - Rubino F, Cummings DE, Eckel RH, Cohen RV, Wilding JPH, Brown WA, Stanford FC, et al. Definition and diagnostic criteria of clinical obesity. Lancet Diabetes Endocrinol. 2025;13(3):221-262.
doi pubmed - Laveriano-Terreros I, Bernabe-Ortiz A. Association between abdominal obesity and hypertension: analysis of the Peruvian Demographic Family Health Survey (2018-2023). Cad Saude Publica. 2025;41(7):e00143724.
doi pubmed
This article is distributed under the terms of the Creative Commons Attribution 4.0 International License (CC BY 4.0), which permits unrestricted use, distribution, and reproduction in any medium, including commercial use, provided the original work is properly cited.
Journal of Endocrinology and Metabolism is published by Elmer Press Inc.